
Prioritization of Supply Chain Digital Transformation Strategies Using Multi-Expert Fermatean Fuzzy Analytic Hierarchy Process
Abstract
Innovations in technology emerged with digitalization affect all sectors, including supply chain and logistics. The term “digital supply chain” has arisen as a relatively new concept in the manufacturing and service sectors. Organizations planning to utilize the benefits of digitalization, especially in the supply chain area, have uncertainties on how to adapt digitalization, which criteria they will evaluate, what kind of strategies should be developed, and which should be given more importance. Multi-criteria decision making (MCDM) approaches can be addressed to determine the best strategy under various criteria in digital transformation. Because of the need to capture this uncertainty, fermatean fuzzy sets (FFSs) have been preferred in the study to widen the definition domain of uncertainty parameters. Interval-valued fermatean fuzzy sets (IVFFSs) are one of the most often used fuzzy set extensions to cope with uncertainty. Therefore, a new interval-valued fermatean fuzzy analytic hierarchy process (IVFF-AHP) method has been developed. After determining the main criteria and sub-criteria, the IVFF-AHP method has been used for calculating the criteria weights and ranking the alternatives. By determining the most important strategy and criteria, the study provides a comprehensive framework of digital transformation in the supply chain.
1Introduction
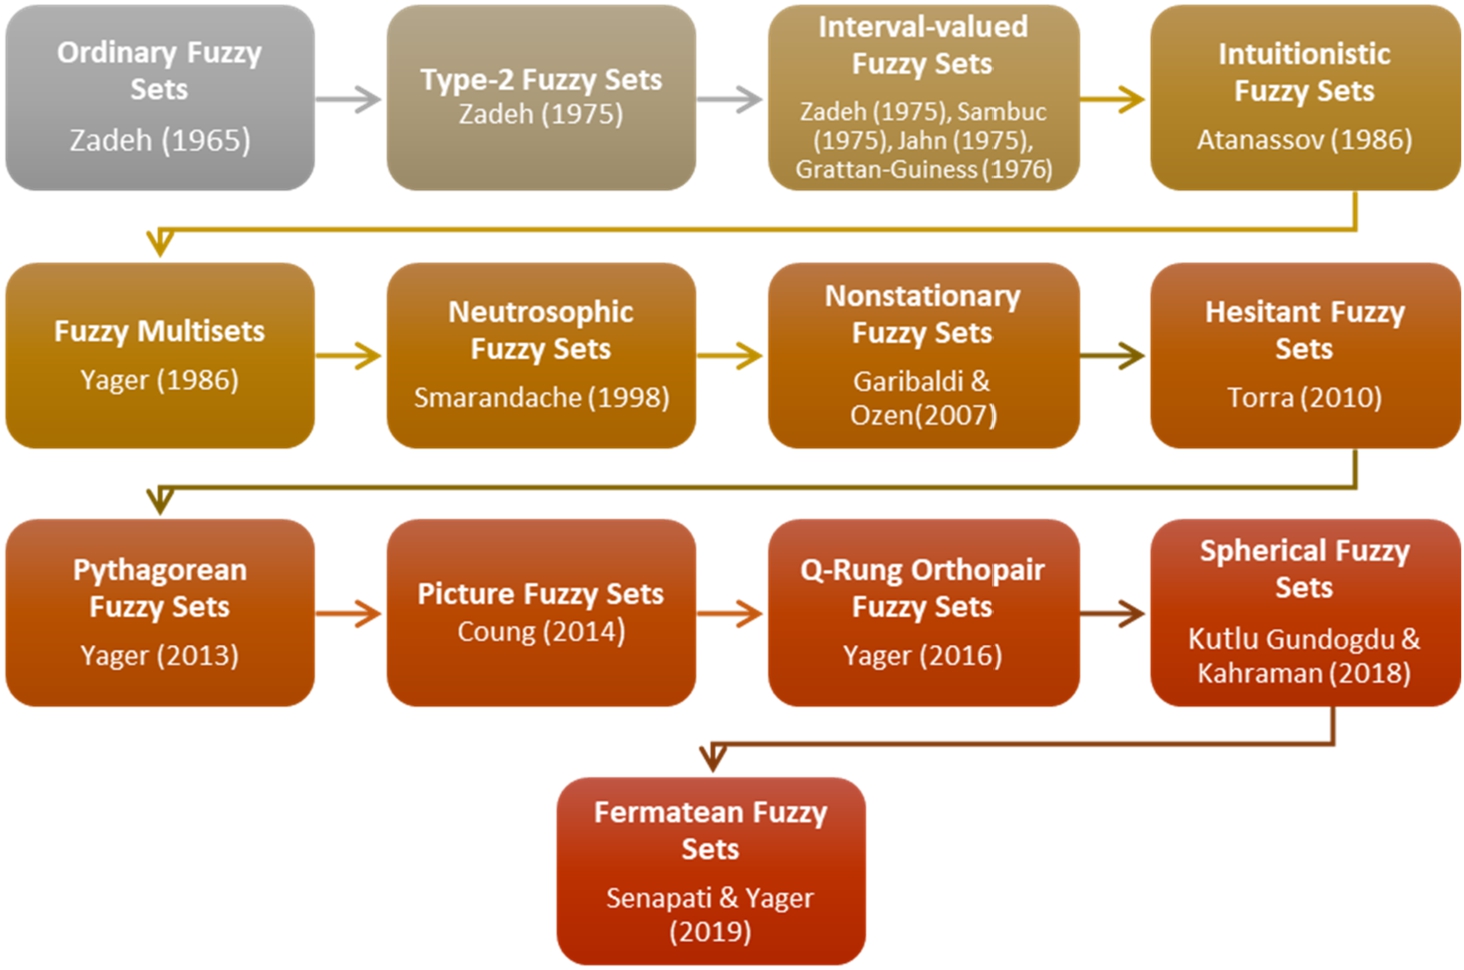
Technological advances with Industry 4.0 have enabled consumers to buy whatever they want, wherever they want, whenever they want. This has necessitated the supply chains to be digital, intelligent, and integrated. Thus, “digital supply chain” or “supply chain 4.0” introduced in the industrial world has been one of the fastest rising trends in both academy and industry. While the organizational structure in traditional supply chains is often defined by functional and geographic silos that do not share information, digital supply chains have broad information asset capability, as well as provide superior collaboration and communication between digital platforms resulting in enhanced agility, efficiency and reliability (Raab and Griffin-Cryan, 2011). Digital Supply Chain (DSC) has a customer-centric model, using real-time data from various sources. DSC optimizes performance and minimizes risk through demand matching, stimulation, sensing and management (The Center for Global Enterprise, 2015). But many global supply chains are unequipped to cope with the world we are entering. Therefore, supply chain managers need to alter their attention enabling new processes and cutting costs and should make institutes more connected and agile to create value across the institution (Farahani et al., 2020). With technological advances, emerging new digital technologies have deeply altered the way people communicate and interact with their enclosing. Technological novelties and personal gadgets, such as 3D printing, internet of things, big data, cloud, augmented reality, personal computers, smartphones, self-driving cars, mobile devices, advanced television units, drones, smartwatches, and wearable devices change the way societies access and exchange information (Büyüközkan and Göçer, 2018a). These technologies will provide the digitalization of products and services and new business models (PwC Sweden, 2018). Although many organizations have initiated a digital transformation in supply chains, they have not tackled a holistic approach to their DSC and it have been caused this situation to be in initial development stages until now. Hence, the biggest obstacle to successful digital transformation in the supply chain is the lack of digital strategies in organizations (PwC Sweden, 2018). Digital strategy implementation focuses on the entire supply chain, addressing the questions of “how, where, when and by whom” goals and objectives will be achieved (Büyüközkan and Göçer, 2018a). Organizations need to evaluate their strategies according to certain criteria in order to obtain a successful digital transformation in the supply chain and to create a roadmap. But, there is a lack of a strategic road map to guide organizations in the literature. Therefore, there has been a need for a comprehensive strategic roadmap carefully identifying and planning the digital transformation of organizations. Besides, it is known that in the literature there is no evaluation of digital transformation strategies in the supply chain with a MCDM approach. For this emerging need, organizations should be evaluated by considering together more than one criteria and so, they must use a MCDM method. MCDM includes several main and sub criteria, which can be tangible or intangible and used to rank the alternatives during a decision process. There are numerous MCDM methods in the literature such as Analytic Network Process (ANP), Analytic Hierarchy Process (AHP), Best-Worst Method (BWM), Measurement of Alternatives and Ranking according to COmpromise Solution (MARCOS), Vise Kriterijumska Optimizacija I Kompromisno Resenje (VIKOR), Technique for Order Preference by Similarity to Ideal Solution (TOPSIS), Multi-Attributive Border Approximation area Comparison (MABAC) and others. AHP is one of widely used and most popular MCDM methods. AHP is based on pairwise comparisons and experts’ judgments (Saaty, 2008). AHP divides a huge and complex problem into smaller and easier problems which can be solved easily and then combine these sub-solutions to obtain the final solution of the main problem (Otay et al., 2017). Traditional AHP uses a linguistic scale of 1 to 9 with numerical values. However, according to Buckley (1985), a precise numerical representation of a linguistic term may not reflect the judgments in the minds of decision makers (DMs). For example, a linguistic assessment such as “Very Strong Significance” is expressed with a 7 on the traditional AHP scale. However, the DM’s “Very Strong Significance” decision cannot be certain enough to assign a “7”. With “Very Strong Significance”, DM can assign a corresponding fuzzy number such as (6.5, 7, 7.5). This may provide a better representation of the DM’s assessment. Fuzzy sets are excellent tools for overcoming such uncertainty (Otay et al., 2017). Fuzzy sets introduced by Zadeh (1965) are represented by membership degrees. Since its development, fuzzy sets have extended in various ways due to the lack of information and inability to handle the imprecise information of complex systems. Various extensions of ordinary fuzzy sets have been introduced in the literature to define membership functions in different ways (see Fig. 1). After type-2 fuzzy sets were introduced by Zadeh (1975), Intuitionistic fuzzy sets (IFSs) expressed with degrees of membership and non-membership have been proposed by Atannasov (1986). Later, Atannasov (1999) have introduced intuitionistic type-2 fuzzy sets (IFS2). After hesitant fuzzy sets (HFSs) were introduced by Torra (2010), IFS2 were extended by Yager (2013) to Pythagorean fuzzy sets (PFSs), which are represented by a larger area for membership degrees. After that, Yager (2017) introduced q-rung orthopair fuzzy sets, which is a general class of IFSs and PFSs. In IFSs the sum of membership and non-membership degrees should be at most one, in PFSs the sum of their squares should be at most one, and also for q-rung orthopair fuzzy sets, the sum of their qth power have to equal at most to one. Yager stated that as q increases, the range of acceptable orthopair increases, thus giving the user more freedom to express his belief about the degree of membership. When
Fig. 1
Extension of fuzzy sets.
A more flexible definition of membership functions is needed to deal with uncertainty more effectively in fuzzy MCDM problems. FFSs are more suitable than other fuzzy set extensions to handle uncertainty by assigning the parameters of membership and non-membership grades to a larger domain.
In this study, we first develop a novel IVFF-AHP method, and then it has been implemented in selecting the best strategy for digital transformation strategies in the supply chain. It is known that in the literature there is no evaluation of digital transformation strategies in the supply chain with a MCDM method. Due to this lack of literature, the main motivation of study is the evaluation of digital transformation strategies in the supply chain and also the creation of a digital roadmap. The criteria used in the application have been determined by reviewing the articles and reports in the literature and taking into account the opinions of experts and systems in practice. The originality of this study comes from the development of a novel IVFF-AHP method and the first time evaluation as a MCDM problem of digital transformation strategies in the supply chain.
The rest of the paper is organized as follows: general information on digital transformation strategies is presented in Section 2. The preliminaries of intuitionistic, Pythagorean, and fermatean fuzzy sets are summarized and interval-valued fermatean fuzzy sets are presented in Section 3. Our proposed MCDM technique, the IVFF-AHP method, is given in Section 4. IVFF-AHP method is applied to the best supply chain digital transformation strategy selection problem in Section 5. Finally, the study is concluded in Section 6.
2Digital Transformation Era and Strategies
Digital transformation is defined as the process of organizational change that digital technologies (such as big data analysis, cloud computing, internet of things, 3D printing) are accustomed to change, generating value in products of a business, interacting with its customers, partners, and suppliers, and competing in the global market. Digital transformation is a change and therefore every attempt of organizational change should be managed carefully (Agrawal and Narain, 2018). Digitizing the supply chain enables companies to meet customers’ new requirements, supply-side challenges, and remaining expectations in efficiency improvement. Digitization brings a Supply Chain 4.0 that will be faster, more flexible, more detailed, more accurate, more efficient (Alicke et al., 2016). Digital supply chains are capable of broad information availability and provide superior collaboration and communication between digital platforms, providing enhanced reliability, efficiency and agility (Raab and Griffin-Cryan, 2011). A successful digital transformation largely depends on the digital transformation of each partner in the value chain of organizations and all processes and information flows between these different partners. It also requires adopting a holistic view of the entire partner ecosystem.
The first-of-its-kind study, jointly conducted by CapGemini Consulting and GT Nexus, to specifically examine digital transformation across the entire value chain of supply chain networks surveyed 337 executives from large manufacturing and retail organizations in more than 20 different countries around the world. More than 75% of respondents said Digital Transformation is important or very important in their supply chain, and 70% of respondents said their organization has already initiated a formal Digital Supply Chain Transformation effort. In the survey, when executives were asked to comment on their level of satisfaction with the progress Digital Supply Chain Transformation efforts have made so far, one-third of executives said they were dissatisfied with their organization’s progress towards Digital Transformation. Only 5% stated that they were very satisfied. As the main barriers to this situation, 44% of managers reported a general lack of awareness in their organization and 39% reported a lack of necessary skills in the workforce (Dougados and Felgendreher, 2016). Many organizations invest seriously to developed DSC in their institutions. According to a PwC study of more than 2 000 respondents, a third of them have started digitizing their supply chains, and 72 percent expect to do so five years from now. At the same time, organizations having on a large-scale digital supply chains and operations are to expect efficiency increases of 4.1 percent annually, while boosting revenue by 2.9 percent a year (Schrauf and Berttram, 2016).
2.1Literature Review
Although there are many studies in the literature addressing digital transformation in the supply chain, there are no studies evaluating its strategies with a MCDM. Therefore, in this section, we reviewed the studies of digital transformation in supply chain to form the basis for our study. Xu (2014) gave important information about digital enterprise management required by decision-makers and managers in the organizations by focusing on digital enterprise and its managing. He also reviewed emerging trends and future directions, issues, and success factors of managing DSC. Uhl and Gollenia (2016) reviewed the combination of transformational capabilities and new digital skills to be developed. They also presented examples of a Digital Transformation Roadmap by introducing a set of different digital use cases related to supply chain management. Büyüközkan and Göçer (2018a) reviewed the state-of-the-art of the current DSC literature, detailing it from both academic and industrial perspectives. They also presented the main limitations and prospects in DSC, advantages, weaknesses, and limitations of individual methods. Büyüközkan and Göçer (2018b) proposed a new MCDM approach to evaluate the supplier selection process in the DSC environment. They presented a new framework that combines the interval-valued intuitionistic fuzzy (IVIF) AHP method to evaluate criterion weights and the Additive Ratio Assessment (ARAS) methodology to evaluate alternatives. Büyüközkan and Göçer (2019) used an approach that integrates PFSs into alternative DSC partner selection. Bienhaus and Haddud (2018) aimed to identify the effect of digitization on procurement and its role in the area of supply chain management. In the study, they also introduced potential obstacles to digitizing procurement and supply chains and ways to overcome them. Farahani et al. (2016a) presented an overview of the DSC management practices of leading companies in various industries, the DSC management concepts, and opportunities that arise from the application of digital technologies to supply chain management (SCM). Agrawal and Narain (2018) referred to its benefits by offering a framework of the digital supply chain. Scuotto et al. (2017) explained the relationship between multiple buyers and suppliers in the context of SMEs’ DSC management. Farahani et al. (2016b) provided the creation of the DSC management agenda by presenting 17 DSC management use cases identified by expert interviews. Korpela et al. (2016) aimed to establish a DSC integration based on global standards. Bhargava et al. (2013) proposed a new based approach for protecting shared data in DSCs. Pundir et al. (2019) reviewed the suitability of complementary technologies such as IoT and Blockchain technology for DSC. Luthra and Mangla (2018) evaluated challenges to Industry 4.0 initiatives for supply chain sustainability in developing economies using an extensive literature review. Büyüközkan and Göçer (2017) presented an approach evaluating with intuitionistic fuzzy sets the supplier selection process in the DSC environment. Using the MOORA (Multi-Objective Optimization with Ratio Analysis) method, they realized a real case study to show the validity of the proposed approach. Alkan (2021) used the interval-valued Pythagorean fuzzy AHP method to assess the risks of digital transformation based on a sustainable supply chain. Tjahjono et al. (2017) purposed to provide a thought towards Supply Chain 4.0 by presenting a preliminary analysis of the impact of Industry 4.0 on SCM. Ivanov et al. (2019) reviewed how digital technologies and Industry 4.0 affect the ripple effect and performance of the supply chains. They presented the first study that connects information, business, analytics, engineering, and perspectives on digitalization and supply chain risks.
2.2The Technological Enablers of DSC
Digital Supply Chain transformation is based on the full implementation of various new digital technologies. With the developing technologies, consumers, employees and business partners have more expectations, leading companies to develop more reliable and sensitive supply chains. Therefore, organizations need to adopt new technologies such as cloud, big data analytics, augmented reality, internet of things and 3D printing to keep up with digital transformation. These technologies enable the digitization of products and services, new business models and the digitization and integration of every link in an organization’s value chain (i.e. engineering and manufacturing, product development and innovation, digital workplace, distribution and digital sales channels and customer relationship management) will also offer enormous benefits through making production more responsive to consumer demand, reducing costs, saving consumers’ time and boosting employment (PwC Sweden, 2018; WTO, 2019). The faster these technologies develop in performance and cost, the faster they will make a change in SCM and will have a considerable impact on current and future SCM tasks (Kearney, 2015). The aim of the DSC is to completely integrate and make visible every aspect of the movement of goods and services. The most important technology that will fulfill this purpose of DSC is big data (PwC Sweden, 2018). Big data is considered as high velocity, high volume, and high variety information assets that demand cost-effective, innovative forms of information processing for decision making (Farahani et al., 2020). Big data in DSC is to realize the necessary transparency by uncovering process interruptions and ensuring that changes are implemented quickly. Big data analytics provide better demand forecasting and planning, inventory planning and management, network, and routing optimization advanced procurement with collaborative optimization (Kearney, 2015; Alkan and Kahraman, 2021). Cloud computing is described as a style of computing in which scalable and flexible IT-enabled capabilities are presented as a service through internet technologies (Farahani et al., 2020). Cloud computing creates diverse business networks to enable companies to fully and rapidly engage with supply chain stakeholders (Kearney, 2015). The Internet of Things (IoT) is a network of physical objects that includes embedded technology to communicate, perceive, or interact with their internal and external environments (Farahani et al., 2020). IoT provides to open up to new business models and operational possibilities in the supply chains and respond to changing customer needs in real-time effectively. Tracking and tracing throughout the supply chain are provided through technologies underlying IoT such as Bluetooth, GSM (global system for mobile communication), and radio frequency identification (RFID) to rapidly evaluate and respond to changes in customer demand (WTO, 2019). Warehouse automation through advanced robotic technologies becomes much more holistic as some warehouses are fully connected to production loading points, so that all processes are carried out without manual intervention (Alicke et al., 2016). A three-dimensional scanner (3D) is a device creating object models of them by capturing data about the appearance and shape of real-world objects (Farahani et al., 2020). With 3D printing in the supply chain, the spare parts supply chain can be decreased to much fewer suppliers, even making own production possible. Thereby, 3D having an important impact on physical flows in the supply chain leads to faster delivery to the customer, lower labour unit and transport cost, and notably reduced inventory levels and costs in the supply chain (PwC Sweden, 2018). Augmented reality is defined as the situation that creates a new perception environment by combining computer-generated elements with the real world, in which users can interact (WTO, 2019). Augmented reality in the supply chain contributes to finding the right quantity of the right material much more efficiently by enabling better warehouse management (Kearney, 2015). Except for these technologies, GPS technology allows companies to take full control of shipping locations, while sensors control environmental conditions such as temperature and humidity and determine maintenance requirements (PwC Sweden, 2018). Autonomous and smart vehicles provide significant operational cost reductions in transportation and product handling, and also offer several benefits related to lower environmental costs and lead times (Alicke et al., 2016).
2.3Key Challenges and Opportunities of Digital Supply Chain
Supply chain managers who want to implement digital transformation in their SCMs ensure that they not only identify the challenges and opportunities their organizations face, but also consider the way suppliers, customers and other market partners interact with their organizations by enabling the digital transformation of the entire organization, its services and products (Kearney, 2015). In SCM, organizations should apply various steps that are necessary to deliver a product or service to customers. According to the supply chain council, these steps can be operated with the help of the SCOR model which includes the Plan, Source, Make, Deliver, Return processes (Büyüközkan and Göçer, 2018a). This model includes all processes that meet lower costs and faster customer demand, helping to support communication between supply chain partners and increase the efficiency of supply chain management (Uhl and Gollenia, 2016). Each of these elements is quickly being digitalized through technological innovation and thereby the chain becomes an integrated system working flawlessly. As a result, a digital supply chain strategy must consider the issues and success factors of digital transformation in the supply chain and examine it as a holistic approach to reap the full benefits of digitalization.
Table 1
The issues and success factors of digital transformation in supply chain.
| Sharing information | DSC provides sharing information about demand, manufacturing, inventories, and logistics capacity, and thus it enables much closer integration with customers by boosting the agility of the entire chain (Raab and Griffin-Cryan, 2011; Alicke et al., 2016; Schrauf and Berttram, 2016; Xu, 2014; Ivanov et al., 2019; WTO, 2019). |
| Cross-functional relationship | Inter-functional cooperation between various elements in the organization provides to ensure the elimination of various bottlenecks, delays, or interruptions in the processes and to create a smooth flow within the organization (Raab and Griffin-Cryan, 2011; The Center for Global Enterprise, 2015; Farahani et al., 2020; Alicke et al., 2016; Schrauf and Berttram, 2016; Xu, 2014). |
| Adoption of advanced analytical tools | Adoption of advanced analytical tools provide to gain a better understanding and forecasting of the demand and accelerate the decision-making process (The Center for Global Enterprise, 2015; Farahani et al., 2020; Schrauf and Berttram, 2016; Xu, 2014; Kearney, 2015; Gezgin et al., 2017). |
| Supply chain visibility | Real-time visibility in the supply chain improves better DSC management by creating a coordinated end-to-end supply chain (Raab and Griffin-Cryan, 2011; Farahani et al., 2020; Agrawal and Narain, 2018; Schrauf and Berttram, 2016). |
| Financial approach | Financial measurements enable quick execution of digital transformation efforts with less cost (The Center for Global Enterprise, 2015; Schrauf and Berttram, 2016; Kearney, 2015; Gezgin et al., 2017). |
| Customer orientation | Customer orientation aims to offer personalized products by meeting customer expectations through end-to-end connectivity between suppliers and customers through cloud-based platforms (Alicke et al., 2016; Schrauf and Berttram, 2016; Xu, 2014; Kearney, 2015; Gezgin et al., 2017). |
| Training and skills development | DSC requires providing employees with the necessary digital supply chain management skills to ensure an end-to-end understanding of value chain mechanics in digital transformation (Schrauf and Berttram, 2016; Xu, 2014; Luthra and Mangla, 2018; Gezgin et al., 2017). |
| Digital culture | Digital culture is necessary for the adoption of a cultural change in the thinking of each member in the organization to realize end-to-end digital transformation (Schrauf and Berttram, 2016; Luthra and Mangla, 2018). |
| Innovation | Digital supply chain helps a company strengthen business models through innovations in its designs and collaborates more effectively with both suppliers and customers (Farahani et al., 2020; Alicke et al., 2016; Schrauf and Berttram, 2016). |
| Standardization | Identify the roles, duties and responsibilities of all parties in the digital supply chain and ensure that the terms of all agreements are clearly defined and agreed upon, as well as adopt a single set of global standards that support data exchange, processes and capabilities (Farahani et al., 2020; Xu, 2014; Luthra and Mangla, 2018; Kearney, 2015). |
| Automation | Automated operations facilitate the work of supply chain professionals and increase operational efficiency by allowing them to focus on more valuable tasks (Farahani et al., 2020; Alicke et al., 2016; Schrauf and Berttram, 2016; Xu, 2014; Kearney, 2015; Gezgin et al., 2017). |
| Integration | Integration enables simultaneous management of information and processes with all stakeholders in digital supply chain (The Center for Global Enterprise, 2015; Farahani et al., 2020; Alicke et al., 2016; Schrauf and Berttram, 2016; Xu, 2014; Kearney, 2015; Gezgin et al., 2017). |
| Flexibility | Digitalization in the supply chain allows easy adaptation to change circumstances and quickly assess changes in end-customer demand (Raab and Griffin-Cryan, 2011; Farahani et al., 2020; Alicke et al., 2016; Schrauf and Berttram, 2016; Kearney, 2015). |
| Enhanced response management | DSC increases the speed of responding to highly variable markets and changing customer needs (Farahani et al., 2020; Alicke et al., 2016; Schrauf and Berttram, 2016; Xu, 2014). |
| Security and privacy | Security and privacy stand for the tools used to transform a factory into a smarter factor and a supply chain into smarter value chains by avoiding security vulnerabilities increasing with digitalization in the supply chain (The Center for Global Enterprise, 2015; Luthra and Mangla, 2018; Kearney, 2015). |
Organizations seeking to establish a DSC will face competitive extinction unless they develop clear strategies that respond to the opportunities presented in an all-digital environment. An organization that wants to generate and measure long-term value should integrate its digital initiatives into its overall supply chain strategy. Therefore, a digital supply chain strategy should be an integral part of a company’s overall business model and organizational structure (Raab and Griffin-Cryan, 2011). Once the strategies are determined, companies must implement the DSC opportunities needed to carry out the transformation in their organizations. To ensure the effectiveness and efficiency of supply chains, the digital supply chain must be more agile and stronger by having the right people and skills, processes and tools in the right places. To achieve these goals, organizations need to work on such initiatives as focusing on better system and process standardization, create new business models, reconfigure demand forecasts for better interaction with the customer, enhancing sourcing capabilities in emerging markets and institutionalizing staff development better (Xu, 2014).
Developing strategies based on demand, people, technology, and new business models provide that all sections of the organizations fulfill the required changes to become more demand-driven, customer-focused, technology-savvy, and risk compliant. Organizations must develop demand-based strategies for digital transformation in supply chains. Through demand-based strategies, organizations can obtain real-time data by continuously communicating with customers. Human resources and skills-based strategies enable the development of people with various skills to achieve DSC results. Organizations should find people capable of collecting and analysing data to make better decisions and thus provide more customer-oriented growth solutions. IT and technology-based strategies help efficiently deploy knowledge and integrate information and communication technologies. New business models-based strategies enable changes in current business models of organizations for better customer interaction (Bailey et al., 2017).
3Preliminaries: Intuitionistic, Pythagorean, and Fermatean Fuzzy Sets
In this section, the basic concepts and the mathematical operations of PFSs, IFSs, and FFSs have been briefly introduced.
3.1Intuitionistic Fuzzy Sets (IFSs)
Intuitionistic fuzzy sets proposed by Atannasov (1986) are an extension of the traditional fuzzy set theory. An IFS is defined by two membership values named as membership and non-membership that their sum is one or less than one.
Definition 3.1.
Let X be a non-empty set. An IFS I in X is given by:
(1)
(2)
(3)
Definition 3.2.
Let
(4)
(5)
3.2Pythagorean Fuzzy Sets (PFSs)
Pythagorean fuzzy sets (PFS) introduced as an extension of intuitionistic fuzzy set by Yager (2013) are defined two membership values named as membership and non-membership. In PFSs, the sum of membership and non-membership degrees assigned by decision-makers can exceed 1, but the sum of their squares must be at most 1. PFSs are defined in Definition 3.3.
Definition 3.3.
Let X be a non-empty set. A Pythagorean fuzzy set P in X is an object having the form (Zhang and Xu, 2014):
(6)
(7)
(8)
Definition 3.4.
Let
(9)
(10)
3.3Fermatean Fuzzy Sets (FFSs)
Fig. 2
Comparison of IFSs, PFSs and FFSs.
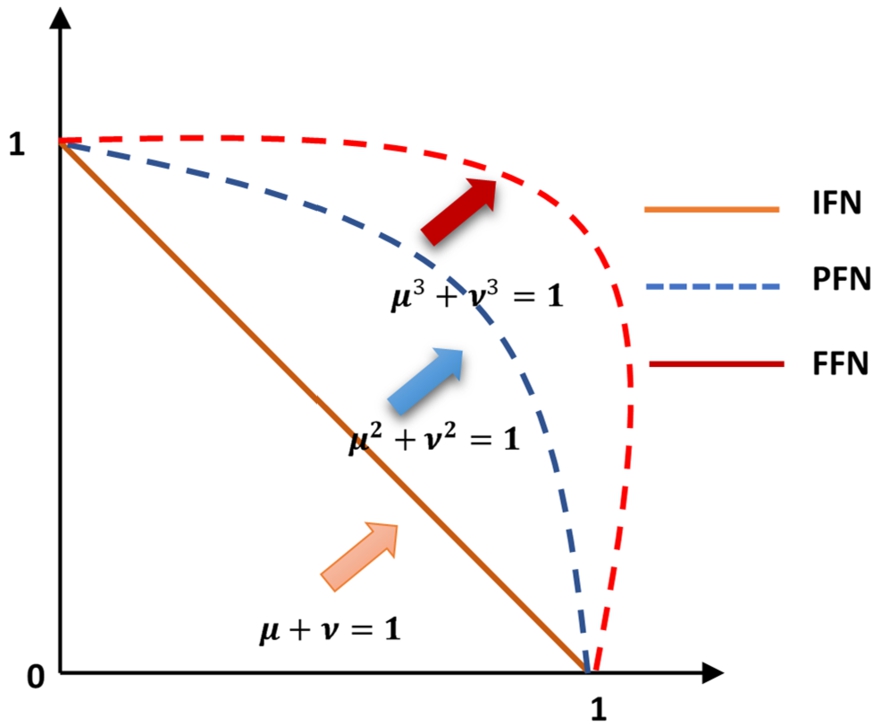
Yager (2017) introduced q-rung orthopair fuzzy sets, a general class of IFSs and PFSs. The sum of the qth power of membership and non-membersip degrees q-rung orthopair fuzzy sets is bounded with one. When
Definition 3.5.
Let X be a universe of discourse. A fermatean fuzzy set
(11)
(12)
For any FFS
(13)
Definition 3.6.
Let
(14)
(15)
Definition 3.7.
Let
(16)
(17)
(18)
(19)
Definition 3.8.
Let
(20)
Definition 3.9.
Let
(21)
3.4Interval-Valued Fermatean Fuzzy Sets (IVFFSs)
In this section, the mathematical operations of IVFFSs have been briefly presented (Jeevaraj, 2021).
Definition 3.10.
Let X be a fixed set. An IVFFSs
(22)
(23)
(24)
(25)
Definition 3.11.
Let
(26)
(27)
(28)
(29)
Definition 3.12.
Let
(30)
Definition 3.13.
Let
(31)
Definition 3.14.
Deffuzzification of
(32)
4A Novel Fermatean Fuzzy Analytic Hierarchy Process Method
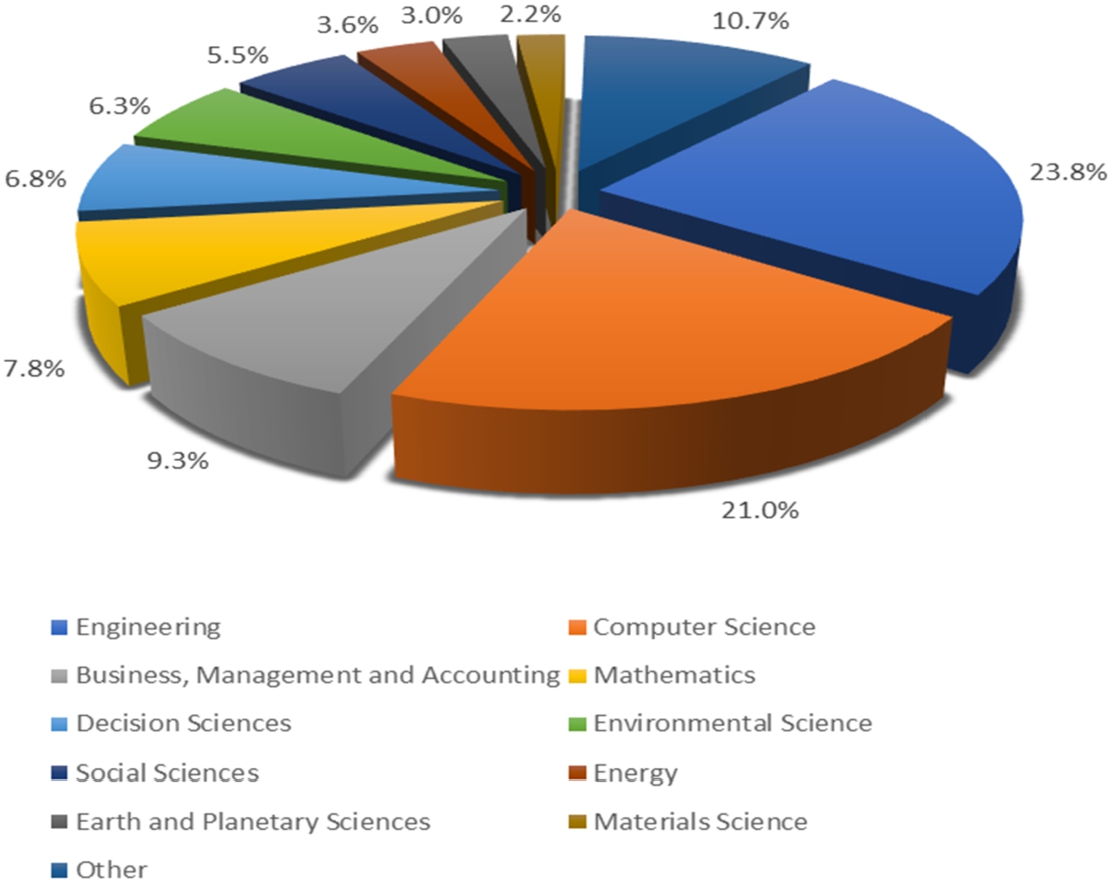
AHP, which is one of the most used MCDM methods in literature, has been introduced by Saaty in 1980 and the method has a structured form used to weight criteria and make decisions in complex MCDM problems. But, in the classic AHP method, decision-makers’ evaluations in uncertainty cases can not be expressed. Therefore, classic AHP has been extended to fuzzy AHP to model the uncertainty in human judgment and preference. Fuzzy AHP has been used to deal with many MCDM problems in studies in the literature and the method has emerged in different forms with new extensions of fuzzy sets. Van Laarhoven and Pedrycz (1983) used triangular fuzzy numbers as the first extension of fuzzy AHP to calculate fuzzy weights and fuzzy alternative scores. Buckley (1985) used the geometric mean method based on the trapezoidal fuzzy numbers to calculate the fuzzy weights and fuzzy alternative scores. Chang (1986) proposed a novel approach for the synthetic extent values of the pairwise comparison scale of fuzzy AHP by using the triangular fuzzy numbers. Kahraman et al. (2016) developed both interval-valued type-2 fuzzy AHP method and a new ranking method based on type-2 fuzzy sets by handling a supplier selection problem. Sadiq and Tesfamariam (2009) developed intuitionistic fuzzy AHP to handle vagueness and uncertainties in decision-making process. Wu et al. (2013) developed a score function based on interval-valued intuitionistic fuzzy numbers (IVIFNs) and proposed a new interval-valued intuitionistic fuzzy AHP (IVIF-AHP) method for MCDM problems. Öztaysi et al. (2015) developed the hesitant fuzzy AHP where the evaluations of experts are aggregated by ordered weighted averaging (OWA) operator. Gul (2018) proposed a new approach integrated Pythagorean fuzzy AHP and fuzzy VIKOR for risk assessment in the field of occupational health and safety. The Pythagorean fuzzy AHP has been used for weighting of the risk parameters. Then, fuzzy VIKOR has been applied to prioritize the hazards. Büyüközkan and Göçer (2019) proposed a new approach integrating AHP and complex proportional assessment (COPRAS) based on Pythagorean fuzzy sets to evaluate the digital supply chain partner selection. Karasan et al. (2019) developed a new Pythagorean fuzzy AHP method and compared it with ordinary fuzzy AHP, revealing that the developed method produces consistent results that better represent the uncertainty of the decision-making environment. Abdel-Basset et al. (2017) proposed a neutrosophic AHP method by using the triangular neutrosophic numbers for each pairwise comparison judgment. Bolturk and Kahraman (2018) proposed a new interval-valued neutrosophic AHP method and interval-valued neutrosophic AHP (IVN-AHP) based on cosine similarity measures. The proposed methods provide a scoring procedure for pairwise comparison matrices based on neutrosophic numbers. Garg et al. (2021) developed complex interval-valued q-rung orthopair fuzzy sets (CIVq-ROFSs) and then developed averaging aggregation operator and geometric aggregation operators based on CIVq-ROFSs. They proposed AHP and TOPSIS methods based on CIVq-ROFSs. Kutlu Gündoğdu et al. (2021) introduced a new hybrid picture fuzzy analytic hierarchy process and linear assignment model. The hybrid picture fuzzy AHP-linear assignment model validated with a comparative analysis. Mathew et al. (2020) presented a novel approach integrating AHP and TOPSIS based on spherical fuzzy sets. They proposed a novel spherical fuzzy geometric mean formula for calculating the spherical fuzzy criteria weights and also presented a novel eleven-point spherical fuzzy linguistic term scale. Kahraman et al. (2020) presented a literature review of studies on the integration of fuzzy AHP with other fuzzy multi-criteria methods. Duan et al. (2021) presented some fundamental operations based on q-rung orthopair double hierarchy linguistic term sets (q-RODHLTS) and developed AHP method under q-RODHLTS. The distribution of fuzzy AHP publications from past to present analysed by using the Scopus database is illustrated in Fig. 3. As it is seen, engineering is the most researched scientific field in the literature, followed by computer science, mathematics and business, management and accounting research fields.
Fig. 3
Percentages of fuzzy AHP studies based on application areas.
4.1Proposed Method: IVFF-AHP
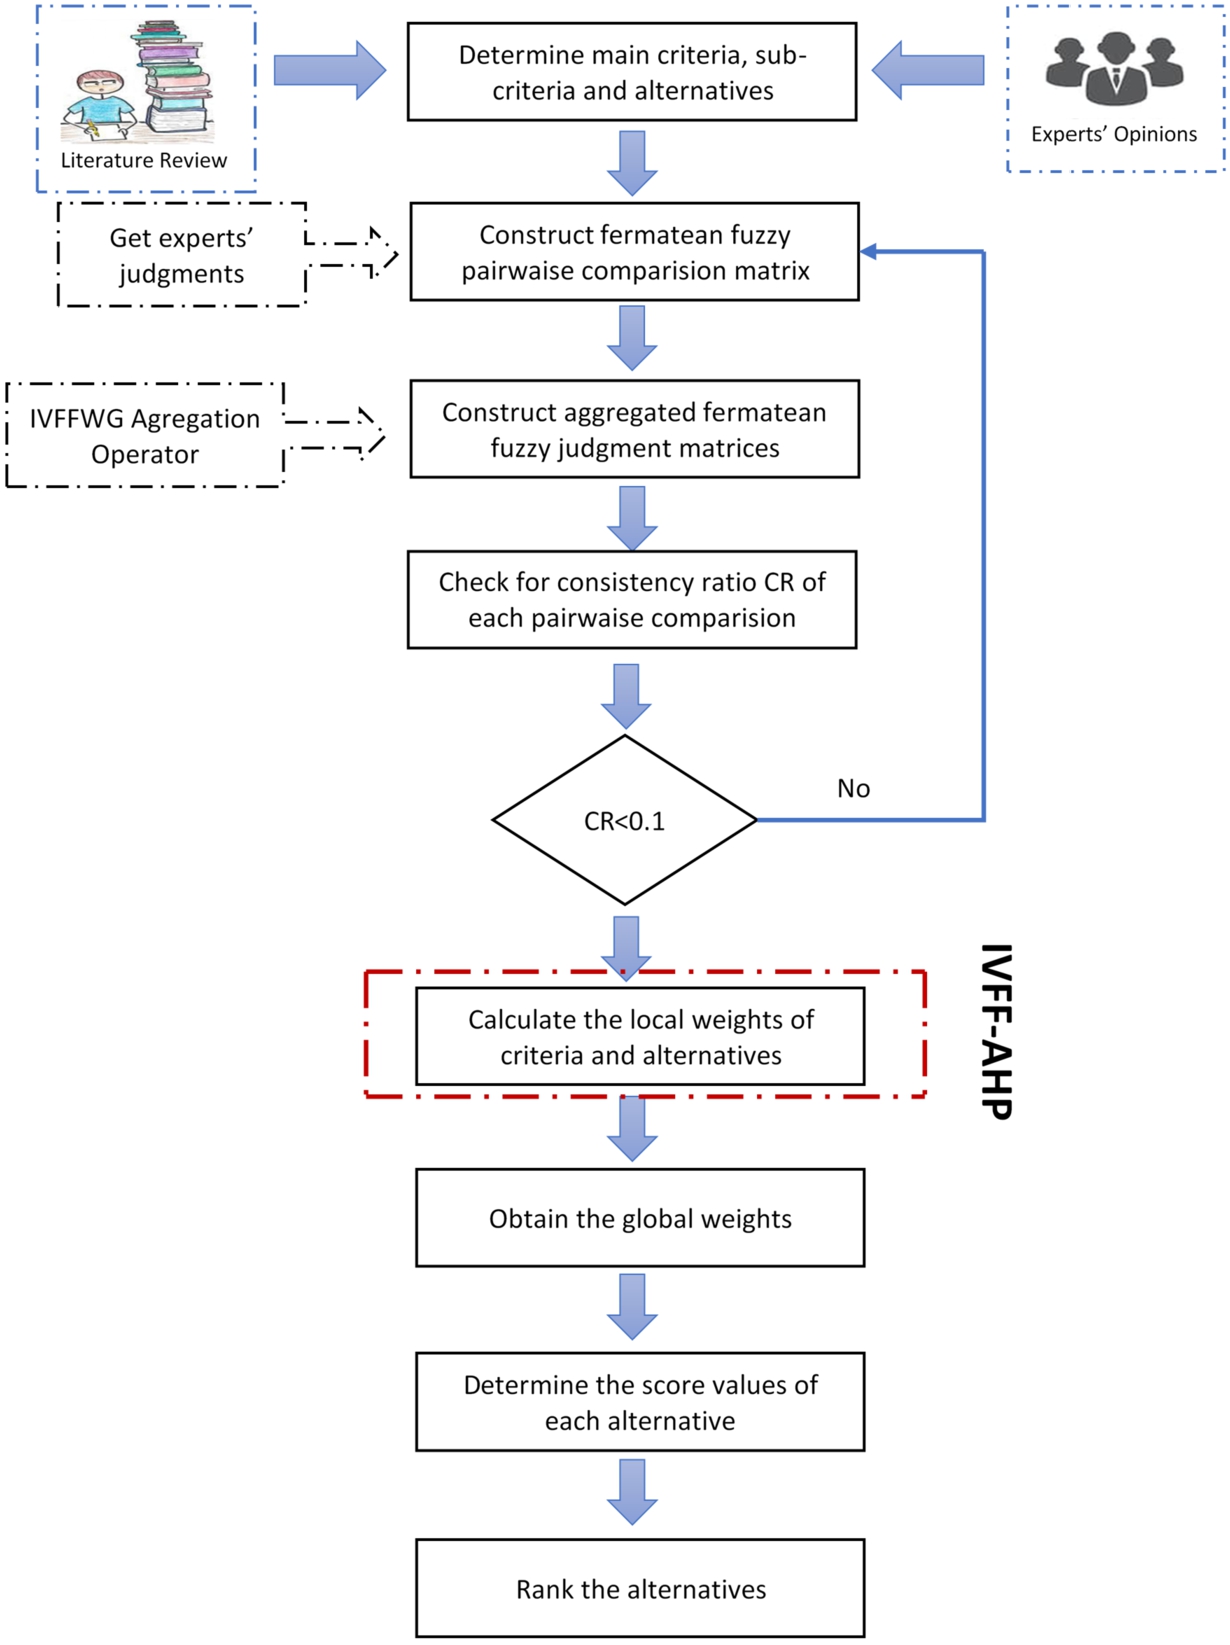
Fermatean fuzzy sets, which are the extension of ordinary fuzzy sets, have been introduced by Senapati and Yager (2020). No study integrating FFSs with the AHP method has been performed in the literature. The steps of the proposed IVFF-AHP method whose flow chart is illustrated in Fig. 4 are given as follows:
Step 1: Construct the hierarchical structure by determining the criteria and alternatives.
Fig. 4
Flowchart of the proposed method.
Determine objective, decision criteria, and alternatives for the given problem. The set
Step 2: Construct the pairwise comparison matrix
(33)
Step 3: Check for the consistency of each pairwise comparison matrix
Table 2
Linguistic terms and IVFFN equivalents.
| Linguistic terms | IVFFN equivalents | |||
| Certainly High Importance (CHI) | 0.95 | 1 | 0 | 0 |
| Very High Importance (VHI) | 0.8 | 0.9 | 0.1 | 0.2 |
| High Importance (HI) | 0.7 | 0.8 | 0.2 | 0.3 |
| Slightly More Importance (SMI) | 0.6 | 0.65 | 0.35 | 0.4 |
| Equally Importence (EI) | 0.5 | 0.5 | 0.5 | 0.5 |
| Slightly Less Importance (SLI) | 0.35 | 0.4 | 0.6 | 0.65 |
| Low Importance (LI) | 0.2 | 0.3 | 0.7 | 0.8 |
| Very Low Importance (VLI) | 0.1 | 0.2 | 0.8 | 0.9 |
| Certainly Low Importance (CLI) | 0 | 0 | 0.95 | 1 |
Step 4: Aggregate the judgments of experts.
The pairwise comparison matrix constituted for each expert is aggregated by using
(34)
Step 5: Find the differences matrix
(35)
(36)
Step 6: Find the interval multiplicative matrix
(37)
(38)
Step 7: Obtain the indeterminacy value
(39)
Step 8: Multiply the indeterminacy degrees with
(40)
Step 9. Obtain the normalized priority weights
(41)
Step 10. Rank the alternatives based on the normalized priority weights obtained in Step 9.
5Application
5.1Problem Definition
With the rapid advances in technology, digitalization has become an increasingly important issue investigated and discussed by academics and industries around the world. Currently, it has the potential to affect all sectors including supply chain and logistics. Thus, “digital supply chain” or “supply chain 4.0” has been introduced in the industrial world. Although many organizations have initiated a digital transformation in supply chains, they have not tackled it as a holistic approach to their DSC. This situation has caused delays in the progress of DSC until now. Hence, the biggest obstacle to successful digital transformation in the supply chain has been the lack of digital strategies in organizations. There has been a need to develop a framework and create awareness for the successful implementation of digital supply chain strategies. Due to this requirement emerging, organizations are required to evaluate their strategies according to certain criteria and they should use an MCDM method.
5.2Problem Solution
In this section, the digital transformation strategies in the supply chain are evaluated by utilizing the proposed method and it is aimed to choose the best strategy among various alternatives. A decision-making group of three experts is formed to evaluate the strategies using the proposed method. In a fuzzy environment, three decision makers, abbreviated as E1, E2 and E3, are selected, consisting of academicians who are experts in multi-criteria decision making. The weights of the decision makers are considered equal because they have the same level of experience. As a result of expert opinions and evaluation of the studies in the literature, three main criteria, fifteen sub-criteria and four alternatives have been determined for the strategies required for digital transformation in the supply chain. The determined main criteria are DC- Digital Competence, O- Organizational, and M- Management. The sub-criteria are listed as DC1- Digital Culture, DC2- Security and Privacy, DC3- Automation, DC4- Standardization, DC5- Innovation, O1- Sharing Information, O2- Cross-Functional Relationship, O3- Integration, O4- Training and Skills Development, M1- Adoption of Advanced Analytical Tools, M2- Supply Chain Visibility, M3- Financial Orientation, M4- Customer Orientation, M5-Flexibility, and M6- Enhanced Response. Alternative strategies are A1- Human Resource Management and Talent-Based Strategies, A2- Demand-Based Strategies, A3- New Business Models-Based Strategies, and A4- Technology and IT-Based Strategies. Fig. 5 illustrates this hierarchical structure involving the main criteria, sub-criteria, and alternatives. These alternatives and criteria are evaluated by constructing pairwise comparison matrices through linguistic terms given in Table 2 by three experts. The pairwise comparison matrices consisting of linguistic terms for the main criteria, sub-criteria, and alternatives are presented with the consistency ratio in Tables 3–21. The consistency ratios of the pairwise comparison matrices are calculated using the linguistic scale and corresponding numerical values given in Table 2. Due to space constraints, the next steps of the developed method are shown on the main criteria. After linguistic expressions in the pairwise comparison, matrices are converted to IVFFNs using the relevant scale, each expert’s assessment is aggregated with the IVFFWG operator. Table 22 presents the aggregated IVFF values of the main criteria. Then, IVFF-AHP is used to obtain the weights of criteria and alternatives. Table 23 gives the difference matrix
Table 3
Pairwise comparison judgments for the main criteria.
| E1 | E2 | E3 | |||||||
| DC | DC | DC | |||||||
| DC | EI | SMI | SLI | EI | SMI | SLI | EI | HI | SLI |
| O | SLI | EI | LI | SLI | EI | VLI | LI | EI | VLI |
| M | SMI | HI | EI | SMI | VHI | EI | SMI | VHI | EI |
| CR | 0.033 | 0.006 | 0.056 | ||||||
Table 4
Evaluation of the sub-criteria according to the main criterion digital competence.
| E1 | E2 | E3 | |||||||||||||
| DC1 | DC2 | DC3 | DC4 | DC5 | DC1 | DC2 | DC3 | DC4 | DC5 | DC1 | DC2 | DC3 | DC4 | DC5 | |
| DC1 | EI | VHI | HI | VHI | SMI | EI | HI | SMI | VHI | SMI | EI | HI | SMI | VHI | EI |
| DC2 | VLI | EI | LI | SMI | LI | LI | EI | LI | EI | LI | LI | EI | SLI | SMI | VLI |
| DC3 | LI | HI | EI | HI | SLI | SLI | HI | EI | VHI | EI | SLI | SMI | EI | HI | SLI |
| DC4 | VLI | SLI | LI | EI | VLI | VLI | EI | VLI | EI | VLI | VLI | SLI | LI | EI | VLI |
| DC5 | SLI | HI | SMI | VHI | EI | SLI | HI | EI | VHI | EI | EI | VHI | SMI | VHI | EI |
| CR | 0.098 | 0.047 | 0.035 | ||||||||||||
Table 5
Evaluation of the sub-criteria according to the main criterion organizational.
| E1 | E2 | E3 | ||||||||||
| O1 | O2 | O3 | O4 | O1 | O2 | O3 | O4 | O1 | O2 | O3 | O4 | |
| O1 | EI | HI | EI | HI | EI | HI | SLI | VHI | EI | SMI | SLI | HI |
| O2 | LI | EI | LI | SLI | LI | EI | LI | SMI | SLI | EI | LI | SMI |
| O3 | EI | HI | EI | HI | SMI | HI | EI | VHI | SMI | HI | EI | VHI |
| O4 | LI | SMI | LI | EI | VLI | SLI | VLI | EI | LI | SLI | VLI | EI |
| CR | 0.059 | 0.086 | 0.044 | |||||||||
Table 6
Evaluation of the sub-criteria according to the main criterion management.
| E1 | E2 | E3 | ||||||||||||||||
| M1 | M2 | M3 | M4 | M5 | M6 | M1 | M2 | M3 | M4 | M5 | M6 | M1 | M2 | M3 | M4 | M5 | M6 | |
| M1 | EI | SMI | CHI | EI | VHI | HI | EI | SMI | CHI | EI | HI | SMI | EI | EI | VHI | SLI | HI | SMI |
| M2 | SLI | EI | VHI | SLI | HI | HI | SLI | EI | VHI | EI | HI | SMI | EI | EI | VHI | SLI | VHI | HI |
| M3 | CLI | VLI | EI | VLI | SLI | SLI | CLI | VLI | EI | VLI | SLI | LI | VLI | VLI | EI | CLI | SLI | SLI |
| M4 | EI | SMI | VHI | EI | VHI | HI | EI | EI | VHI | EI | VHI | HI | SMI | SMI | CHI | EI | HI | SMI |
| M5 | VLI | LI | SMI | VLI | EI | SLI | LI | LI | SMI | VLI | EI | SLI | LI | VLI | SMI | LI | EI | EI |
| M6 | LI | LI | SMI | LI | SMI | EI | SLI | SLI | HI | LI | SMI | EI | SLI | LI | SMI | SLI | EI | EI |
| CR | 0.055 | 0.046 | 0.05 | |||||||||||||||
Table 7
Evaluation of the alternatives according to the sub-criterion digital culture.
| DC1 | E1 | E2 | E3 | |||||||||
| A1 | A2 | A3 | A4 | A1 | A2 | A3 | A4 | A1 | A2 | A3 | A4 | |
| A1 | EI | VHI | HI | EI | EI | HI | HI | SMI | EI | VHI | HI | SLI |
| A2 | VLI | EI | LI | LI | LI | EI | SLI | LI | VLI | EI | SLI | VLI |
| A3 | LI | HI | EI | SLI | LI | SMI | EI | SLI | LI | SMI | EI | LI |
| A4 | EI | HI | SMI | EI | SLI | HI | SMI | EI | SMI | VHI | HI | EI |
| CR | 0.079 | 0.075 | 0.086 | |||||||||
Table 8
Evaluation of the alternatives according to the sub-criterion security and privacy.
| DC2 | E1 | E2 | E3 | |||||||||
| A1 | A2 | A3 | A4 | A1 | A2 | A3 | A4 | A1 | A2 | A3 | A4 | |
| A1 | EI | SLI | LI | CLI | EI | SLI | LI | CLI | EI | LI | SLI | CLI |
| A2 | SMI | EI | SLI | VLI | SMI | EI | LI | VLI | HI | EI | SMI | LI |
| A3 | HI | SMI | EI | LI | HI | HI | EI | SLI | SMI | SLI | EI | VLI |
| A4 | CHI | VHI | HI | EI | CHI | VHI | SMI | EI | CHI | HI | VHI | EI |
| CR | 0.064 | 0.067 | 0.064 | |||||||||
Table 9
Evaluation of the alternatives according to the sub-criterion automation.
| DC3 | E1 | E2 | E3 | |||||||||
| A1 | A2 | A3 | A4 | A1 | A2 | A3 | A4 | A1 | A2 | A3 | A4 | |
| A1 | EI | VLI | VLI | CLI | EI | LI | LI | CLI | EI | VLI | VLI | CLI |
| A2 | VHI | EI | EI | LI | HI | EI | SMI | SLI | VHI | EI | EI | LI |
| A3 | VHI | EI | EI | LI | HI | SLI | EI | SLI | VHI | EI | EI | SLI |
| A4 | CHI | HI | HI | EI | CHI | SMI | SMI | EI | CHI | HI | SMI | EI |
| CR | 0.09 | 0.071 | 0.068 | |||||||||
Table 10
Evaluation of the alternatives according to the sub-criterion standardization.
| DC4 | E1 | E2 | E3 | |||||||||
| A1 | A2 | A3 | A4 | A1 | A2 | A3 | A4 | A1 | A2 | A3 | A4 | |
| A1 | EI | SLI | LI | LI | EI | LI | LI | VLI | EI | SLI | LI | LI |
| A2 | SMI | EI | SLI | LI | HI | EI | SLI | LI | SMI | EI | LI | LI |
| A3 | HI | SMI | EI | SLI | HI | SMI | EI | SLI | HI | HI | EI | EI |
| A4 | HI | HI | SMI | EI | VHI | HI | SMI | EI | HI | HI | EI | EI |
| CR | 0.075 | 0.093 | 0.059 | |||||||||
Table 11
Evaluation of the alternatives according to the sub-criterion innovation.
| DC5 | E1 | E2 | E3 | |||||||||
| A1 | A2 | A3 | A4 | A1 | A2 | A3 | A4 | A1 | A2 | A3 | A4 | |
| A1 | EI | VLI | VLI | LI | EI | CLI | CLI | VLI | EI | LI | VLI | VLI |
| A2 | VHI | EI | EI | SMI | CHI | EI | EI | HI | HI | EI | SLI | SLI |
| A3 | VHI | EI | EI | SMI | CHI | EI | EI | HI | VHI | SMI | EI | EI |
| A4 | HI | SLI | SLI | EI | VHI | LI | LI | EI | VHI | SMI | EI | EI |
| CR | 0.028 | 0.093 | 0.028 | |||||||||
Table 12
Evaluation of the alternatives according to the sub-criterion sharing information.
| O1 | E1 | E2 | E3 | |||||||||
| A1 | A2 | A3 | A4 | A1 | A2 | A3 | A4 | A1 | A2 | A3 | A4 | |
| A1 | EI | LI | SLI | HI | EI | VLI | LI | SMI | EI | VLI | VLI | HI |
| A2 | HI | EI | SMI | CHI | VHI | EI | SMI | VHI | VHI | EI | EI | CHI |
| A3 | SMI | SLI | EI | VHI | HI | SLI | EI | HI | VHI | EI | EI | CHI |
| A4 | LI | CLI | VLI | EI | SLI | VLI | LI | EI | LI | CLI | CLI | EI |
| CR | 0.065 | 0.088 | 0.094 | |||||||||
Table 13
Evaluation of the alternatives according to the sub-criterion cross-functional relationship.
| O2 | E1 | E2 | E3 | |||||||||
| A1 | A2 | A3 | A4 | A1 | A2 | A3 | A4 | A1 | A2 | A3 | A4 | |
| A1 | EI | SLI | SLI | HI | EI | LI | SLI | HI | EI | SLI | LI | HI |
| A2 | SMI | EI | EI | CHI | HI | EI | SMI | CHI | SMI | EI | SLI | VHI |
| A3 | SMI | EI | EI | CHI | SMI | SLI | EI | VHI | HI | SMI | EI | VHI |
| A4 | LI | CLI | CLI | EI | LI | CLI | VLI | EI | LI | VLI | VLI | EI |
| CR | 0.012 | 0.065 | 0.091 | |||||||||
Table 14
Evaluation of the alternatives according to the sub-criterion integration.
| O3 | E1 | E2 | E3 | |||||||||
| A1 | A2 | A3 | A4 | A1 | A2 | A3 | A4 | A1 | A2 | A3 | A4 | |
| A1 | EI | SLI | EI | HI | EI | SLI | SMI | HI | EI | SLI | SMI | VHI |
| A2 | SMI | EI | SMI | VHI | SMI | EI | SMI | VHI | SMI | EI | HI | VHI |
| A3 | EI | SLI | EI | VHI | SLI | SLI | EI | HI | SLI | LI | EI | HI |
| A4 | LI | VLI | VLI | EI | LI | VLI | LI | EI | VLI | VLI | LI | EI |
| CR | 0.045 | 0.086 | 0.091 | |||||||||
Table 15
Evaluation of the alternatives according to the sub-criterion training and skills development.
| O4 | E1 | E2 | E3 | |||||||||
| A1 | A2 | A3 | A4 | A1 | A2 | A3 | A4 | A1 | A2 | A3 | A4 | |
| A1 | EI | CHI | HI | HI | EI | VHI | HI | HI | EI | VHI | HI | HI |
| A2 | CLI | EI | SLI | SLI | VLI | EI | LI | SLI | VLI | EI | SLI | EI |
| A3 | LI | SMI | EI | SMI | LI | HI | EI | SMI | LI | SMI | EI | SMI |
| A4 | LI | SMI | SLI | EI | LI | SMI | SLI | EI | LI | EI | SLI | EI |
| CR | 0.071 | 0.071 | 0.045 | |||||||||
Table 16
Evaluation of the alternatives according to the sub-criterion adoption of advanced analytical tools.
| M1 | E1 | E2 | E3 | |||||||||
| A1 | A2 | A3 | A4 | A1 | A2 | A3 | A4 | A1 | A2 | A3 | A4 | |
| A1 | EI | CLI | LI | LI | EI | CLI | LI | LI | EI | CLI | LI | VLI |
| A2 | CHI | EI | HI | SMI | CHI | EI | SMI | SMI | CHI | EI | HI | SMI |
| A3 | HI | LI | EI | SLI | HI | SLI | EI | EI | HI | LI | EI | SLI |
| A4 | HI | SLI | SMI | EI | HI | SLI | EI | EI | VHI | SLI | SMI | EI |
| CR | 0.07 | 0.012 | 0.065 | |||||||||
Table 17
Evaluation of the alternatives according to the sub-criterion supply chain visibility.
| M2 | E1 | E2 | E3 | |||||||||
| A1 | A2 | A3 | A4 | A1 | A2 | A3 | A4 | A1 | A2 | A3 | A4 | |
| A1 | EI | VLI | LI | SLI | EI | CLI | LI | LI | EI | CLI | LI | VLI |
| A2 | VHI | EI | HI | HI | CHI | EI | HI | SMI | CHI | EI | HI | SMI |
| A3 | HI | LI | EI | SMI | HI | LI | EI | SLI | HI | LI | EI | EI |
| A4 | SMI | LI | SLI | EI | HI | SLI | SMI | EI | VHI | SLI | EI | EI |
| CR | 0.091 | 0.07 | 0.051 | |||||||||
Table 18
Evaluation of the alternatives according to the sub-criterion financial approach.
| M3 | E1 | E2 | E3 | |||||||||
| A1 | A2 | A3 | A4 | A1 | A2 | A3 | A4 | A1 | A2 | A3 | A4 | |
| A1 | EI | LI | VLI | CLI | EI | VLI | VLI | CLI | EI | LI | VLI | CLI |
| A2 | HI | EI | EI | VLI | VHI | EI | EI | LI | HI | EI | SLI | VLI |
| A3 | VHI | EI | EI | LI | VHI | EI | EI | LI | VHI | SMI | EI | SLI |
| A4 | CHI | VHI | HI | EI | CHI | HI | HI | EI | CHI | VHI | SMI | EI |
| CR | 0.096 | 0.09 | 0.079 | |||||||||
Table 19
Evaluation of the alternatives according to the sub-criterion customer orientation.
| M4 | E1 | E2 | E3 | |||||||||
| A1 | A2 | A3 | A4 | A1 | A2 | A3 | A4 | A1 | A2 | A3 | A4 | |
| A1 | EI | VLI | LI | SLI | EI | VLI | VLI | SLI | EI | LI | SLI | SLI |
| A2 | VHI | EI | EI | HI | VHI | EI | SMI | SMI | HI | EI | SMI | SMI |
| A3 | HI | EI | EI | HI | VHI | SLI | EI | SMI | SMI | SLI | EI | EI |
| A4 | SMI | LI | LI | EI | SMI | SLI | SLI | EI | SMI | SLI | EI | EI |
| CR | 0.046 | 0.06 | 0.016 | |||||||||
Table 20
Evaluation of the alternatives according to the sub-criterion flexibility.
| M5 | E1 | E2 | E3 | |||||||||
| A1 | A2 | A3 | A4 | A1 | A2 | A3 | A4 | A1 | A2 | A3 | A4 | |
| A1 | EI | VLI | LI | SMI | EI | CLI | VLI | SLI | EI | VLI | VLI | SLI |
| A2 | VHI | EI | SMI | VHI | CHI | EI | EI | HI | VHI | EI | SMI | HI |
| A3 | HI | SLI | EI | HI | VHI | EI | EI | SMI | VHI | SLI | EI | HI |
| A4 | SLI | VLI | LI | EI | SMI | LI | SLI | EI | SMI | LI | LI | EI |
| CR | 0.088 | 0.015 | 0.086 | |||||||||
Table 21
Evaluation of the alternatives according to the sub-criterion enhanced response management.
| M6 | E1 | E2 | E3 | |||||||||
| A1 | A2 | A3 | A4 | A1 | A2 | A3 | A4 | A1 | A2 | A3 | A4 | |
| A1 | EI | CLI | VLI | LI | EI | CLI | VLI | VLI | EI | VLI | LI | LI |
| A2 | CHI | EI | SMI | HI | CHI | EI | SMI | SMI | VHI | EI | SMI | HI |
| A3 | VHI | SLI | EI | SMI | VHI | SLI | EI | SMI | HI | SLI | EI | SMI |
| A4 | HI | LI | SLI | EI | VHI | SLI | SLI | EI | HI | LI | SLI | EI |
| CR | 0.065 | 0.093 | 0.093 | |||||||||
Table 22
Aggregated interval-valued fermatean fuzzy sets for main criteria.
| Goal | DC | O | M |
| DC | |||
| O | |||
| M |
Fig. 5
Hierarchical structure of the problem.
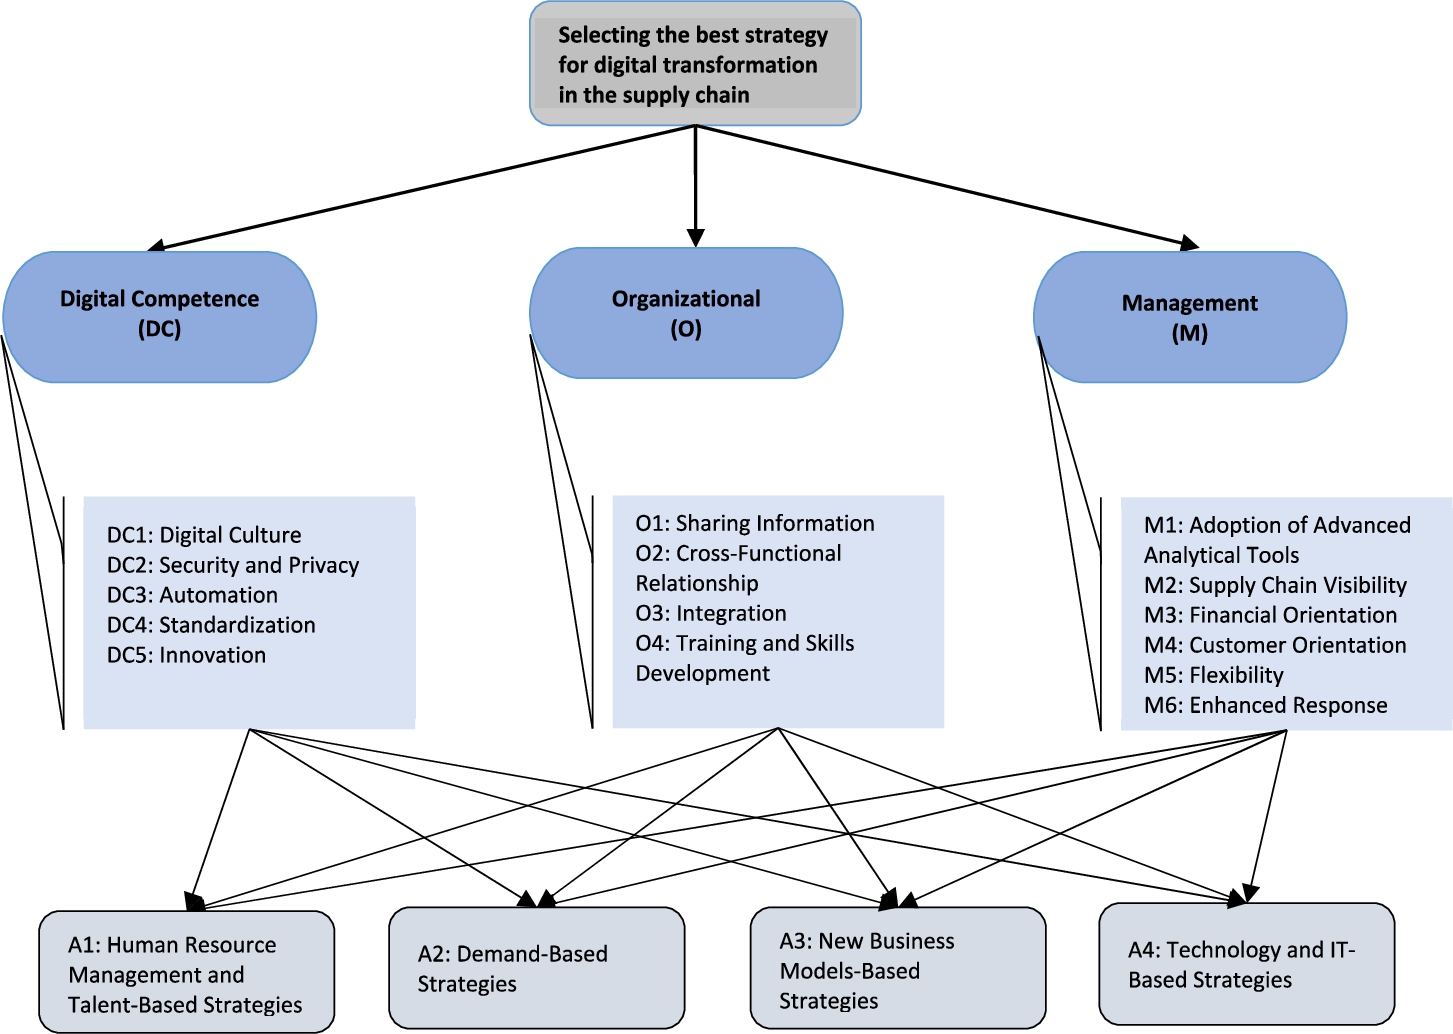
Table 23
Difference matrix for main criteria.
| Goal | DC | O | M | |||
| DC | 0 | 0 | 0.2 | 0.307 | −0.232 | −0.152 |
| O | −0.34 | −0.21 | 0 | 0 | −0.668 | −0.449 |
| M | 0.152 | 0.232 | 0.434 | 0.645 | 0 | 0 |
Table 24
Interval multiplicative matrix.
| Goal | DC | O | M | |||
| DC | 1 | 1 | 1.586 | 2.026 | 0.586 | 0.708 |
| O | 0.457 | 0.613 | 1 | 1 | 0.215 | 0.355 |
| M | 1.419 | 1.705 | 2.714 | 4.412 | 1 | 1 |
Table 25
Weights before normalization.
| Goal | DC | O | M |
| DC | 1 | 1.614 | 0.594 |
| O | 0.467 | 1 | 0.223 |
| M | 1.438 | 2.811 | 1 |
Table 26
Priority and overall weights of criteria.
| Main criteria | DC | O | M | ||||||||||||
| Weights | 0.316 | 0.167 | 0.517 | ||||||||||||
| Sub-criteria | DC1 | DC2 | DC3 | DC4 | DC5 | O1 | O2 | O3 | O4 | M1 | M2 | M3 | M4 | M5 | M6 |
| Weights | 0.32 | 0.1 | 0.21 | 0.08 | 0.29 | 0.33 | 0.15 | 0.39 | 0.13 | 0.27 | 0.22 | 0.05 | 0.26 | 0.08 | 0.11 |
| Overall | 0.10 | 0.03 | 0.07 | 0.02 | 0.09 | 0.055 | 0.025 | 0.066 | 0.021 | 0.14 | 0.11 | 0.03 | 0.14 | 0.04 | 0.06 |
Table 27
Priority weights of alternatives according to each criterion.
| DC1 | DC2 | DC3 | DC4 | DC5 | O1 | O2 | O3 | O4 | |
| A1 | 0.353 | 0.092 | 0.071 | 0.121 | 0.074 | 0.153 | 0.186 | 0.277 | 0.461 |
| A2 | 0.121 | 0.155 | 0.224 | 0.197 | 0.310 | 0.455 | 0.398 | 0.375 | 0.126 |
| A3 | 0.202 | 0.190 | 0.219 | 0.308 | 0.374 | 0.318 | 0.343 | 0.250 | 0.237 |
| A4 | 0.324 | 0.564 | 0.487 | 0.375 | 0.242 | 0.074 | 0.073 | 0.099 | 0.176 |
| M1 | M2 | M3 | M4 | M5 | M6 | |
| A1 | 0.080 | 0.091 | 0.069 | 0.127 | 0.109 | 0.079 |
| A2 | 0.499 | 0.467 | 0.185 | 0.374 | 0.435 | 0.437 |
| A3 | 0.191 | 0.220 | 0.238 | 0.296 | 0.319 | 0.274 |
| A4 | 0.230 | 0.222 | 0.508 | 0.202 | 0.136 | 0.210 |
Table 28
Score values and ranking of alternatives.
| Alternatives | A1 | A2 | A3 | A4 |
| Final scores | 0.144 | 0.35 | 0.258 | 0.248 |
| Rank | 4 | 1 | 2 | 3 |
5.3Sensitivity Analysis
A sensitivity analysis is performed to observe the effects of possible changes in the main criterion weights on the prioritization of digital transformation strategies in the supply chain. In this stage, the different final rankings of alternatives are observed as given in Fig. 6. The X-axis represents the change between CHI and CLI of the main criterion weight for four alternatives while Y-axis represents the ranking of alternatives. In this analysis, we change the weights of a certain criterion for each expert between CHI and CLI while the other criteria weights are fixed. For instance, when the weight of organizational criterion with respect to digital competence criterion is changed between CHI and CLI, A2 has always placed in the first rank; when the weight of management criterion with respect to organizational criterion is also changed between CHI and CLI, A2 has been always observed in the first rank similarly. Unlike the others, when the weight of management criterion with respect to digital competence criterion is changed between CHI and CLI, A4 has only placed in the first rank while its weight is CHI and A2 has been observed as the best alternative in other linguistic weights. Sensitivity analysis shows that the main criterion weights only have a limited effect on results and there is not a noteworthy change in the ranking of alternatives.
Fig. 6
Results of sensitivity analysis in the main criteria weight.
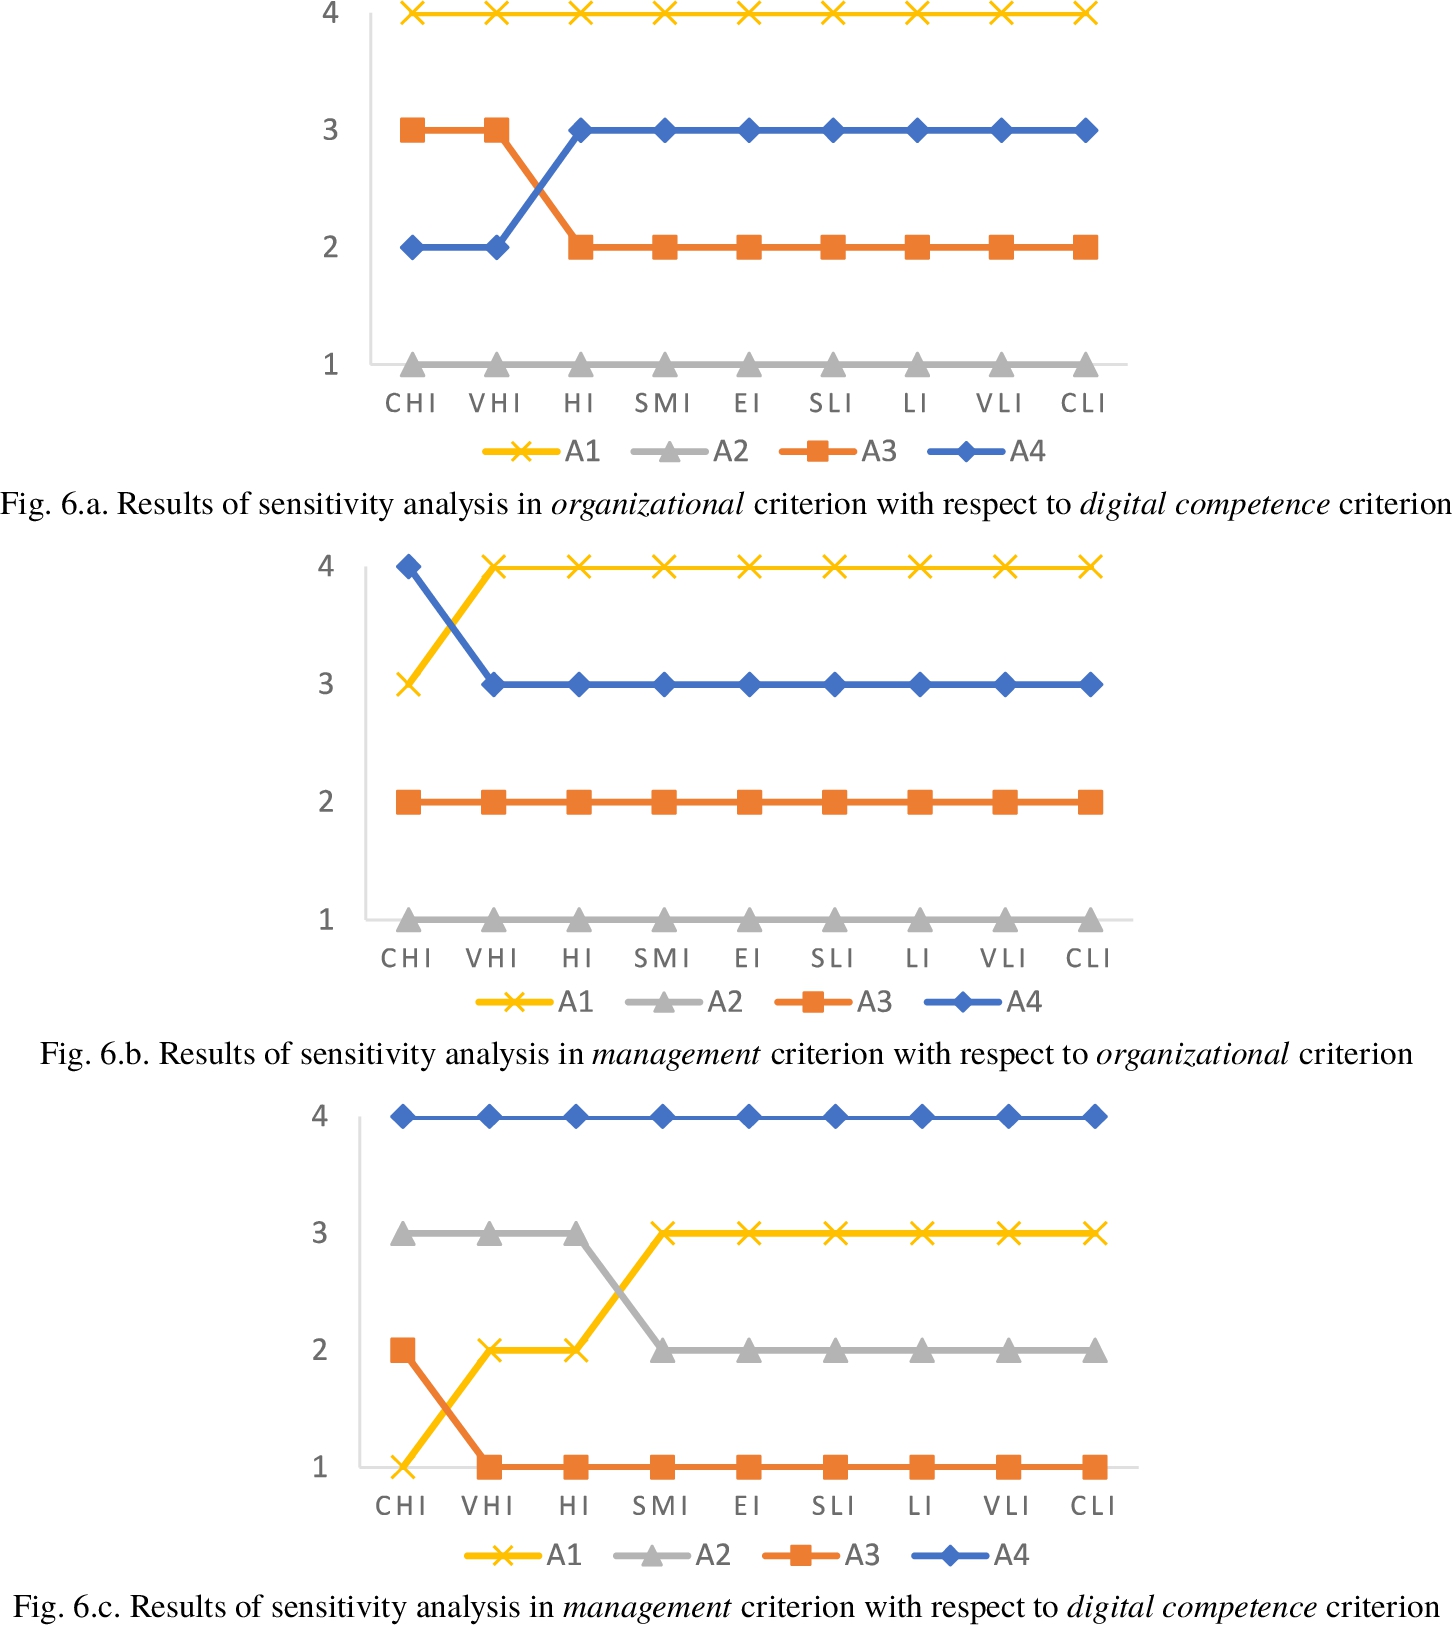
Table 29
Buckley’s ordinary fuzzy AHP scale.
| Linguistic terms | Fuzzy numbers |
| Equally Importance | |
| Slightly More Importance | |
| High Importance | |
| Very High Importance | |
| Certainly High Importance |
Table 30
Crisp-AHP scale.
| Degree of importance | Scale | Reciprocal |
| Equally Importance | 1 | 1 |
| Moderate Importance | 3 | 1/3 |
| Strong Importance | 5 | 1/5 |
| Very Strong Importance | 7 | 1/7 |
| Extremely Importance | 9 | 1/9 |
5.4Comparative Analysis
In this section, a comparative analysis is conducted to demonstrate the validity and verify the effectiveness of the proposed method. The results of our proposed IVFF-AHP method are compared with Buckley’s ordinary fuzzy AHP and crisp-AHP. We used the scale of Buckley’s ordinary fuzzy AHP given in Table 29 and the scale of crisp-AHP given in Table 30 to assign the numerical values corresponding to experts’ linguistic evaluations. Due to the space constraints, we only present the weights of criteria and ranking of alternatives obtained from ordinary fuzzy AHP and crisp-AHP methods. Table 31 and Table 32 demonstrate the priority and overall weights of criteria for each method, respectively. The final scores and ranking of alternatives for both methods are presented in Table 33 and Table 34, respectively.
Table 31
Priority and overall weights of the criteria in the fuzzy AHP method.
| Main criteria | DC | O | M | ||||||||||||
| Weights | 0.203 | 0.08 | 0.717 | ||||||||||||
| Sub-criteria | DC1 | DC2 | DC3 | DC4 | DC5 | O1 | O2 | O3 | O4 | M1 | M2 | M3 | M4 | M5 | M6 |
| Weights | 0.64 | 0.018 | 0.08 | 0.01 | 0.26 | 0.299 | 0.07 | 0.57 | 0.06 | 0.299 | 0.18 | 0.03 | 0.37 | 0.05 | 0.06 |
| Overall | 0.13 | 0.004 | 0.016 | 0.002 | 0.05 | 0.024 | 0.006 | 0.046 | 0.005 | 0.215 | 0.132 | 0.023 | 0.27 | 0.035 | 0.045 |
Table 32
Priority and overall weights of criteria in the crisp AHP method.
| Main criteria | DC | O | M | ||||||||||||
| Weights | 0.262 | 0.088 | 0.65 | ||||||||||||
| Sub-criteria | DC1 | DC2 | DC3 | DC4 | DC5 | O1 | O2 | O3 | O4 | M1 | M2 | M3 | M4 | M5 | M6 |
| Weights | 0.43 | 0.06 | 0.18 | 0.04 | 0.285 | 0.33 | 0.09 | 0.51 | 0.07 | 0.284 | 0.216 | 0.03 | 0.33 | 0.054 | 0.08 |
| Overall | 0.11 | 0.02 | 0.047 | 0.01 | 0.075 | 0.03 | 0.008 | 0.045 | 0.006 | 0.185 | 0.14 | 0.02 | 0.217 | 0.035 | 0.054 |
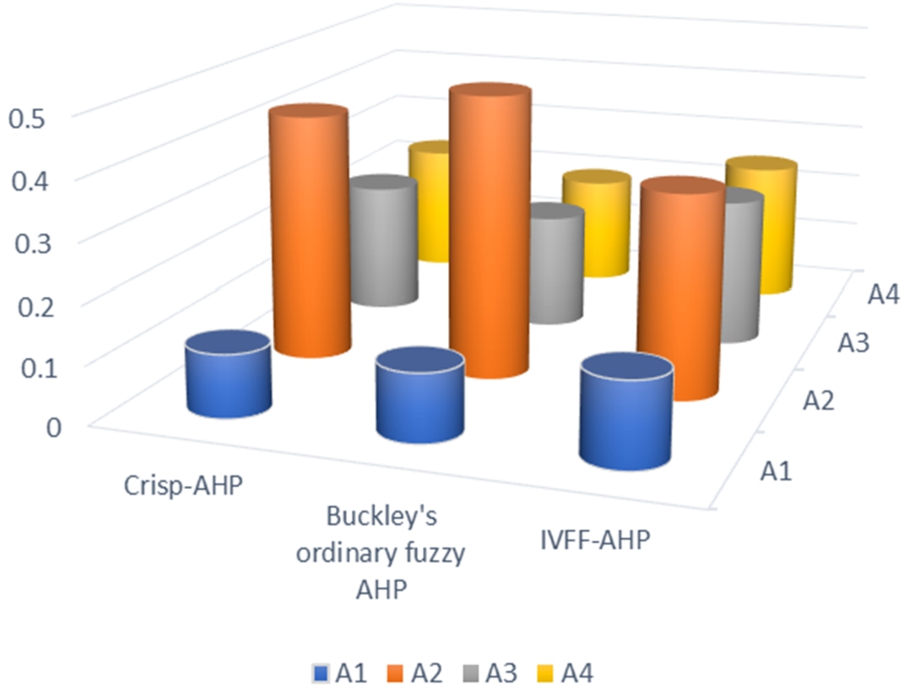
When the results obtained with the proposed method are compared with the results obtained from both Buckley’s ordinary fuzzy AHP and crisp-AHP methods, A2 is ranked as the best alternative in all methods (See Fig. 7). The rest of the ranking is followed by A3, A4, and finally A1 in Buckley’s ordinary fuzzy AHP method while followed by A4, A3, and finally A1 in crisp-AHP method. Although the ranking of alternatives in Buckley’s ordinary fuzzy AHP method gives the same results as our proposed method, the weights of alternatives in the proposed method are different than other compared methods. The advantage of our proposed method, unlike other methods, is that the differences between the weights of the alternatives are more distinct. This difference is because FFSs present a larger domain for parameter assignment. Besides, the ranking differences that arise in the crisp- AHP method also come from the fuzzy evaluations of the proposed method.
Table 33
Results of the fuzzy AHP.
| Alternatives | A1 | A2 | A3 | A4 |
| Final Scores | 0.116 | 0.488 | 0.201 | 0.195 |
| Rank | 4 | 1 | 2 | 3 |
Table 34
Results of the crisp AHP.
| Alternatives | A1 | A2 | A3 | A4 |
| Final Scores | 0.109 | 0.43 | 0.23 | 0.232 |
| Rank | 4 | 1 | 3 | 2 |
Fig. 7
Comparison results of the ranking of alternatives based on different evaluation environments.
6Conclusion
To protect and sustain the existence of organizations with digitalization in today’s competitive conditions, it has been inevitable to direct their traditional supply chains toward the digital supply chain transformation. With the digital transformation in the supply chain, information has the potential to reach the right place, the right time, and the right person. However, since the traditional supply chain has a complex structure, no enterprise has been able to initiate digital transformation in the supply chain. This situation has always been a challenging process for organizations by forcing organizations to remain in the initial stages of digital transformation. Therefore, there has been a need for a comprehensive framework to guide organizations.
There is a great lack in the literature on how digital transformation in the supply chain is realized, what the key success factors are, what kind of strategies should be developed and to which strategy priority should be given. This situation has revealed the need for an evaluation covering more than one criterion in a fuzzy environment. A fuzzy MCDM approach has been proposed to handle this evaluation process in this paper.
FFSs are quite suitable to handle uncertainty rather than other fuzzy set extensions by assigning the membership and non-membership degrees from a larger domain. IVFFSs address the problems in vague and uncertain environments more powerfully because they have the ability to express information more flexibly. Especially with the use of IVFFS in MCDM approaches, uncertainties are handled more strongly and thus the decision-making process can be managed more accurately with the proposed approach. In this study, IVFFSs have been introduced to better handle uncertainty and an IVFF-AHP method has been proposed. The developed method has been applied to identify the best strategy in the digital supply chain. The IVFF-AHP method has been successfully employed to determine the best strategy by making pairwise comparisons. In the study, we also developed a novel defuzzification method for IVFFSs.
This study has provided guidance and awareness about identifying critical success factors that are important for organizations to achieve the digital supply chain transformation, and to determine what kind of strategies they should first develop for a successful transformation. Besides, a systematic framework has been also developed to define the requirements of digital transformation in the supply chain. In this way, the main criteria and sub-criteria which are required for digital supply chain transformation have been determined and attention has been drawn to the criteria that organizations should first focus on.
Sensitivity analysis has shown that by changing the weights of the main criteria, the ranking of alternatives almost did not change, and this has proved that our decision-making process was quite robust and effective. Thus, the strength of the developed method has been demonstrated by the sensitivity analysis. A comparative analysis conducted together with Buckley’s ordinary fuzzy AHP and crisp AHP showed that the developed method offers more consistent, reliable and informative results with more details about the uncertain decision-making environment.
For further research, the different IVFF-AHP and single-valued FFAHP methods such as triangular FFAHP or trapezoidal FFAHP can be developed. Alternatively, we suggest IVFF-AHP to be compared with other extensions of fuzzy sets such as neutrosophic AHP, interval-valued intuitionistic fuzzy AHP, interval-valued Pythagorean fuzzy AHP, or hesitant fuzzy AHP. Additionally, other multi-criteria decision-making methods such as TOPSIS or VIKOR can be extended to their IVFFSs extensions.
References
1 | Abdel-Basset, M., Mohamed, M., Zhou, Y., Hezam, I. ((2017) ). Multi-criteria group decision making based on neutrosophic analytic hierarchy process. Journal of Intelligent and Fuzzy Systems, 333: (6), 4055–4066. |
2 | Agrawal P., Narain, R. (2018). Digital supply chain management: an overview. In: IOP Conference Series: Materials Science and Engineering, Vol. 455. |
3 | Alicke, K., Rachor, J., Seyfert, A. (2016). Supply Chain 4.0 – the next-generation digital supply chain, McKinsey&Company. |
4 | Alkan, N. ((2021) ). Risk analysis for digitalization oriented sustainable supply chain using interval-valued Pythagorean fuzzy AHP. Advances in Intelligent Systems and Computing, 1197: , 1373–1381. |
5 | Alkan, N., Kahraman, C. ((2021) ). Extensions of fuzzy sets in big data applications: a literature review. Advances in Intelligent Systems and Computing, 1197: , 884–893. |
6 | Atannasov, K. ((1986) ). Intuitionistic fuzzy sets. Fuzzy Sets and Systems, 20: (1), 87–96. |
7 | Atannasov, K. ((1999) ). Intuitionistic Fuzzy Sets, Theory and Applications. Physica-Verlag, Heidelberg. |
8 | Bailey, G., Moss, C., Kurz, D. ((2017) ). Digital Supply Chain Transformation Guide: Essential Guide. The Center for Global Enterprise. |
9 | Bhargava, B., Ranchal, R., Othmane, L. ((2013) ). Secure information sharing in digital supply chains. In: Proceedings of the 2013 3rd IEEE International Advance Computing Conference, IACC 2013. |
10 | Bienhaus, F., Haddud, A. ((2018) ). Procurement 4.0: factors influencing the digitisation of procurement and supply chains. Business Process Management Journal, 24: (4), 965–984. |
11 | Bolturk, E., Kahraman, C. ((2018) ). A novel interval-valued neutrosophic AHP with cosine similarity measure. Soft Computing, 22: (15), 4941–4958. |
12 | Buckley, J. ((1985) ). Fuzzy hierarchical analysis. Fuzzy Sets and Systems 17: (3), 233–247. |
13 | Büyüközkan, G., Göçer, F. ((2017) ). An extension of MOORA approach for group decision making based on interval valued intuitionistic fuzzy numbers in digital supply chain. In: IFSA-SCIS 2017 – Joint 17th World Congress of International Fuzzy Systems Association and 9th International Conference on Soft Computing and Intelligent Systems, Japan. |
14 | Büyüközkan, G., Göçer, F. ((2018) a). Digital supply chain: literature review and a proposed framework. Computers in Industry, 97: , 157–177. |
15 | Büyüközkan, G., Göçer, F. ((2018) b). An extension of ARAS methodology under interval valued intuitionistic fuzzy environment for digital supply chain. Applied Soft Computing, 69: , 634–654. |
16 | Büyüközkan, G., Göçer, F. (2019). A novel approach integrating AHP and COPRAS under Pythagorean fuzzy sets for digital supply Chain partner selection. IEEE Transactions On Engineering Management. |
17 | Chang, D. ((1986) ). Applications of the extent analysis method on fuzzy AHP. European Journal of Operational Research, 95: (3), 649–655. |
18 | Dougados, M., Felgendreher, B. (2016). The Current and Future State of Digital Supply Chain Transformation. Infor, Capgemini Consulting and NT Nexus. |
19 | Duan, W., Gulistan, M., Abbasi, F., Khurshid, A., Al-Shamiri, M. (2021). q-Rung double hierarchy linguistic term set fuzzy AHP; applications in the security system threats features of social media platforms. International Journal of Intelligent Systems. |
20 | Farahani, P., Meier, C., Wilke, J. ((2016) a). A Vision on Digital Supply Chain Management in 2020, Shaping the Digital Enterprise: Trends and Use Cases in Digital Innovation and Transformation. Springer Nature, Switzerland, pp. 157–172. |
21 | Farahani, P., Meier, C., Wilke, J. ((2016) b). Digital Supply Chain Management Agenda for the Automotive Supplier Industry, Shaping the Digital Enterprise: Trends and Use Cases in Digital Innovation and Transformation. Springer International Publishing, Switzerland, pp. 157–172. |
22 | Farahani, P., Meiner, C., Wilke, J. (2020). Digital Supply Chain Management 2020 Vision, SAP. |
23 | Garg, H., Ali, Z., Mahmood, T. (2021). Algorithms for complex interval-valued q-rung orthopair fuzzy sets in decision making based on aggregation operators, AHP, and TOPSIS. Expert Systems, 38(1). |
24 | Gezgin, E., Huang, X., Samal, P., Silva, I. (2017). Digital Transformation: Raising Supply Chain Performance the New Levels. McKinsey&Company. |
25 | Gul, M. ((2018) ). Application of Pythagorean fuzzy AHP and VIKOR methods in occupational health and safety risk assessment: the case of a gun and rifle barrel external surface oxidation and colouring unit. International Journal of Occupational Safety and Ergonomics, 26: (4), 705–718. |
26 | Ivanov, D., Dolgui, A., Sokolov, B. ((2019) ). The impact of digital technology and Industry 4.0 on the ripple effect and supply chain risk analytics. International Journal of Production Research, 57: (3), 829–846. |
27 | Jeevaraj, S. ((2021) ). Ordering of interval-valued Fermatean fuzzy sets and its applications. Expert Systems with Applications, 185: , 115613. |
28 | Kahraman, C., Oztaysi, B., Sari, I., Turanoğlu, E. ((2016) ). Fuzzy analytic hierarchy process with interval type-2 fuzzy sets. Knowl Based System, 59: , 48–57. |
29 | Kahraman, C., Onar, S.Ş., Öztayşi, B., Şeker, Ş., Karaşan, A. (((1-2) (2020)) ). Integration of fuzzy AHP with other fuzzy multicriteria methods: a state of the art survey. Journal of Multiple-Valued Logic and Soft Computing, 35: , 61–92. |
30 | Karasan, A., Ilbahar, E., Kahraman, C. ((2019) ). A novel pythagorean fuzzy AHP and its application to landfill site selection problem. Soft Computing, 23: (21), 10953–10968. |
31 | Kearney, A.T., ((2015) ). Digital Supply Chains: Increasingly Critical for Competitive Edge. WHU Otto Beisheim School of Management. |
32 | Korpela, K., Mikkonen, K., Hallikas, J., Pynnönen, M. ((2016) ). Digital business ecosystem transformation: toward cloud integration. In: Proceedings of the Annual Hawaii International Conference on System Sciences, United States. |
33 | Kutlu Gündoğdu, F., Duleba, S., Moslem, S., Aydın, S. ((2021) ). Evaluating public transport service quality using picture fuzzy analytic hierarchy process and linear assignment model. Applied Soft Computing, 100: , 106920. |
34 | Luthra, S., Mangla, S. ((2018) ). Evaluating challenges to Industry 4.0 initiatives for supply chain sustainability in emerging economies. Process Safety and Environmental Protection, 117: , 168–179. |
35 | Mathew, M., Chakrabortty, R., Ryan, M. ((2020) ). A novel approach integrating AHP and TOPSIS under spherical fuzzy sets for advanced manufacturing system selection. Engineering Applications of Artificial Intelligence, 96: , 103988. |
36 | Otay, I., Oztaysi, B., Onar, S., Kahraman, C. ((2017) ). Multi-expert performance evaluation of healthcare institutions using an integrated intuitionistic fuzzy AHP&DEA methodology. Knowledge-Based Systems, 133: , 90–106. |
37 | Öztaysi, B., Onar, S., Bolturk, E., Kahraman, C. (2015). Hesitant fuzzy analytic hierarchy process. In: 2015 IEEE international conference fuzzy systems (FUZZ-IEEE), PP. 1–7. |
38 | Pundir, A., Jagannath, J., Chakraborty, M. ((2019) ). Technology integration for improved performance: a case study in digitization of supply chain with integration of internet of things and blockchain technology. In: 2019 IEEE 9th Annual Computing and Communication Workshop and Conference, CCWC 2019, United States. |
39 | PwC Sweden (2018). Digital Supply Chain: Making the Supply Chains More Efficient, Agile, and Customer-Focused. |
40 | Raab M., Griffin-Cryan, B. (2011). Digital Transformation of Supply Chains. Capgemini Consulting. |
41 | Saaty, T.L. ((2008) ). Decision making with the analytic hierarchy process. International Journal of Services Sciences, 1: (1), 83–98. |
42 | Sadiq, R., Tesfamariam, S. ((2009) ). Environmental decision-making under uncertainty using intuitionistic fuzzy analytic hierarchy process. Stochastic Environmental Research and Risk Assessment, 23: (1), 75–91. |
43 | Schrauf, S., Berttram, P. ((2016) ). How Digitization Makes the Supply Chain More Efficient, Agile, and Customer-Focused. PwC Strategy& Germany. |
44 | Scuotto, V., Caputo, F., Villasalero, Del Giudice M, M. ((2017) ). A multiple buyer – supplier relationship in the context of SMEs’ digital supply chain management. Production Planning & Control, 28: (16), 1378–1388. |
45 | Senapati, T., Yager, R. ((2019) a). Some new operations over fermatean fuzzy numbers and application of fermatean fuzzy WPM in multiple criteria decision making. Informatica, 30: (2), 391–412. |
46 | Senapati, T., Yager, R. ((2019) b). Fermatean fuzzy weighted averaging/geometric operators and its application in multi-criteria decision-making methods. Engineering Applications of Artificial Intelligence, 85: , 112–121. |
47 | Senapati, T., Yager, R. ((2020) ). Fermatean fuzzy sets. Journal of Ambient Intelligence and Humanized Computing, 11: (2), 663–674. |
48 | The Center for Global Enterprise (2015). Digital Supply Chains: A Frontside Flip. |
49 | Tjahjono, B., Esplugues, C., Ares, E., Pelaez, G. ((2017) ). What does Industry 4.0 mean to Supply Chain? In: Manufacturing Engineering Society International Conference 2017, MESIC 2017, Vigo, Spain. |
50 | Torra, V. ((2010) ). Hesitant fuzzy sets. International Journal of Intelligent Systems, 25: (6), 529–539. |
51 | Uhl, A., Gollenia, A. ((2016) ). Digital Enterprise Transformation: A Business-Driven Approach to Leveraging Innovative IT. Routledge. |
52 | Van Laarhoven, P., Pedrycz, W. ((1983) ). A fuzzy extension of Saaty’s priority theory. Fuzzy Sets Syst, 11: (1–3), 229–241. |
53 | WTO, IDE-JETRO, OECD, UIBE, World Bank Group ((2019) ). Technological, Innovation Supply Chain Trade, and Workers in a Globalized World. World Trade Organization, Switzerland. |
54 | Wu, J., Huang, H., Cao, Q. ((2013) ). Research on AHP with interval-valued intuitionistic fuzzy sets and its application in multicriteria decision making problems. Applied Mathematical Modelling, 37: (24), 9898–9906. |
55 | Xu, J. ((2014) ). Managing Digital Enterprise Ten Essential Topics. Atlantis Press, Paris. |
56 | Yager, R. ((2013) ). Pythagorean fuzzy subsets. In: Proceedings of the 2013 Joint IFSA World Congress and NAFIPS Annual Meeting, IFSA/NAFIPS 2013, pp. 57–61. |
57 | Yager, R. ((2017) ). Generalized orthopair fuzzy sets. IEEE Transactions on Fuzzy Systems, 25: (5), 1222–1230. |
58 | Zadeh, L. ((1965) ). Fuzzy sets. Information and Control, 8: (3), 338–353. |
59 | Zadeh, L. ((1975) ). The concept of a linguistic variable and its application. Information Sciences, 8: (3), 199–249. |
60 | Zhang, X., Xu, Z. ((2014) ). Extension of TOPSIS to multiple criteria decision making with pythagorean fuzzy sets. International Journal of Intelligent Systems, 29: (12), 1061–1078. |


