
New Product Design Using Chebyshev’s Inequality Based Interval-Valued Intuitionistic Z-Fuzzy QFD Method
Abstract
In Quality function deployment (QFD) approach, customers tend to express their needs in linguistic terms rather than exact numerical values and these needs generally contain vague and imprecise information. To overcome this challenge and to use the method more effectively for complex customer-oriented design problems, this paper introduces a novel intuitionistic Z-fuzzy QFD method based on Chebyshev’s inequality (CI) and applies it for a new product design. CI provides the assignment of a more objective reliability function. The reliability value is based on the maximum probability obtained from CI. Then, the expected values of lower and upper bounds of interval-valued intuitionistic fuzzy (IVIF) numbers are determined. A competitive analysis among our firm and competitor firms and an integrative analysis for the different functions of QFD is presented. The proposed Z-fuzzy QFD method is applied to the design and development of a hand sanitizer for struggling with COVID-19.
1Introduction
With each passing day, customers’ expectations of the product that they are planning to purchase are increasing. Today, manufacturers and service providers must meet customer demands at the maximum level in order to be successful and maintain their continuity. Their competitive advantage depends on the aesthetic success of the product they offer for sale as well as the technical features. Customers generally expect the product to be affordable, durable, easy to use and appealing to the eye. However, it is difficult, even impossible sometimes, for the producers to meet all these demands at the same time due to economical and timewise limitations. Companies must first prioritize customer needs in order to determine the best product they can produce using their competencies and the maximum customer demands they can respond to. One of the most used methods for this purpose is Quality Function Deployment (QFD).
House of Quality (HOQ) is a special and mostly used part of QFD which is named for its shape that reminds of a house with a roof on top. A classical HOQ consists of some parts in matrix form such as customer demands (CDs), customer evaluations (CEs) of those demands, technical descriptors (TDs), relationship matrix between CDs and TDs, and correlation matrix among TDs. In some recent studies, new matrices are added eligibly to the common parts such as technical difficulty and direction of improvement of TDs, and competitive analysis for both CDs and TDs. The HOQ matrices are generally constructed by an effort of a team of experts and multiple customers. Since humans tend to express their thoughts and ideas linguistically rather than exact and precise numbers, this brings vagueness and impreciseness to the design and development process. To overcome this obstacle and deal with complex problems more realistically, the fuzzy set theory has been applied successfully for decades.
The fuzzy set theory was introduced in the literature by Zadeh (1965) as ordinary fuzzy sets which are represented by an x value and its membership degree. Later, in 1986, intuitionistic fuzzy sets (IFSs) have been developed as a generalization of Zadeh’s ordinary fuzzy sets by Atanassov (1986) which involve the degrees of membership and non-membership together with experts’ hesitancies for an x value. Later, neutrosophic sets are introduced in the literature by Smarandache (1998) which consist of three components truthiness, indeterminacy, and falsity where these components can be assigned independently. Pythagorean fuzzy sets are developed by Yager (2013) and allowed the squared sum of the membership and non-membership degrees to be at most one. Picture fuzzy sets (PiFS) have been developed by Cuong (2015) in order to define a fuzzy set by membership, non-membership, and hesitancy degrees so that their squared sum is at most equal to one. As an extension of PiFs, Kutlu Gündoğdu and Kahraman (2019) developed the spherical fuzzy sets that the squared sum of three components (membership, non-membership, and hesitancy degrees) to be between zero and one. One of the latest extensions of intuitionistic fuzzy sets is circular intuitionistic fuzzy sets developed by Atanassov (2020). They add the uncertainty of the membership and non-membership degrees by defining a circle with radius “r” for these values.
In this paper IVIFSs are employed in the proposed QFD method taking into consideration the reliability of the assigned IVIF numbers. The reliability in this method is handled by Z-fuzzy numbers developed by Zadeh (2011). Z-fuzzy number is an ordered pair of fuzzy numbers where the first component is a real-valued uncertain variable as a restriction on the values. The second component is a measure of reliability for the first component. Z- fuzzy numbers are used to make computations with fuzzy numbers which are not totally reliable. A Z-fuzzy number can represent the information about an uncertain variable, whose first component represents a value of the variable, and the second component represents an idea of uncertainty or probability. In other words, the second component shows how sure the decision maker is with the first component (Yaakob and Gegov, 2015). Chebyshev’s inequality is employed to calculate the maximum probability to determine the expected values of lower and upper bounds of the IVIF number in the first component. Thus, we obtain more realistic and objective results compared to classical Z-fuzzy approaches.
The advantage of our study and its contribution to the literature can be explained as follows. In most of the Z-fuzzy number studies, sufficient details on how to construct the reliability function are not presented. This study scientifically explains how to create the reliability function and integrate it into the restriction function with the help of Chebyshev’s theory. Obtaining the extreme values in IVIF numbers through the integration of reliability factor is realized by using probability theory. Therefore, this paper offers a very different Z-fuzzy number idea from Zadeh’s classical Z-fuzzy proposal. The advantage of our method is that it presents the QFD approach under intuitionistic fuzziness with all its aspects such as technical difficulty, competitive analysis through CDs and TDs.
The rest of this study is organized as follows. Section 2 presents a literature review on fuzzy QFD (F-QFD). Section 3 gives the preliminaries for intuitionistic Z-fuzzy numbers based on Chebyshev’s inequality. Section 4 develops the intuitionistic Z-fuzzy QFD method based on Chebyshev’s inequality. Section 5 illustrates the application of the proposed model on a new hand sanitizer design and development. Section 6 concludes the paper with discussions and future directions.
2Literature Review
A literature review on F-QFD based on Scopus database gives a list of 185 publications. Figure 1 shows the distribution of the F-QFD publications with respect to years.
Fig. 1
Distribution of the F-QFD publications with respect to years.
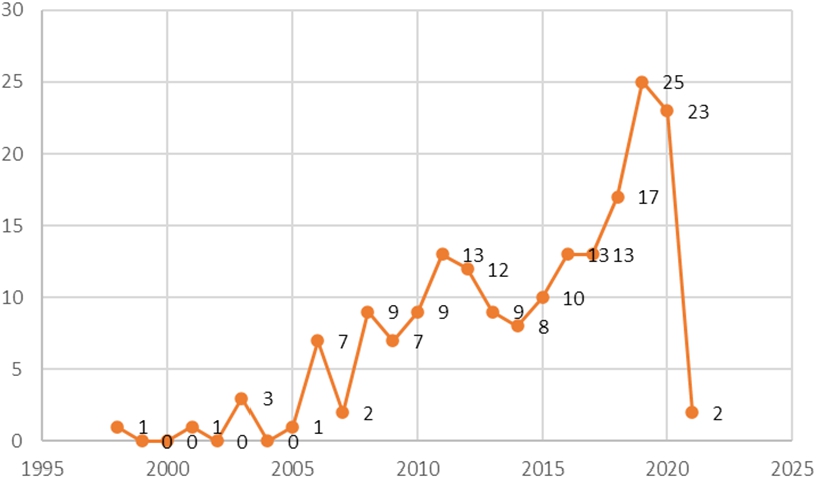
Fig. 2
Document type distributions of F-QFD publications.
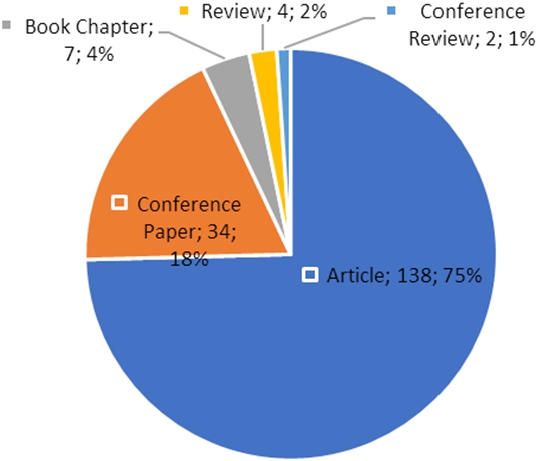
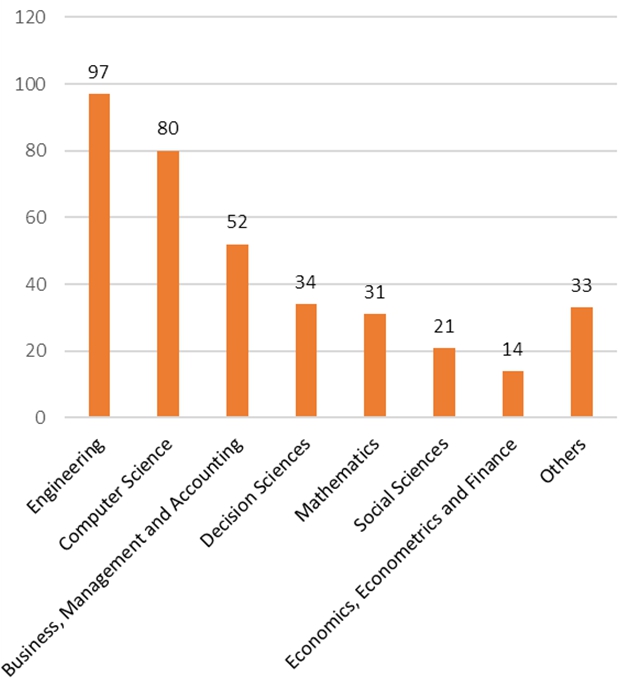
Fig. 3
Document type distributions of F-QFD publications.
After the first study on F-QFD was published in 1998, the highest publication rate was attained in 2019 with 25 studies.
As given in Fig. 2, most of the F-QFD studies are in article form which is followed by conference papers and book chapters.
F-QFD has been applied to many subject areas. Figure 3 shows the frequencies of these publications. Engineering, computer science, and business, management and accounting are the most frequently applied subjects, respectively.
Some representative F-QFD studies are presented in Table 1 together with the type of fuzzy sets used, integrated methods, and application areas.
We can conclude at the end of the literature review that TFNs are used more than other types of fuzzy numbers. The most integrated methods with F-QFD are AHP, ANP, TOPSIS, FMEA, and DM, respectively. The most used extensions of ordinary fuzzy sets with F-QFD are IFNs, HFNs, T2FNs and SFNs, respectively. The application areas of F-QFD are quite different from delivery drone design to choosing the ideal gas fuel at wastewater treatment plants. A focused application area of F-QFD is not observed in this comprehensive literature review.
3Chebyshev’s Inequality Based IV-Intuitionistic Z-Fuzzy Numbers
Table 1
Some representative F-QFD studies.
| Authors (year) | Type of fuzzy sets | Integrated methods | Application area | |
| 1 | Haktanır et al. (2021) | SFNs | – | Delivery drone design |
| 2 | Lee and Park (2021) | TFNs | – | Prioritization of work activities of construction for safety |
| 3 | Efe et al. (2020) | IT2FNs | TOPSIS | Mobile phone selection |
| 4 | Baskar et al. (2020) | TFNs | DM, ISM, ANP, VIKOR, FMEA | Sesame seed separator development |
| 5 | Kang (2020) | TFNs | RST | Aesthetic product design |
| 6 | Bhuvanesh Kumar and Parameshwaran (2020) | TFNs | FMEA, AHP | Prioritizing lean tools for manufacturing industries |
| 7 | Ocampo et al. (2020) | TFNs | AHP, DEMATEL, ANP | Sustainable product design |
| 8 | Wang et al. (2020) | TFNs | GDM | Supply chain collaborative quality design of large complex products |
| 9 | Aouag et al. (2020) | TFNs | DEMATEL | Enhancement of value stream mapping application process |
| 10 | Büyüközkan et al. (2020) | TFNs | AHP | Customer oriented multifunctional power bank design |
| 11 | Kutlu Gündoğdu and Kahraman (2020) | SFNs | – | Linear delta robot technology development |
| 12 | Seker (2020a) | TFNs | AHP | Retail chain |
| 13 | Li et al. (2020) | TFNs | GOA, DM, ML | Analysis and extraction of consumer information for the evaluation of design requirement |
| 14 | Büyüközkan and Uztürk (2020) | IVIFNs | MCDM | Smart fridge design |
| 15 | Seker (2020b) | TFNs | – | Smart phone product design |
| 16 | Fan et al. (2020) | IFNs | ANP | Optimal selection of design scheme in cloud environment |
| 17 | Haktanır (2020) | IVPFSs | COPRAS | Prioritization of competitive suppliers |
| 18 | Deveci et al. (2019) | IVIFNs | PCA | Evaluation of service quality in public bus transportation |
| 19 | Kayapınar and Erginel (2019) | TFNs | SERVQUAL, MODM | Designing the airport service |
| 20 | Haktanır and Kahraman (2019) | IVPFSs | – | Solar photovoltaic technology development |
| 21 | Beheshtinia and Farzaneh Azad (2019) | TFNs | SERVQUAL, KANO | Budget constraint for hotel services |
| 22 | Lu et al. (2019) | TFNs | AHP, ANP | Design of brand revitalisation |
| 23 | Bilişik et al. (2019) | TFNs | – | Passenger satisfaction evaluation of public transportation in Istanbul |
| 24 | Ma et al. (2019a) | TFNs | FMEA | Identification of to-be-improved components for redesign of complex products and systems |
| 25 | Wang et al. (2019) | TFNs | AHP, MAM | Design and implementation of a hand training device |
| 26 | Wang (2019) | IFNs | AHP | Product design: case study on touch panels |
| 27 | Senthilkannan and Parameshwaran (2019) | TFNs | DM, AHP, FMEA, TOPSIS | Performance analysis and quality improvement in paper industry |
| 28 | Piengang et al. (2019) | TFNs | AHP, VIKOR | An APS software selection methodology |
| 29 | Ma et al. (2019b) | TFNs | FMEA | Identifying function components for product redesign |
| 30 | Fitriana et al. (2019) | TpFNs | DMM | Measurement and proposal of improving marketing process to improve the quality of aftersales in OV agency |
| 31 | Yazdani et al. (2019) | IVTFNs | GRA | Multi attribute decision support model in a supply chain |
| 32 | Jafarzadeh et al. (2018) | TFNs | DEA | Project portfolio selection |
| 33 | Shuofang et al. (2018) | TFNs | EGM | Study methods of design elements |
| 34 | Osorio-Gómez and Manotas-Duque (2018) | TFNs | TOPSIS | Dispatching prioritization in maritime transportation considering operational risk |
| 35 | Osiro et al. (2018) | HFNs | – | Selecting supply chain sustainability metrics |
| 36 | De Almeida et al. (2018) | TFNs | ANP | New defense product development |
| 37 | Bhuvanesh Kumar and Parameshwaran (2018) | TFNs | FMEA | Selection of lean tools in a manufacturing organization |
| 38 | Milunovic Koprivica and Filipovic (2018) | TFNs | – | Improvement of boiler (house electric water heater) |
| 39 | Yu et al. (2018) | IVIFNs | CIM | Process of designing steering wheel for electric vehicles |
| 40 | Babbar and Amin (2018) | TpFNs | – | Supplier selection and order allocation in beverages industry |
| 41 | Liu et al. (2018) | TFNs | EGM, AHP | The importance of customer requirements and design elements and the correlation among various design elements |
| 42 | Amaladhasan et al. (2018) | TFNs | TOPSIS | Analysis and prioritisation of eco drivers in supply chain |
| 43 | Kang et al. (2018) | TFNs | EGM, KANO, AHP | New product development |
| 44 | Vongvit et al. (2017) | TFNs | TRIZ | Methodology for product development involving design of a 5-axis CNC machine from a 3-axis CNC machine |
| 45 | Liu et al. (2017) | TFNs | DSM | Process optimization of customer collaborative design |
| 46 | Chiadamrong and Tham (2017) | TFNs | SEM, MOLPM | Supply chain management strategy development |
| 47 | Akbaş and Bilgen (2017) | TFNs | TOPSIS, ANP, AHP | Choosing the ideal gas fuel at wastewater treatment plants |
| 48 | Keshteli and Davoodvandi (2017) | TFNs | AHP, TOPSIS | Ceramic and tile industry of Iran |
| 49 | Haq and Boddu (2017) | TFNs | AHP, TOPSIS | Analysis of enablers for the implementation of leagile supply chain management |
| 50 | Vinodh et al. (2017) | TFNs | – | Sustainable design of consumer electronics products |
| 51 | Çevik Onar et al. (2016) | HFNs | AHP, TOPSIS | Computer workstation selection |
| 52 | Rattawut (2016) | TFNs | AHP | Mini-CNC milling machine retrofit |
| 53 | Hakim et al. (2016) | TFNs | MOGP | Selecting processes in business process reengineering |
| 54 | Chowdhury and Quaddus (2016) | TFNs | MPOM | Sustainable service design |
| 55 | Chen (2016) | TFNs | DT | Green design quality management in industrial chain |
| 56 | Büyüközkan and Güleryüz (2015) | TFNs | GDM | IT planning in collaborative product development |
| 57 | Dat et al. (2015) | TFNs | TOPSIS | Market segment evaluation and selection |
| 58 | Xiao et al. (2015) | TpFNs | – | Identification of software non-functional requirement |
| 59 | Mohanraj et al. (2015) | TFNs | VSM | Framework for value stream mapping in an Indian camshaft manufacturing organization |
| 60 | Raut and Mahajan (2015) | TFNs | AHP | Construction industry |
| 61 | Noorul Haq and Boddu (2015) | TFNs | TOPSIS | Leanness in supply chain |
| 62 | Roghanian and Alipour (2014) | TFNs | AHP, PROMETHEE | Achieving lean attributes for competitive advantages development |
| 63 | Zaim et al. (2014) | TFNs | ANP | Product development |
| 64 | Jamalnia et al. (2014) | TpFNs | MOGP | Global facility location-allocation problem |
| 65 | Palanisamy and Zubar (2013) | TFNs | MM, ANP | Vendor ranking |
| 66 | Taylan (2013) | TFNs | GRA, FIS | Determining multi attribute customer preferences of edible oil |
| 67 | Yang et al. (2013) | TFNs | – | Design for remanufacturing |
| 68 | Tavana et al. (2013) | TFNs | ANP | Balanced scorecard |
| 69 | Nejatian and Zarei (2013) | TFNs | TOPSIS | Improving organizational agility |
| 70 | Bevilacqua et al. (2012) | TFNs | – | Characterizing customers rating of extra virgin olive oil |
| 71 | Chang (2012) | TFNs | TRIZ | Teaching quality improvement |
| 72 | Lee et al. (2012) | TFNs | FDM | Customer needs and technology analysis in new product development |
| 73 | Vinodh and Chintha (2011) | TFNs | – | Enabling sustainability |
| 74 | Chen and Huang (2011) | TFNs | – | Knowledge management |
| 75 | Kavosi and Mavi (2011) | TFNs | TOPSIS, AHP | Product design and development (pen company in Iran) |
| 76 | Khademi-Zare et al. (2010) | TFNs | TOPSIS, AHP | Ranking the strategic actions of Iran mobile cellular telecommunication |
| 77 | Yang et al. (2010) | TFNs | DMAIC, FMEA | Problem selection in the 6σ definition stage |
| 78 | Liu (2009) | TFNs | FMEA | Extension fuzzy QFD from product planning to part deployment |
| 79 | Juan et al. (2009) | TFNs | PROMETHEE | Housing refurbishment contractor selection |
| 80 | Celik et al. (2009) | TFNs | AHP, FAD | Routing of shipping investment decisions in crude oil tanker market |
| 81 | Mousavi et al. (2008) | TFNs | TOPSIS | Bridge scheme selection |
| 82 | Su and Lin (2008) | TFNs | TRIZ | Service quality improvement |
| 83 | Wang et al. (2007) | TFNs | – | Customizing positioning of logistics service products of 3PLS |
| 84 | Kahraman et al. (2006) | TFNs | ANP, AHP | Improving product design and quality in a Turkish company producing PVC window and door systems |
| 85 | Hong and Wang (2005) | TFNs | – | Developing an integrated service strategy |
| 86 | Tsai et al. (2003) | TFNs | – | Enhancing manufacturing strategic planning |
| 87 | Sohn and Choi (2001) | TFNs | – | Supply chain management with reliability consideration |
| 88 | Verma et al. (1998) | TFNs | – | Facilitating strategic product planning, early design decision-making and parameter target setting |
Type of fuzzy sets abbreviations: Triangular Fuzzy Numbers (TFNs), Interval-Valued Triangular Fuzzy Numbers (IVTFNs), Trapezoidal Fuzzy Numbers (TpFNs), Interval Type-2 Fuzzy Numbers (IT2FNs), Intuitionistic Fuzzy Numbers (IFNs), Interval-Valued Intuitionistic Fuzzy Numbers (IVIFNs), Hesitant Fuzzy Numbers (HFNs), Interval-Valued Pythagorean Fuzzy Numbers (IVPFNs), Spherical Fuzzy Numbers (SFNs).
Integrated methods abbreviations: Analytic Hierarchy Process (AHP), Analytic Network Process (ANP), Choquet Integral Method (CIM), COmplex PRoportional ASsessment (COPRAS), Data Envelopment Analysis (DEA), Data Mining Methods (DMM), Decision Making Trial and Evaluation Laboratory (DEMATEL), Decision Tree (DT), Define-Measure-Analyze-Improve-Control (DMAIC), Delphi Method (DM), Design Structure Matrix (DSM), Evaluation Grid Method (EGM), Failure Mode and Effects Analysis (FMEA), Fuzzy Axiomatic Design (FAD), Fuzzy Delphi Method (FDM), Fuzzy Inference System (FIS), Grey Decision-Making Approach (GDM), Grey Relational Analysis (GRA), Group Decision Making Approach (GDM), Group-Organization Approach (GOA), Interpretive Structural Modelling (ISM), KANO, Machine Learning (ML), Mathematical Modelling (MM), Morphological Analysis Method (MAM), Multi-Objective Decision Model (MODM), Multi-Objective Goal Programming (MOGP), Multi-Objective Linear Programming Model (MOLPM), Multi-Phased 0-1 Optimization Model (MPOM), Multiple-Criteria Decision-Making (MCDM), Preference Ranking Organization METHod for Enrichment Evaluation (PROMETHEE), Principal Component Analysis (PCA), Rough Set Theory (RST), Service Quality (SERVQUAL), Structural Equation Modelling (SEM), Technique for Order of Preference by Similarity to Ideal Solution (TOPSIS), Theory of Inventive Problem Solving (TRIZ), Value Stream Mapping (VSM), VIekriterijumsko KOmpromisno Rangiranje (VIKOR).
In this section, we first present the preliminaries of single-valued intuitionistic fuzzy (SVIF) and IVIF sets with some of their arithmetic operations. Then, ordinary Z-fuzzy numbers are introduced. And finally, Chebyshev’s inequality-based interval-valued intuitionistic Z-fuzzy numbers are developed.
3.1Preliminaries
Definition 1.
Ordinary fuzzy sets are defined as in Eq. (1) (Zadeh, 1965):
(1)
Definition 2.
Intuitionistic fuzzy sets (IFSs) are defined as in Eq. (2) (Atanassov, 1986):
(2)
Definition 3.
The addition, multiplication of two SVIF numbers, multiplication by a scalar, and power operations on SVIF numbers are presented as in Eqs. (3)–(6), respectively (Atanassov, 1994):
(3)
(4)
(5)
(6)
Definition 4.
The score function of SVIF numbers is presented in Eq. (7) (Zhang et al., 2012):
(7)
Definition 5.
Let closed subintervals be represented by
(8)
The lower and upper end points are represented by the symbols
(9)
For any x, the hesitancy degree can be computed by Eq. (10):
(10)
Definition 6.
Let
(11)
3.2Classical Z-Fuzzy Numbers
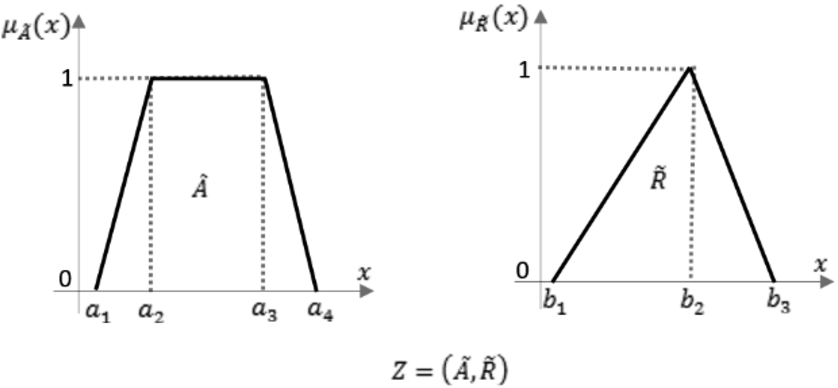
A Z-fuzzy number is defined by Zadeh (2011) as an ordered pair of fuzzy numbers,
A Z-fuzzy number can be defined as in Fig. 4.
Fig. 4
A Z-fuzzy number.
Definition 7.
The expected value of a fuzzy set is calculated as in Eq. (12) (Zadeh, 2011):
(12)
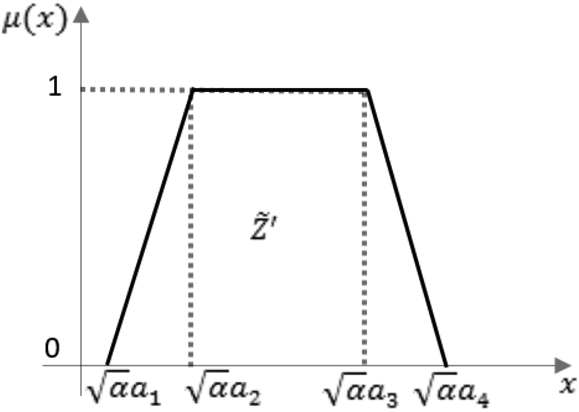
Definition 8.
Consider a Z-fuzzy number
The triangular fuzzy reliability function can be converted into a classical number by Eq. (13):
(13)
(14)
Fig. 5
Z-fuzzy number converted into a single ordinary fuzzy number.
In the next section, ordinary Z-fuzzy numbers will be extended by a new approach using Chebyshev’s inequality. In this approach, reliability component of the Z-fuzzy number is calculated more objectively based on Chebyshev’s probability terms.
3.3Chebyshev’s Inequality Based IV-Intuitionistic Z-Fuzzy Numbers
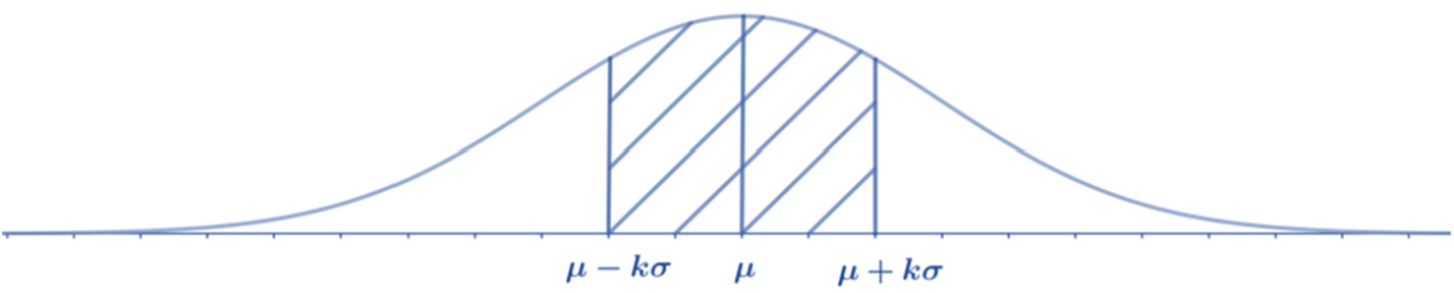
Chebyshev’s inequality provides the maximum probability between two points with a given mean and variance as illustrated in Fig. 6 when the distribution of the considered data is not known. Let’s assume that
Chebyshev’s inequality is given in Eq. (15):
(15)
Fig. 6
Chebyshev’s inequality.
Assume that n number of linguistic evaluations is given as
Next operation is to find k value in Eq. (15) in a way that the maximum reliability
(16)
(17)
(18)
(19)
(20)
(21)
4Intuitionistic Z-Fuzzy QFD Based on Chebyshev’s Inequality
In this section, we present our novel Chebyshev’s inequality based intuitionistic Z-fuzzy QFD approach. The proposed approach requires the number of experts to be
Phase 1 – CD&TD Relation Analysis
Step 1: Let
(22)
(23)
(24)
(25)
Step 2: Let the
(26)
(27)
(28)
(29)
Table 2
Linguistic and corresponding numerical scale for the weights of criteria.
| Linguistic term | IVIF number |
| Absolutely Low Importance (ALI) / Absolutely Low Satisfactory (ALS) / Absolutely Low Relation (ALR) / Absolutely Low Difficulty (SLD) | |
| Very Low Importance (VLI) / Very Low Satisfactory (VLS) / Very Low Relation (VLR) / Very Low Difficulty (VLD) | |
| Low Importance (LI) / Low Satisfactory (LS) / Low Relation (LR) / Low Difficulty (LD) | |
| Medium Low Importance (MLI) / Medium Low Satisfactory (MLS) / Medium Low Relation (MLR) / Medium Low Difficulty (MLD) | |
| Approximately Equal Importance (AEI) / Approximately Equal Satisfactory (AES) / Approximately Equal Relation (AER) / Approximately Equal Difficulty (AED) | |
| Medium High Importance (MHI) / Medium High Satisfactory (MHS) / Medium High Relation (MHR) / Medium High Difficulty (MHD) | |
| High Importance (HI) / High Satisfactory (HS) / High Relation (HR) / High Difficulty (HD) | |
| Very High Importance (VHI) / Very High Satisfactory (VHS) / Very High Relation (VHR) / Very High Difficulty (VHD) | |
| Absolutely High Importance (AHI) / Absolutely High Satisfactory (AHS) / Absolutely High Relation (CHR) / Absolutely High Difficulty (AHD) |
Step 3: Let the experts determine the level of technical difficulty of the TDs by using the scale given in Table 2. The weights of the experts are accepted to be the same as Step 2 and similar calculations are applied to find the aggregated SVIF values for each TDs’ technical difficulty as in Step 2.
Step 4: Construct the correlation matrix among TDs based on the IVIF scale presented in Table 3. In this matrix two types of correlations are considered: positive and negative. Positive correlations and negative correlations are indicated by PC and NC, respectively. PC means that two TDs move to the same direction whereas NC means that two TDs move to the opposite directions whenever the value of one of these two TDs is changed. When there exists no correlation, the cell includes no linguistic value in the correlation matrix. The differences between PCs and NCs are obtained by Eq. (31).
Step 5: Obtain the Chebyshev’s inequality-based absolute priority degree
(30)
(31)
Table 3
IVIF correlation scale.
| Linguistic term for positive or negative correlations | IVIF number |
| Absolutely Low Positive Correlation (ALPC) or Absolutely Low Negative Correlation (ALNC) | |
| Very Low Positive Correlation (VLPC) or Very Low Negative Correlation (VLNC) | |
| Low Positive Correlation (LPC) or Low Negative Correlation (LNC) | |
| Medium Low Positive Correlation (MLPC) or Medium Low Negative Correlation (MLNC) | |
| Approximately Equal Positive Correlation (AEPC) or Approximately Equal Negative Correlation (AENC) | |
| Medium High Positive Correlation (MHPC) or Medium High Negative Correlation (MHNC) | |
| High Positive Correlation (HPC) or High Negative Correlation (HNC) | |
| Very High Positive Correlation (VHPC) or Very High Negative Correlation (VHNC) | |
| Absolutely High Positive Correlation (AHPC) or Absolutely High Negative Correlation (AHNC) |
Relative technical difficulty
(32)
Fuzzy relative absolute priority (
(33)
Step 6: Rank the TDs regarding their
Phase 2 – Competitive Analysis
Step 7: Determine the customers’ linguistic assessments for the competitive analysis through CDs assigned by
(34)
(35)
(36)
Step 8: Find the linguistic customer assessments of the competitive analysis through TDs assigned by
(37)
(38)
(39)
Step 9: Calculate our company’s combined performance rating score (
(40)
Step 10: Find the location of our company relative to the other competitive firms as in Fig. 7. Larger positive distance between our company and
Fig. 7
Scale to indicate the position of our company.

Table 4
Indicators.
| Our company | Distance between |
| Better than | Positive |
| Worse than | Negative |
| Equal to | Zero |
5Application: Hand Sanitizer Design and Development
COVID-19 is a contagious disease, first identified in China, in December 2019 and has since spread worldwide, leading to an ongoing pandemic. Centres for Disease Control and Prevention recommend washing the hands with soap and water for at least 20 seconds to prevent the spread of the virus and minimize the risk of getting infected. However, in many cases especially at public places, they are mostly not available. In such situations, hand sanitizers with at least 60% of alcohol are the most suggested solutions. Hand sanitizers (Fig. 8) are generally liquid, gel or foam form of agents applied on the hands to remove viruses/bacteria/microorganisms.
Fig. 8
Hand sanitizer representation.

In this section an application on hand sanitizer design and development will be presented in steps to illustrate the proposed novel intuitionistic Z-fuzzy QFD approach based on Chebyshev’s inequality.
To determine the CDs for hand sanitizer, a questionnaire was designed to ask their expectations from this product. This questionnaire was distributed to the e-mail addresses of the customers of one of the largest markets in İstanbul. The total number of the customers was 2078 and 219 of them replied. Based on these responses, the following CDs from a hand sanitizer product were determined: Easy storage, compact package, nice smell, fast absorption and/or drying, moisturizing formula, aesthetic design, powerful formula, environmentally friendly and cruelty free, easy and convenient use, and no hard chemicals. After determining these CDs from the customers, we gathered a small focus group to interview and discuss with them the importance degrees of these CDs. Then we asked a chemical cleaning supplies producer in İstanbul how these CDs can be met by which TDs. The producer firm determined the following TDs: Active ingredients, hazardous ingredients, colour, fragrance, package design, and compliance with laws. The relations between these CDs and TDs can be seen in Table 8.
Now the steps of the proposed intuitionistic Z-fuzzy QFD approach based on Chebyshev’s inequality will be given in details in the following.
Phase 1 – CD&TD Relation Analysis
Step 1: Linguistic CDs are defined, and linguistic customer evaluations are assigned by three customers using the scale in Table 2. Customers’ weights are assigned to be
Table 5
Scale for experience level of customers and experts.
| Degree of experience | Corresponding numerical score |
| Very experienced | 3 |
| Quite experienced | 2 |
| Slightly experienced | 1 |
Table 6
CDs, linguistic customer evaluations, and aggregated SVIF values.
| Customer demands | Linguistic customers evaluations | Aggregated SVIF customer evaluations |
| Easy storage, compact package | HI, AEI, LI | (0.37, 0.31) |
| Nice smell | MLI, VHI, AEI | (0.36, 0.32) |
| Fast absorption and/or drying | AHI, HI, MHI | (0.47, 0.19) |
| Moisturizing formula | AHI, MHI, HI | (0.46, 0.20) |
| Aesthetic design | VLI, AEI, VHI | (0.23, 0.35) |
| Powerful formula | VHI, VHI, AHI | (0.53, 0.24) |
| Environmentally friendly and cruelty free | VLI, MHI, HI | (0.25, 0.26) |
| Easy and convenient use | LI, AEI, HI | (0.31, 0.27) |
| No hard chemicals | MHI, AHI, HI | (0.44, 0.22) |
To have a better understanding with the calculations, a sample calculation is given in Table 7 showing the aggregation operation for the customer demand “Easy Storage, Compact Package” evaluated by three customers.
Step 2: TDs are defined by three experts where their weights are
Table 7
Sample calculations of linguistic CD translation into SVIF value.
| HI | 0.6 | 0.7 | 0.2 | 0.3 | ||||
| AEI | 0.4 | 0.5 | 0.4 | 0.5 | ||||
| LI | 0.2 | 0.3 | 0.6 | 0.7 | ||||
| Weighted average | 0.57 | 0.33 | 0.43 | |||||
| Weighted standard deviation | 0.18 | 0.18 | 0.18 | |||||
| 2.6 | 2.4 | 1.85 | 2.4 | |||||
| Lower limit of Chebyshev’s inequality | 0.14 | 0.00 | 0.00 | |||||
| Upper limit of Chebyshev’s inequality | 1.00 | 0.67 | 0.86 | |||||
| Maximum reliability level | 0.83 | 0.71 | 0.83 | |||||
| IVIF intervals | 0.11 | 0.82 | 0.00 | 0.47 | 0.00 | 0.71 | ||
| Aggregated SVIF CD | 0.31 | |||||||
k values are found by trial-and-error and interpolation methods.
Table 8
Linguistic relationship matrix between CDs and TDs, and their aggregated SVIF correspondences.
| Technical descriptors ∖Customerdemands | Active ingredients | Hazardous ingredients | Colour | Fragrance | Package design | Compliance with laws |
| Easy storage, compact package | AHR, AHR, VHR | |||||
| (0.57, 0.16) | ||||||
| Nice smell | LR, VLR, VLR | ALR, VLR, ALR | AHR, AHR, VHR | |||
| (0.26, 0.51) | (0.21, 0.54) | (0.57, 0.16) | ||||
| Fast absorption and/or drying | AHR, VHR, HR | ALR, LR, AER | ||||
| (0.51, 0.24) | (0.23, 0.42) | |||||
| Moisturizing formula | HR, MHR, VHR | ALR, LR, VLR | ||||
| (0.44, 0.28) | (0.24, 0.48) | |||||
| Aesthetic design | HR, MHR, MLR | VHR, AHR, AHR | ||||
| (0.38, 0.30) | (0.56, 0.19) | |||||
| Powerful formula | AHR, HR, VHR | AER, MLR, MHR | HR, MHR, HR | |||
| (0.48, 0.23) | (0.37, 0.40) | (0.44, 0.31) | ||||
| Environmentally friendly and cruelty free | AER, HR, VHR | AER, VHR, AHR | VHR, AHR, HR | |||
| (0.39, 0.28) | (0.40, 0.22) | (0.50, 0.22) | ||||
| Easy and convenient use | AHR, VHR, AHR | |||||
| (0.54, 0.20) | ||||||
| No hard chemicals | LR, AER, MLR | VHR, AHR, VHR | LR, MLR, VLR | HR, AER, VHR | ||
| (0.31, 0.41) | (0.53, 0.21) | (0.28, 0.45) | (0.42, 0.27) |
To have a better understanding with the calculations, a sample calculation is given in Table 9 showing the aggregation operation for the relation between the CD “Nice Smell” and the TD “Active Ingredients” evaluated by three experts.
Step 3: The level of technical difficulty of the TDs are determined by using the scale given in Table 2 by the three experts. The weights are accepted to be the same as in Step 2 and similar calculations are applied to find the aggregated SVIF numbers for each TDs’ technical difficulty. Table 10 shows the linguistic technical difficulty of each TD and their corresponding aggregated SVIF value.
Table 9
Sample calculation of linguistic TD’s translation into SVIF value.
| LR | 0.2 | 0.3 | 0.6 | 0.7 | ||||
| VLR | 0.1 | 0.2 | 0.7 | 0.8 | ||||
| VLR | 0.1 | 0.2 | 0.7 | 0.8 | ||||
| Weighted average | 0.23 | 0.68 | 0.78 | |||||
| Weighted standard deviation | 0.05 | 0.05 | 0.05 | |||||
| k | 2.4 | 4.3 | 6.2 | 4.3 | ||||
| Lower limit of Chebyshev’s inequality | 0.00 | 0.35 | 0.55 | |||||
| Upper limit of Chebyshev’s inequality | 0.45 | 1.00 | 1.00 | |||||
| Maximum reliability level | 0.95 | 0.97 | 0.95 | |||||
| IVIF intervals | 0.00 | 0.43 | 0.34 | 0.98 | 0.52 | 0.95 | ||
| Aggregated SVIF CD | 0.51 | |||||||
k values are found by trial-and-error and interpolation methods.
Step 4: The linguistic correlation matrix among TDs is constructed by the experts as given in Fig. 9 by using the scale given in Table 2. In this way the directions of the correlations which can be positive or negative have been determined. These directions of improvements are represented with “+” and “−” signs to show whether the TD is needed to be increased or decreased, respectively. In Fig. 9, each cell shows three assessments from three experts. The blank cells in Fig. 9 indicate no correlation between the considered two TDs.
Table 10
Linguistic technical difficulties of TDs and their aggregated SVIF correspondences.
| Technical descriptors | Active ingredients | Hazardous ingredients | Colour | Fragrance | Package design | Compliance with laws |
| Linguistic technical difficulty | AHD, VHD, AHD | VHD, AHD, AHD | ALD, VLD, ALD | AED, MLD, MHD | AED, MLD, MHD | HD, MHD, VHD |
| Aggregated SVIF technical difficulty | (0.54, 0.20) | (0.56, 0.19) | (0.21, 0.54) | (0.37, 0.40) | (0.23, 0.44) | (0.44, 0.28) |
Step 5: We obtained the Chebyshev’s inequality based absolute priority degrees for each TD by using Eq. (30) as given in Table 11.
Fig. 9
Linguistic and SVIF correlation matrices.
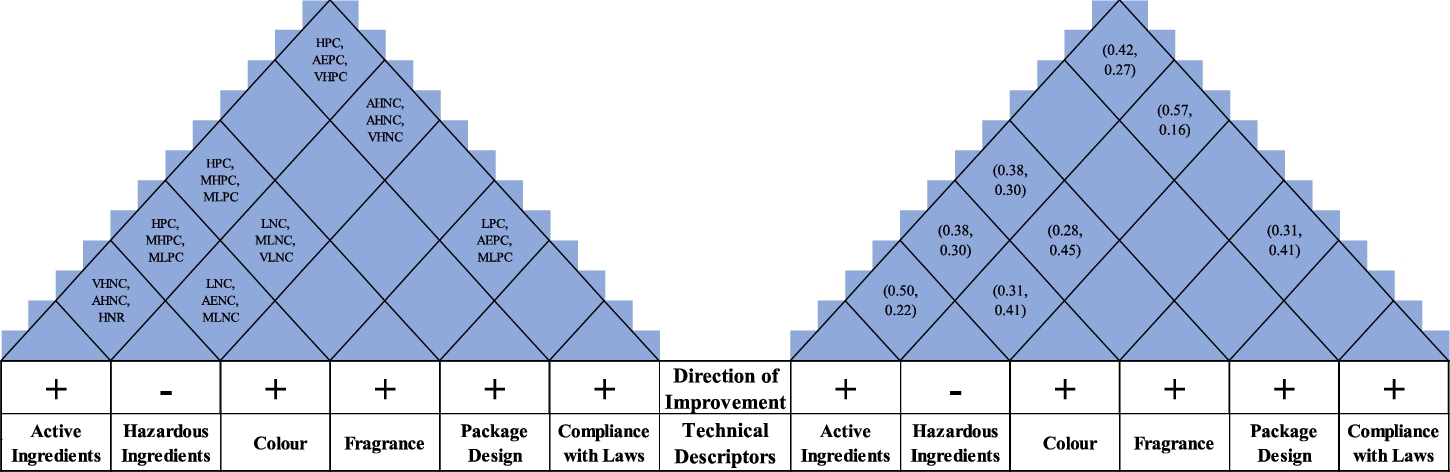
Table 11
Absolute priorities of TDs.
| Active ingredients | Hazardous ingredients | Colour | Fragrance | Package design | Compliance with laws | |
| Absolute priority | 0.50 | 0.30 | 0.34 | 0.44 | 0.37 | 0.43 |
To better explain this step, a sample calculation is given below for TD “active ingredients”.
First, we multiplied each SVIF customer evaluation value with the corresponding cell in the relation matrix for TD “active ingredients” by using Eq. (4) and then summed these values up by using Eq. (3). Results are shown in Table 12. We added up each SVIF value separately to the summation of the previous ones by applying Eq. (3) successively. The summation result is found to be (0.68, 0.01). Next, we defuzzified this value with Eq. (7) and the result is found as 0.76, where
Table 12
Results of SVIF multiplication of customer evaluations by relation matrix of Active Ingredients.
| Customer demands | SVIF customer evaluations | SVIF relation matrix of active ingredients | Multiplied SVIF values |
| Easy storage, compact package | (0.37, 0.31) | ||
| Nice smell | (0.36, 0.32) | (0.26, 0.51) | (0.09, 0.67) |
| Fast absorption and/or drying | (0.47, 0.19) | (0.51, 0.24) | (0.24, 0.38) |
| Moisturizing formula | (0.46, 0.20) | (0.44, 0.28) | (0.20, 0.42) |
| Aesthetic design | (0.23, 0.35) | ||
| Powerful formula | (0.53, 0.24) | (0.48, 0.23) | (0.25, 0.41) |
| Environmentally friendly and cruelty free | (0.25, 0.26) | (0.39, 0.28) | (0.10, 0.47) |
| Easy and convenient use | (0.31, 0.27) | ||
| No hard chemicals | (0.44, 0.22) | (0.31, 0.41) | (0.14, 0.63) |
| Total | (0.68, 0.01) |
Next, to find the correlation correction factor for TD “active ingredients”, first we defuzzified the SVIF correlation values. Then applied Eq. (31) as
Finally, we applied Eq. (30) as follows:
Step 6: We calculated the relative absolute priorities by using Eq. (33) as shown in Table 13. The TD with the highest relative absolute priority is found as TD “Active Ingredients” with RAP= 0.21 which means that it needs to be taken into consideration promptly by the product developers.
Phase 2- Competitive Analysis
Table 13
Relative absolute priorities of TDs.
| Active Ingredients | Hazardous Ingredients | Colour | Fragrance | Package Design | Compliance with laws | |
| Relative absolute priority | 0.21 | 0.13 | 0.14 | 0.18 | 0.16 | 0.18 |
Step 7: First, we collected the linguistic customer assessments for the competitive analysis through CDs assigned by three customers using the IVIF scale given in Table 2. Their linguistic assessments are shown in Fig. 11 and their corresponding aggregated SVIF values are given in Fig. 12. Next, to determine our company’s position among the competitors, we applied Eq. (34) and the results of the computations are given in Table 14. The scores of SVIF customers’ assessments are found by Eq. (7).
Table 14
Results of competitive analysis through CDs.
| CDs | Score of O | Score of | Score of | |||||||
| Easy storage, compact package | 0.62 | 0.45 | 0.60 | 1 | 1 | 0.44 | 0.41 | 0.52 | 0.23 | 0.22 |
| Nice smell | 0.49 | 0.40 | 0.55 | 1 | −1 | 0.41 | 0.39 | 0.52 | 0.21 | −0.20 |
| Fast absorption and/or drying | 0.45 | 0.43 | 0.62 | 1 | −1 | 0.41 | 0.44 | 0.60 | 0.25 | −0.26 |
| Moisturizing formula | 0.60 | 0.60 | 0.50 | 0 | 1 | 0.43 | 0.45 | 0.60 | 0.00 | 0.27 |
| Aesthetic design | 0.45 | 0.62 | 0.49 | −1 | −1 | 0.45 | 0.39 | 0.46 | −0.21 | −0.18 |
| Powerful formula | 0.60 | 0.50 | 0.60 | 1 | 0 | 0.48 | 0.43 | 0.62 | 0.30 | 0.00 |
| Environmentally friendly and cruelty free | 0.62 | 0.45 | 0.43 | 1 | 1 | 0.44 | 0.45 | 0.50 | 0.22 | 0.22 |
| Easy and convenient use | 0.40 | 0.45 | 0.62 | −1 | −1 | 0.47 | 0.50 | 0.51 | −0.24 | −0.26 |
| No hard chemicals | 0.60 | 0.62 | 0.49 | −1 | 1 | 0.41 | 0.42 | 0.58 | −0.24 | 0.24 |
| Total | 0.52 | 0.05 |
In order to better explain the operations used in this table, a sample calculation is presented below for CD “Easy Storage, Compact Package”.
Step 8: First, we collected the experts’ linguistic assessments for the competitive analysis through TDs assigned by three experts using the IVIF scale given in Table 2. Their linguistic assessments are shown in Fig. 11 and their corresponding aggregated SVIF values are given in Fig. 12. Next, to determine our company’s position among the competitors, we applied Eq. (37) and the results of the computations are given in Table 15. The scores of SVIF experts’ assessments are found by Eq. (7).
Table 15
Results of competitive analysis through TDs.
| TDs | Score of O | Score of | Score of | |||||||
| Active ingredients | 0.56 | 0.50 | 0.57 | 1 | −1 | 0.41 | 0.45 | 0.50 | 0.21 | −0.23 |
| Hazardous ingredients | 0.42 | 0.52 | 0.41 | −1 | 1 | 0.48 | 0.50 | 0.30 | −0.15 | 0.15 |
| Colour | 0.56 | 0.53 | 0.48 | 1 | 1 | 0.48 | 0.44 | 0.34 | 0.16 | 0.15 |
| Fragrance | 0.57 | 0.47 | 0.52 | 1 | 1 | 0.46 | 0.49 | 0.44 | 0.20 | 0.21 |
| Package design | 0.41 | 0.42 | 0.50 | −1 | −1 | 0.50 | 0.49 | 0.37 | −0.19 | −0.18 |
| Compliance with laws | 0.40 | 0.48 | 0.56 | −1 | −1 | 0.35 | 0.46 | 0.43 | −0.15 | −0.20 |
| Total | 0.08 | −0.09 |
In order to better understand the operations used in this table, a sample calculation is presented below for TD “Active Ingredients”.
Step 9: We obtained the combined performance rating score (
Step 10: We determined the relative position of our company on a scale as in Fig. 10. Since
Fig. 10
Scale indicating the location of our company.

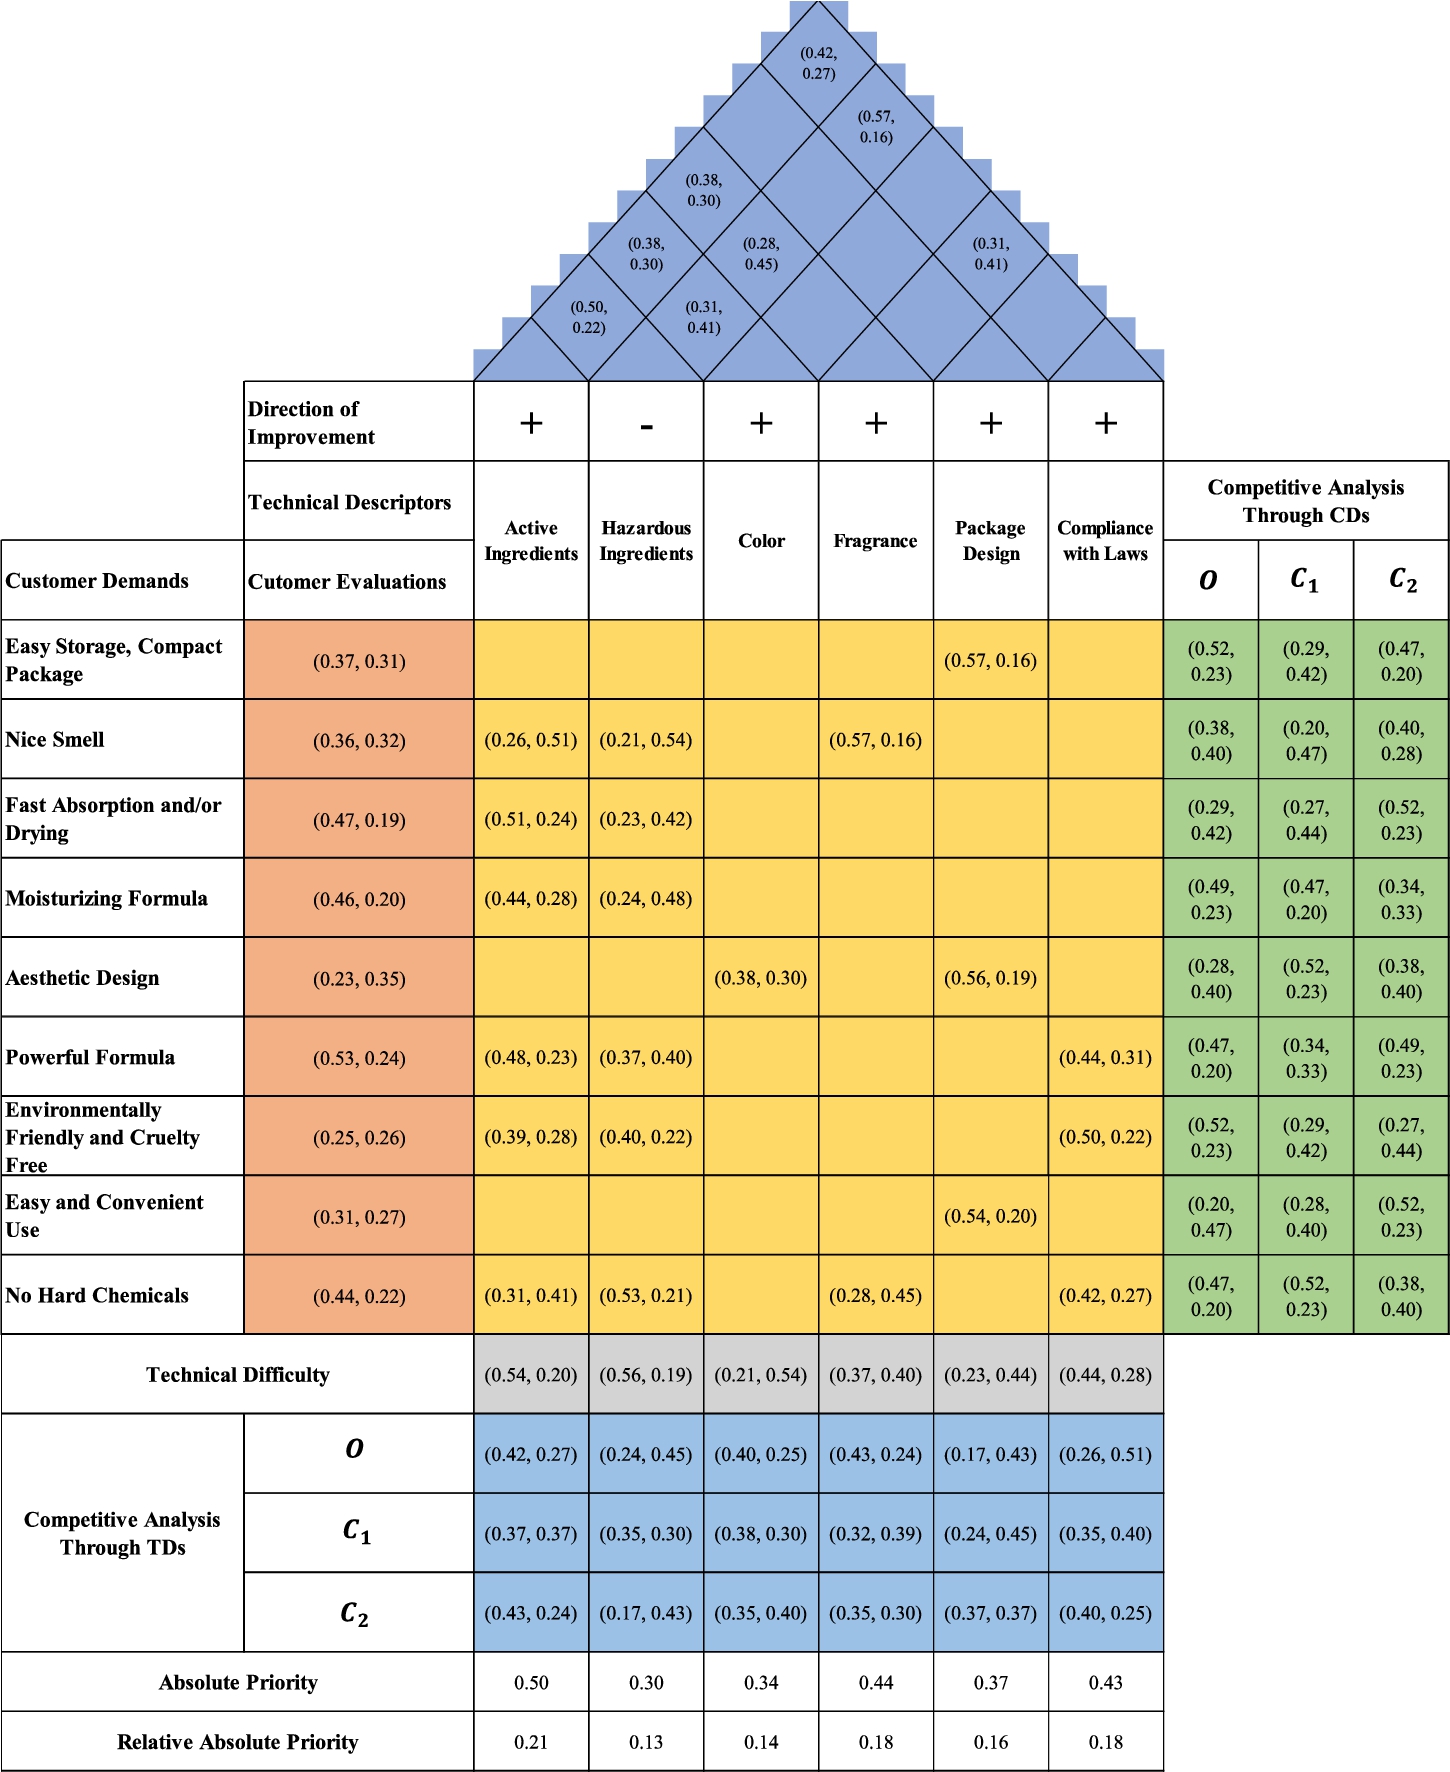
As mentioned above, the whole linguistic HOQ matrix and the whole aggregated SVIF HOQ matrix are given in Figs. 11 and 12, respectively.
Fig. 11
Linguistic HOQ.
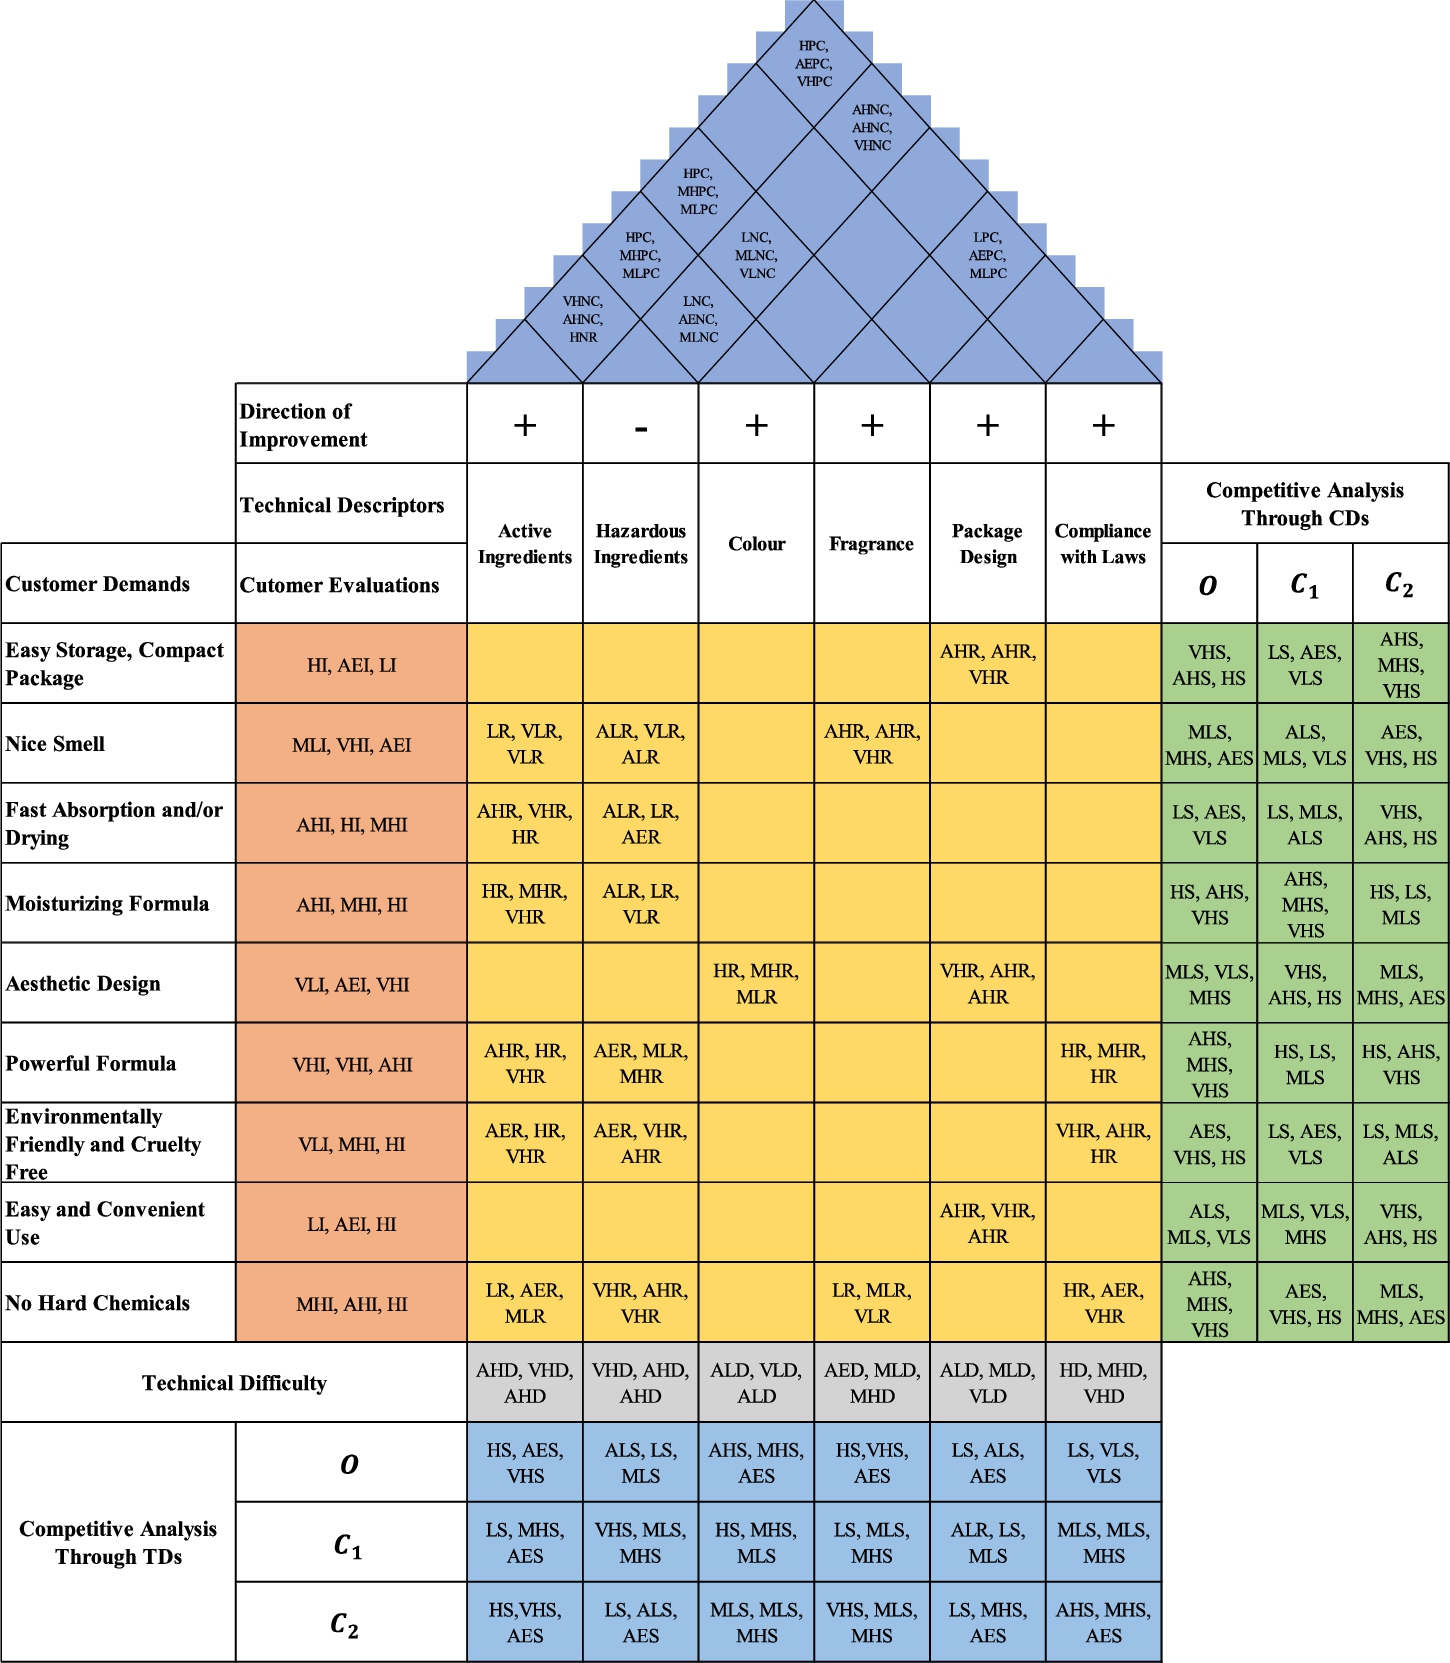
Fig. 12
Aggregated SVIF HOQ.
6Conclusion
In the literature, the QFD approach has been an effective tool to incorporate customer voice into product design and development. The voice of customer is often included in the QFD approach in linguistic expressions that contain a certain degree of ambiguity. It has been seen that this uncertainty has been modelled mostly with the help of fuzzy sets in the literature. More than ten extensions of ordinary fuzzy sets have been proposed to the literature, each aiming to model human thoughts in a more detailed and accurate way through membership functions. Our review revealed that the most used extension in QFD approach is intuitionistic fuzzy sets and the most often integrated decision-making tool is AHP method. In most of the QFD studies the reliability to the assigned fuzzy values of QFD parameters are not considered. The purpose of this study was to develop a novel approach integrating the reliability with the assigned fuzzy values of QFD method based on the principles of the probability theory. The contribution of our method to the literature is the presentation of a new reliability integrated QFD approach under intuitionistic fuzziness with all its aspects such as technical difficulty, competitive analysis through CDs and TDs. Intuitionistic Z-fuzzy numbers have been developed and successfully applied to represent the uncertainty in linguistic terms of CDs and TDs. Chebyshev’s inequality allowed us to objectively obtain the degree of reliability of the restriction function, which is subjectively determined in the previous studies. This study also proposed a model that successfully integrates parts of the QFD approach that are often considered separately in the literature. This model comprehensively integrated customer evaluations, relationship matrix, correlation matrix, and technical difficulties of TDs, to calculate the absolute priority degrees of TDs. One limitation of our study is that IVIF division and subtraction operations are not precisely defined in the literature which forces us to use defuzzification when these operations are needed.
For further research we suggest IVPF, IVSF or IVPiF sets to be used in our model instead of IVIF sets. Besides, aggregation operators can be differentiated by using intuitionistic fuzzy Einstein aggregation operators such as the intuitionistic fuzzy Einstein weighted geometric (IFEWG) operator, or the intuitionistic fuzzy Einstein ordered weighted geometric (IFEOWG) operator. Alternatively, the linguistic intuitionistic fuzzy weighted partitioned Heronian mean (LIFWPHM) operator or the linguistic intuitionistic fuzzy partitioned geometric Heronian mean (LIFPGHM) operator can be used.
References
1 | Akbaş, H., Bilgen, B. ((2017) ). An integrated fuzzy QFD and TOPSIS methodology for choosing the ideal gas fuel at WWTPs. Energy, 125: , 484–497. |
2 | Amaladhasan, S., Parthiban, P., Dhanalakshmi, R. ((2018) ). Analysis and prioritisation of eco drivers in supply Chain. International Journal of Logistics Systems and Management, 31: (3), 336–362. |
3 | Aouag, H., Soltani, M., Mouss, M.D. ((2020) ). Enhancement of value stream mapping application process through using fuzzy DEMATEL and fuzzy QFD approaches: a case study considering economic and environmental perspectives. Journal of Modelling in Management. 16: (3), 1002–1023. |
4 | Atanassov, K.T. ((1986) ). Intuitionistic fuzzy sets. Fuzzy Sets and Systems, 20: (1), 87–96. |
5 | Atanassov, K.T. ((1994) ). New operations defined over the intuitionistic fuzzy sets. Fuzzy Sets Syst, 61: , 137–142. |
6 | Atanassov, K.T. ((2020) ). Circular intuitionistic fuzzy sets. Journal of Intelligent and Fuzzy Systems, 39: (5), 5981–5986. |
7 | Babbar, C., Amin, S.H. ((2018) ). A multi-objective mathematical model integrating environmental concerns for supplier selection and order allocation based on fuzzy QFD in beverages industry. Expert Systems with Applications, 92: , 27–38. |
8 | Baskar, C., Parameshwaran, R., Nithyavathy, N. ((2020) ). Implementation of fuzzy-based integrated framework for sesame seed separator development. Soft Computing, 24: (10), 7715–7734. |
9 | Beheshtinia, M.A., Farzaneh Azad, M. ((2019) ). A fuzzy QFD approach using SERVQUAL and kano models under budget constraint for hotel services. Total Quality Management and Business Excellence, 30: (7–8), 808–830. |
10 | Bevilacqua, M., Ciarapica, F.E., Marchetti, B. ((2012) ). Development and test of a new fuzzy-QFD approach for characterizing customers rating of extra virgin olive oil. Food Quality and Preference, 24: (1), 75–84. |
11 | Bhuvanesh Kumar, M., Parameshwaran, R. ((2018) ). Fuzzy integrated QFD, FMEA framework for the selection of lean tools in a manufacturing organisation. Production Planning and Control, 29: (5), 403–417. |
12 | Bhuvanesh Kumar, M., Parameshwaran, R. ((2020) ). A comprehensive model to prioritize lean tools for manufacturing industries: a fuzzy FMEA, AHP and QFD-based approach. International Journal of Services and Operations Management, 37: (2), 170–196. |
13 | Bilişik, Ö.N., Şeker, Ş., Aydın, N., Güngör, N., Baraçlı, H. ((2019) ). Passenger satisfaction evaluation of public transportation in İstanbul by using fuzzy quality function deployment methodology. Arabian Journal for Science and Engineering, 44: (3), 2811–2824. |
14 | Büyüközkan, G., Güleryüz, S. ((2015) ). Extending fuzzy QFD methodology with GDM approaches: An application for IT planning in collaborative product development. International Journal of Fuzzy Systems, 17: (4), 544–558. |
15 | Büyüközkan, G., Uztürk, D. ((2020) ). Smart fridge design with interval-valued intuitionistic fuzzy QFD. Advances in Intelligent Systems and Computing, 1029: , 1170–1179. |
16 | Büyüközkan, G., Güler, M., Mukul, E. ((2020) ). An integrated fuzzy QFD methodology for customer oriented multifunctional power bank design. Studies in Systems, Decision and Control, 279: , 73–91. |
17 | Celik, M., Cebi, S., Kahraman, C., Er, I.D. ((2009) ). An integrated fuzzy QFD model proposal on routing of shipping investment decisions in crude oil tanker market. Expert Systems with Applications, 36: (3 PART 2), 6227–6235. |
18 | Chang, W. ((2012) ). A new perspective on EFL teaching: applying fuzzy QFD in TRIZ for teaching quality improvement. International Journal of Systematic Innovation, 2: (2), 43–53. |
19 | Chen, R. ((2016) ). Green design quality management in industrial Chain using fuzzy decision tree and QFD. International Journal of Productivity and Quality Management, 19: (3), 345–365. |
20 | Chen, C., Huang, S. ((2011) ). Implementing KM programmes using fuzzy QFD. Total Quality Management and Business Excellence, 22: (4), 387–406. |
21 | Chiadamrong, N., Tham, T.T. ((2017) ). An integrated approach with SEM, fuzzy-QFD and MLP for supply chain management strategy development. International Journal of Logistics Systems and Management, 28: (1), 84–125. |
22 | Chowdhury, M.M.H., Quaddus, M.A. ((2016) ). A multi-phased QFD based optimization approach to sustainable service design. International Journal of Production Economics, 171: , 165–178. |
23 | Cuong, B. ((2015) ). Picture fuzzy sets. Journal of Computer Science and Cybernetics, 30: (4), 409. |
24 | Çevik Onar, S., Büyüközkan, G., Öztayşi, B., Kahraman, C. ((2016) ). A new hesitant fuzzy QFD approach: an application to computer workstation selection. Applied Soft Computing Journal, 46: , 1–16. |
25 | Dat, L.Q., Phuong, T.T., Kao, H., Chou, S., Nghia, P.V. ((2015) ). A new integrated fuzzy QFD approach for market segments evaluation and selection. Applied Mathematical Modelling, 39: (13), 3653–3665. |
26 | De Almeida, M.F.L., Silva Da Luz, C.E., De Andrade Martins, G. ((2018) ). Fuzzy quality function deployment (fuzzy-QFD) applied to new defense product development. Paper presented at the Towards Sustainable Technologies and Innovation. In: Proceedings of the 27th Annual Conference of the International Association for Management of Technology, IAMOT 2018. |
27 | Deveci, M., Öner, S.C., Canıtez, F., Öner, M. ((2019) ). Evaluation of service quality in public bus transportation using interval-valued intuitionistic fuzzy QFD methodology. Research in Transportation Business and Management, 33: , 100387. |
28 | Efe, B., Yerlikaya, M.A., Efe, Ö.F. ((2020) ). Mobile phone selection based on a novel quality function deployment approach. Soft Computing, 24: (20), 15447–15461. |
29 | Fan, J., Yu, S., Yu, M., Chu, J., Tian, B., Li, W., Chen, C. ((2020) ). Optimal selection of design scheme in cloud environment: a novel hybrid approach of multi-criteria decision-making based on F-ANP and F-QFD. Journal of Intelligent and Fuzzy Systems, 38: (3), 3371–3388. |
30 | Fitriana, R., Kurniawan, W., Anwar, M.R. ((2019) ). Measurement and proposal of improving marketing process to improve the quality of aftersales services with fuzzy quality function deployment and data mining methods in OV agency. IOP Conference Series: Materials Science and Engineering, 528: (1), 012072. |
31 | Hakim, A., Gheitasi, M., Soltani, F. ((2016) ). Fuzzy model on selecting processes in business process reengineering. Business Process Management Journal, 22: (6), 1118–1138. |
32 | Haktanır, E. ((2020) ). Prioritization of competitive suppliers using an interval-valued Pythagorean fuzzy QFD & COPRAS methodology. Journal of Multiple-Valued Logic & Soft Computing, 34: (1/2), 177–199. |
33 | Haktanır, E., Kahraman, C. ((2019) ). A novel interval-valued Pythagorean fuzzy QFD method and its application to solar photovoltaic technology development. Computers and Industrial Engineering, 132: , 361–372. |
34 | Haktanır, E., Kahraman, C., Kutlu Gündoğdu, F. ((2021) ). Delivery drone design using spherical fuzzy quality function deployment. Studies in Fuzziness and Soft Computing, 392: , 399–430. |
35 | Haq, A.N., Boddu, V. ((2017) ). Analysis of enablers for the implementation of leagile supply chain management using an integrated fuzzy QFD approach. Journal of Intelligent Manufacturing, 28: (1), 1–12. |
36 | Hong, W., Wang, H. ((2005) ). Fuzzy QFD approach to developing an integrated service strategy. International Journal of Fuzzy Systems, 7: (3), 120–132. |
37 | Jafarzadeh, H., Akbari, P., Abedin, B. ((2018) ). A methodology for project portfolio selection under criteria prioritisation, uncertainty and projects interdependency – combination of fuzzy QFD and DEA. Expert Systems with Applications, 110: , 237–249. |
38 | Jamalnia, A., Mahdiraji, H.A., Sadeghi, M.R., Hajiagha, S.H.R., Feili, A. ((2014) ). An integrated fuzzy QFD and fuzzy goal programming approach for global facility location-allocation problem. International Journal of Information Technology and Decision Making, 13: (2), 263–290. |
39 | Juan, Y., Perng, Y., Castro-Lacouture, D., Lu, K. ((2009) ). Housing refurbishment contractors selection based on a hybrid fuzzy-QFD approach. Automation in Construction, 18: (2), 139–144. |
40 | Kahraman, C., Ertay, T., Büyüközkan, G. ((2006) ). A fuzzy optimization model for QFD planning process using analytic network approach. European Journal of Operational Research, 171: (2), 390–411. |
41 | Kang, X. ((2020) ). Aesthetic product design combining with rough set theory and fuzzy quality function deployment. Journal of Intelligent and Fuzzy Systems, 39: (1), 1131–1146. |
42 | Kang, X., Yang, M., Wu, Y., Ni, B. ((2018) ). Integrating evaluation grid method and fuzzy quality function deployment to new product development. Mathematical Problems in Engineering, 2018: , 2451470. |
43 | Karasan, A., Kahraman, C. ((2019) ). A novel intuitionistic fuzzy DEMATEL – ANP – TOPSIS integrated methodology for freight village location selection. Journal of Intelligent & Fuzzy Systems, 36: , 1335–1352. |
44 | Kavosi, M., Mavi, R.K. ((2011) ). Fuzzy quality function deployment approach using TOPSIS and analytic hierarchy process methods. International Journal of Productivity and Quality Management, 7: (3), 304–324. |
45 | Kayapınar, S., Erginel, N. ((2019) ). Designing the airport service with fuzzy QFD based on SERVQUAL integrated with a fuzzy multi-objective decision model. Total Quality Management and Business Excellence, 30: (13–14), 1429–1448. |
46 | Keshteli, R.N., Davoodvandi, E. ((2017) ). Using fuzzy AHP and fuzzy TOPSIS in fuzzy QFD: a case study in ceramic and tile industry of Iran. International Journal of Productivity and Quality Management, 20: (2), 197–216. |
47 | Khademi-Zare, H., Zarei, M., Sadeghieh, A., Saleh Owlia, M. ((2010) ). Ranking the strategic actions of Iran mobile cellular telecommunication using two models of fuzzy QFD. Telecommunications Policy, 34: (11), 747–759. |
48 | Kutlu Gündoğdu, F., Kahraman, C. ((2019) ). Spherical fuzzy sets and spherical fuzzy TOPSIS method. Journal of Intelligent and Fuzzy Systems, 36: (1), 337–352. |
49 | Kutlu Gündoğdu, F., Kahraman, C. ((2020) ). A novel spherical fuzzy QFD method and its application to the linear delta robot technology development. Engineering Applications of Artificial Intelligence, 87: , 103348. |
50 | Lee, G.H., Park, S.H. ((2021) ). Fuzzy QFD-based prioritization of work activities of construction for safety. ICIC Express Letters, Part B: Applications, 12: (1), 1–8. |
51 | Lee, Z., Pai, C., Yang, C. ((2012) ). Customer needs and technology analysis in new product development via fuzzy QFD and Delphi. WSEAS Transactions on Business and Economics, 9: (1), 1–15. |
52 | Li, S., Tang, D., Wang, Q., Zhu, H. ((2020) ). Analysis and extraction of consumer information for the evaluation of design requirement depending on consumer involvement. Mechanisms and Machine Science, 77: , 342–353. |
53 | Liu, A., Hu, H., Zhang, X., Lei, D. ((2017) ). Novel two-phase approach for process optimization of customer collaborative design based on fuzzy-QFD and DSM. IEEE Transactions on Engineering Management, 64: (2), 193–207. |
54 | Liu, H. ((2009) ). The extension of fuzzy QFD: From product planning to part deployment. Expert Systems with Applications, 36: (8), 11131–11144. |
55 | Liu, S., Zhang, Y., Lai, Y., Wang, M. ((2018) ). A novel method of design elements based on EGM and fuzzy QFD. International Journal of Product Development, 22: (5), 408–420. |
56 | Lu, C., Lin, L., Yeh, H. ((2019) ). A multi-phased FQFD for the design of brand revitalisation. Total Quality Management and Business Excellence, 30: (7–8), 848–871. |
57 | Ma, H., Chu, X., Li, Y. ((2019) a). An integrated approach to identify function components for product redesign based on analysis of customer requirements and failure risk. Journal of Intelligent and Fuzzy Systems, 36: (2), 1743–1757. |
58 | Ma, H., Chu, X., Xue, D., Chen, D. ((2019) b). Identification of to-be-improved components for redesign of complex products and systems based on fuzzy QFD and FMEA. Journal of Intelligent Manufacturing, 30: (2), 623–639. |
59 | Milunovic Koprivica, S., Filipovic, J. ((2018) ). Application of traditional and fuzzy quality function deployment in the product development process. Engineering Management Journal, 30: (2), 98–107. |
60 | Mohanraj, R., Sakthivel, M., Vinodh, S., Vimal, K.E.K. ((2015) ). A framework for VSM integrated with fuzzy QFD. TQM Journal, 27: (5), 616–632. |
61 | Mousavi, S.M., Malekly, H., Hashemi, H., Mojtahedi, S.M.H. ((2008) ). A two-phase fuzzy decision making methodology for bridge scheme selection. In: 2008 IEEE International Conference on Industrial Engineering and Engineering Management, IEEM 2008, pp. 415–419. |
62 | Nejatian, M., Zarei, M.H. ((2013) ). Moving towards organizational agility: are we improving in the right direction? Global Journal of Flexible Systems Management, 14: (4), 241–253. |
63 | Noorul Haq, A., Boddu, V. ((2015) ). An integrated fuzzy QFD and TOPSIS approach to enhance leanness in supply Chain. International Journal of Business Performance and Supply Chain Modelling, 7: (2), 171–188. |
64 | Ocampo, L.A., Labrador, J.J.T., Jumao-as, A.M.B., Rama, A.M.O. ((2020) ). Integrated multiphase sustainable product design with a hybrid quality function deployment – multi-attribute decision-making (QFD-MADM) framework. Sustainable Production and Consumption, 24: , 62–78. |
65 | Osiro, L., Lima-Junior, F.R., Carpinetti, L.C.R. ((2018) ). A group decision model based on quality function deployment and hesitant fuzzy for selecting supply chain sustainability metrics. Journal of Cleaner Production, 183: , 964–978. |
66 | Osorio-Gómez, J.C., Manotas-Duque, D.F. (2018). Fuzzy QFD and TOPSIS for dispatching prioritization in maritime transportation considering operational risk. Best Practices in Manufacturing Processes: Experiences from Latin America, 97–116. |
67 | Palanisamy, P., Zubar, H.A. ((2013) ). Hybrid MCDM approach for vendor ranking. Journal of Manufacturing Technology Management, 24: (6), 905–928. |
68 | Piengang, F.C.N., Beauregard, Y., Kenné, J. ((2019) ). An APS software selection methodology integrating experts and decisions-maker’s opinions on selection criteria: a case study. Cogent Engineering, 6: (1), 1594509. |
69 | Rattawut, V. ((2016) ). Integration of Fuzzy-QFD and AHP base on a fuzzy scale for mini-CNC milling machine retrofit. In: 2015 World Congress on Industrial Control Systems Security, WCICSS 2015, pp. 89–94. |
70 | Raut, R.D., Mahajan, V.C. ((2015) ). A new strategic approach of fuzzy-quality function deployment and analytical hierarchy process in construction industry. International Journal of Logistics Systems and Management, 20: (2), 260–290. |
71 | Roghanian, E., Alipour, M. ((2014) ). A fuzzy model for achieving lean attributes for competitive advantages development using AHP-QFD-PROMETHEE. Journal of Industrial Engineering International, 10: (3), 68. |
72 | Seker, S. ((2020) a). Fuzzy AHP-QFD methodology and its application to retail chain. Advances in Intelligent Systems and Computing, 1029: , 1189–1197. |
73 | Seker, S. ((2020) b). Fuzzy quality function Deployment Method for smart phone product design. Studies in Systems, Decision and Control, 279: , 57–71. |
74 | Senthilkannan, N., Parameshwaran, R. ((2019) ). Performance analysis and quality improvement using fuzzy MCDM and lean tools in a paper industry. International Journal of Integrated Supply Management, 12: (3), 205–229. |
75 | Shuofang, L., Yang, Z., Yuchung, L., Minghong, W. ((2018) ). Study methods of design elements based on EGM and fuzzy QFD. In: 2018 International Conference on Engineering Simulation and Intelligent Control, ESAIC 2018, pp. 83–86. |
76 | Smarandache, F. ((1998) ). Neutrosophy: Neutrosophic Probability, Set, and Logic, Analytic Synthesis & Synthetic Analysis. American Research Press, pp. 105. |
77 | Sohn, S.Y., Choi, I.S. ((2001) ). Fuzzy QFD for supply chain management with reliability consideration. Reliability Engineering and System Safety, 72: (3), 327–334. |
78 | Su, C., Lin, C. ((2008) ). A case study on the application of fuzzy QFD in TRIZ for service quality improvement. Quality and Quantity, 42: (5), 563–578. |
79 | Tavana, M., Mousavi, N., Golara, S. ((2013) ). A fuzzy-QFD approach to balanced scorecard using an analytic network process. International Journal of Information and Decision Sciences, 5: (4), 331–363. |
80 | Taylan, O. ((2013) ). A hybrid methodology of fuzzy grey relation for determining multi attribute customer preferences of edible oil. Applied Soft Computing Journal, 13: (5), 2981–2989. |
81 | Tsai, C., Lo, C., Chang, A.C. ((2003) ). Using fuzzy qfd to enhance manufacturing strategic planning. Journal of the Chinese Institute of Industrial Engineers, 20: (1), 33–41. |
82 | Verma, D., Chilakapati, R., Fabrycky, W.J. ((1998) ). Analyzing a quality function deployment matrix: an expert system-based approach to identify inconsistencies and opportunities. Journal of Engineering Design, 9: (3), 252–262. |
83 | Vinodh, S., Chintha, S.K. ((2011) ). Application of fuzzy QFD for enabling sustainability. International Journal of Sustainable Engineering, 4: (4), 313–322. |
84 | Vinodh, S., Manjunatheshwara, K.J., Karthik Sundaram, S., Kirthivasan, V. ((2017) ). Application of fuzzy quality function deployment for sustainable design of consumer electronics products: a case study. Clean Technologies and Environmental Policy, 19: (4), 1021–1030. |
85 | Vongvit, R., Kongprasert, N., Fournaise, T., Collange, T. ((2017) ). Integration of fuzzy-QFD and TRIZ methodology for product development. In: 2017 3rd International Conference on Control, Automation and Robotics, ICCAR 2017, pp. 326–329. |
86 | Wang, C. ((2019) ). Integrating a novel intuitive fuzzy method with quality function deployment for product design: case study on touch panels. Journal of Intelligent and Fuzzy Systems, 37: (2), 2819–2833. |
87 | Wang, D., Yu, H., Wu, J., Meng, Q., Lin, Q. ((2019) ). Integrating fuzzy based QFD and AHP for the design and implementation of a hand training device. Journal of Intelligent and Fuzzy Systems, 36: (4), 3317–3331. |
88 | Wang, F., Li, X., Rui, W., Zhang, Y. ((2007) ). A fuzzy QFD-based method for customizing positioning of logistics service products of 3PLS. In: 2007 International Conference on Wireless Communications, Networking and Mobile Computing, WiCOM 2007, pp. 3326–3329. |
89 | Wang, H., Fang, Z., Wang, D., Liu, S. ((2020) ). An integrated fuzzy QFD and grey decision-making approach for supply chain collaborative quality design of large complex products. Computers and Industrial Engineering, 140: , 106212. |
90 | Xiao, S., Wu, J., He, E., Yang, Z. ((2015) ). Identification of software NFR based on the fuzzy-QFD model. International Journal of Security and its Applications, 9: (11), 145–154. |
91 | Yaakob, A.M., Gegov, A. (2015). Fuzzy rule based approach with z-numbers for selection of alternatives using TOPSIS. In: 2015 IEEE International Conference on Fuzzy Systems. |
92 | Yager, R.R. ((2013) ). Pythagorean fuzzy subsets. In: Joint IFSA World Congress and NAFIPS Annual Meeting, Edmonton, Canada, pp. 57–61. |
93 | Yang, M., Li, Y., Liu, Y., Gao, X. ((2010) ). A method for problem selection in the |
94 | Yang, S., Ong S, K., c. Nee A, Y. ((2013) ). Design for remanufacturing – a fuzzy-QFD approach. In: Re-Engineering Manufacturing for Sustainability – Proceedings of the 20th CIRP International Conference on Life Cycle Engineering, pp. 655–661. |
95 | Yazdani, M., Kahraman, C., Zarate, P., Onar, S.C. ((2019) ). A fuzzy multi attribute decision framework with integration of QFD and grey relational analysis. Expert Systems with Applications, 115: , 474–485. |
96 | Yu, L., Wang, L., Bao, Y. ((2018) ). Technical attributes ratings in fuzzy QFD by integrating interval-valued intuitionistic fuzzy sets and Choquet integral. Soft Computing, 22: (6), 2015–2024. |
97 | Zadeh, L.A. ((1965) ). Fuzzy Sets. Information and Control, 8: (3), 338–353. |
98 | Zadeh, L.A. ((2011) ). A note on Z-numbers. Information Sciences, 181: (14), 2923–2932. |
99 | Zaim, S., Sevkli, M., Camgöz-Akdağ, H., Demirel, O.F., Yesim Yayla, A., Delen, D. ((2014) ). Use of ANP weighted crisp and fuzzy QFD for product development. Expert Systems with Applications, 41: (9), 4464–4474. |
100 | Zhang, Z., Yang, J., Ye, Y., Hu, Y., Zhang, Q. ((2012) ). A type of score function on intuitionistic fuzzy sets with double parameters and its application to pattern recognition and medical diagnosis. Procedia Engineering, 29: , 4336–4342. |


