
Approach for Multi-Label Text Data Class Verification and Adjustment Based on Self-Organizing Map and Latent Semantic Analysis
Abstract
In this paper, a new approach has been proposed for multi-label text data class verification and adjustment. The approach helps to make semi-automated revisions of class assignments to improve the quality of the data. The data quality significantly influences the accuracy of the created models, for example, in classification tasks. It can also be useful for other data analysis tasks. The proposed approach is based on the combination of the usage of the text similarity measure and two methods: latent semantic analysis and self-organizing map. First, the text data must be pre-processed by selecting various filters to clean the data from unnecessary and irrelevant information. Latent semantic analysis has been selected to reduce the vectors dimensionality of the obtained vectors that correspond to each text from the analysed data. The cosine similarity distance has been used to determine which of the multi-label text data class should be changed or adjusted. The self-organizing map has been selected as the key method to detect similarity between text data and make decisions for a new class assignment. The experimental investigation has been performed using the newly collected multi-label text data. Financial news data in the Lithuanian language have been collected from four public websites and classified by experts into ten classes manually. Various parameters of the methods have been analysed, and the influence on the final results has been estimated. The final results are validated by experts. The research proved that the proposed approach could be helpful to verify and adjust multi-label text data classes. 82% of the correct assignments are obtained when the data dimensionality is reduced to 40 using the latent semantic analysis, and the self-organizing map size is reduced from 40 to 5 by step 5.
1Introduction
Nowadays, the amount of information is growing at a very high rate, and systems store it in various formats. Most of the data collected are unstructured, leading to various problems such as preparing, processing, and analysing such types of data. One of the unstructured data types is text. There are many different tasks where text analysis is used, but usually it is applied in text data classification and clustering, semantic analysis, context analysis, etc. Many different classification algorithms are suitable for text data analysis starting from the traditional classification algorithms (Joulin et al., 2016) like decision trees, multinomial Naive Bayes (MNB), support vector machine (SVM), and going to the deep learning algorithms (Minaee et al., 2021) such as a long short-term memory (LSTM), convolutional neural networks, and even the newest method – transformers (Khan et al., 2021). The sentiment analysis is a branch of the classification tasks, where text data needs to be classified according to the sentiment, usually positive, negative, and neutral. It is often applied in social network analysis, movie reviews and comments analysis, etc. (Bhuiyan et al., 2017; Kharlamov et al., 2019). When performing text data clustering, it is possible to discover the relationship or similarities between different texts, using such clustering algorithms as k-means, hierarchical clustering, and other semi-supervised clustering methods (Aggarwal and Zhai, 2012). The context analysis is the highest level of text data analysis, when not only the text data is categorized or classified, but the meaning of the text is also tried to take into account (Hernández-Alvarez and Gomez, 2016).
In solving any task, a process starts with data selection. If the data is not correctly prepared, pre-processed, or other mistakes are involved, there is a high risk that the model will work improperly. Therefore, the data must be well prepared, i.e. the classes of analysed data must be correctly assigned, the data classes do not have to depend on different experts’ labelling, and the classes must be unequivocally correct. Usually, when the new data is collected, researchers, experts of a specific field, or other persons need to assign a class manually, the errors or inaccuracies can be made by mistake. There is always a possibility of a human factor mistake that later influences the model results. When the text data are analysed, the data can be assigned not only to one class but also to more classes, for example, the number of classes can depend on the text length. Usually, a dominant topic or context of the analysed text data is considered as a class of text data. In this case, the multi-label text data is obtained, so analysis becomes more complex. There are various researches where the multi-label text data has been analysed using different techniques, but the class adjustment and verification are not considered (Nanculef et al., 2014; Park and Lee, 2008). The main problem of multi-label text data class verification and adjustment is deciding which class of the data item should be changed and which class should be assigned instead. A process when the multi-label text data class is changed to another class is called a class adjustment.
In this paper, a new approach has been proposed based on latent semantic analysis (LSA) and self-organizing map (SOM). The newly collected data from four leading financial news websites in Lithuania have been experimentally analysed (LFND, 2021). Each data item is assigned to one or two classes at the same time. The collected data will be used in the future to train a machine learning model that will be able to assign the class for new input data. The class obtained later will be used to extract the full context in the text data. In one step of our proposed approach, SOM has been used. SOM has a problem dealing with high dimensional data, so the dimensionality should be reduced. There are a lot of dimensionality reduction methods (Blum et al., 2013), such as principal component analysis, multidimensional scaling, manifold learning, etc., but none of those take into account the context of the text data when the dimensionality is reduced. Thus, in our proposed approach, latent sentiment analysis has been used to reduce the dimensionality of the data. The latent sentiment analysis is suitable for text data analysis. In some steps of the approach, we used the cosine similarity distance to calculate similarities between text data. Various parameters of the approach have been analysed to determine what influences the final results. The validation of the results has been performed by experts, where all new assigned classes or adjusted classes have been reviewed.
The novelty of the proposed approach gives the possibility to perform the semi-automated adjusting of a multi-label text data class, which could lead to higher accuracy results in the classification tasks. The data quality significantly influences the final results of classification models, so it is always important to improve the data quality. When analysing text data, it is difficult to determine unambiguously to which class a text data item belongs. Often in practice, the text data can be assigned to more than one class. So, it becomes a difficult task even for highly qualified experts to decide which class is more important and should be chosen. In this research, the definition of data quality is related to the problem to determine the multi-label text data class incorrectly assigned by researchers or experts in the data labelling process. Our proposed approach can be an assistant to experts and researchers that analyse the newly collected data.
The paper is organized as follows. In Section 2, the related works are reviewed. In Section 3, all parts of the proposed apporach are described. The data description and experimental investigation are given in Section 4. Section 5 concludes the paper.
2Related Works
The performed literature analysis has shown that there are no well-known and widely used methods for multi-label text data adjustment. Usually, when analysing such kind of data, all researches focus on solving classification and clustering problems. In Ueda and Saito (2003) research, the probabilistic generative model has been proposed to solve multi-class and multi-label text data clustering problems. In the multi-class data tasks, each data item is assigned just to one class from all possible classes, and in the case of multi-label, the data item can have more than one class. The authors’ solution is based on a binary classifier to decide which class the text must be assigned to. In other words, a lot of classifiers are created where each of them can assign to a specific class. Later, the new text data is fed to a lot of trained classifiers, and as a result, all possible true/false classes are returned. In such a way, all classes which correspond to true class are considered as multi-label text data class. The problem in this method is that a huge amount of classifiers have to be prepared and trained, so the text data of various fields need models before the start of the work.
Hmeidi et al. in two of their publications (Ahmed et al., 2015; Hmeidi et al., 2016) used different strategies to analyse the multi-label text of the Arabic language. One of the methods used a lexicon-based method for multi-label text data classification. The keywords that are most associated with each analysed data class have been extracted automatically from the training data along with a threshold that was later used to determine whether each test text belongs to a certain class. In such a way, a lexicon-based text data classification helps to match the vocabularies associated with each class in the lexicon with text vectors found in text data and classifying them accordingly. The other research showed that in such a way, the built lexicon can be a valuable factor in boosting the accuracy of the unsupervised classification, especially when it is automated (Kim et al., 2014). The other method that authors have used in their research is a so-called problem transformation method available in the MEKA system. It is a simple way to transform the multi-label data into a single-label one that is suitable for standard classification using various classification methods such as k-nearest neighbours, SVM, decision tree, etc.
Another method that can be used for text analysis is a latent Dirichlet allocation (LDA) (Blei et al., 2003). LDA is a model that discovers underlying topics in a collection of documents and infers word probabilities in topics. A user can select the wishing number of topics in the method as a parameter, and the number of words, which reflect these topics best. LDA is a completely unsupervised algorithm. Most importantly, LDA makes the explicit assumption that each word is generated from one underlying topic. In Ramage et al. (2009) publication, the LDA approach has been proposed for multi-label text analysis where additionally the user supervision has been included. In the paper, the authors demonstrate the model effectiveness on tasks related to credit attribution within documents, including document visualizations and tag-specific snippet extraction.
In order to demonstrate the performance of the proposed approach, text data in Lithuanian was examined. The various text pre-processing filters or models can be used in text analysis, but usually, they easily fit only for English texts, and when language is less popular, different problems arise and solutions have to be found to adapt the models. The spelling of the Lithuanian language is complicated because of word form variety as well as sentence structure. There are researches where the Lithuanian language is analysed, but none of them analyse the multi-label text data. Krilavičius et al. (2012) have presented a combined application of natural language processing and information retrieval for Lithuanian media analysis. It has been demonstrated that these combinations with appropriate changes can be successfully applied to Lithuanian media text data. Kapočiūtė-Dzikienė et al. (2019) tried to classify the Lithuanian comments collected from the news websites as positive, negative, or neutral. Conventional machine learning methods such as SVM and MNB, and deep learning methods have been used. In other research, Štrimaitis et al. (2021), the sentiment analysis of Lithuanian financial context text data has been performed. LSTM algorithm, SVM, and MNB algorithms have been used, where the highest accuracy is obtained by the MNB classifier. All researchers used different variations of Lithuanian text pre-processing to achieve the best classification accuracy possible.
The performed related works analysis has shown that the main focus of researches is usually to find out which classification algorithm can obtain the best accuracy results on the multi-label text data and to carry out a comparative analysis. The most commonly used technique is to create binary classifiers for each multi-label text data class, and as a result, the model can predict to which classes the new data item belongs. Also, the analysis shows that there are not many studies performed using the Lithuanian language text data, especially using the multi-label text data. The specificity of the Lithuanian language requires slightly different data preparation, and it must be taken into account. Most scientific papers performing a multi-label data classification do not analyse the quality of the data. Data quality is unambiguously trusted and not questioned. It is obvious that the results are highly dependent on the preparation of data in the supervised learning models. Therefore, it is important to develop methods that could help improve the quality of multi-label text data that would lead to better classification results.
3Multi-Label Text Data Class Verification and Adjustment
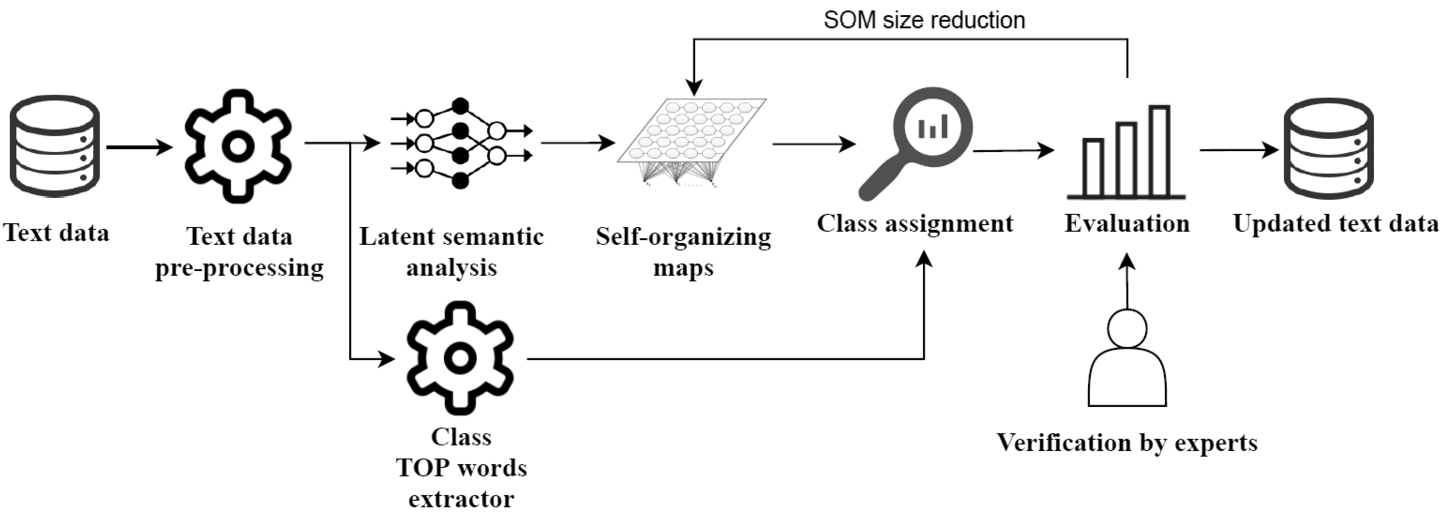
In this paper, the approach that can adjust and verify the classes of multi-label text data has been proposed. The concept of the proposed approach is presented in Fig. 1. The main parts are as follows: data pre-processing, the finding of the most commonly used words in each analysed data class, the usage of LSA to reduce the dimensionality of vectors, corresponding to text data items, SOM to discover similarities between text data, and rules for assignment to a new class.
Fig. 1
The proposed approach for multi-label text data class verification and adjustment.
Obviously, the results of this approach can depend on various methods and selected parameters, so the experimental investigation has been performed to confirm the usability of the approach, and the obtained results are presented and discussed in Section 4. To evaluate the quality of the approach, we cooperated with the experts and asked to verify the new assigned class of the multi-label text data. After data have been verified by experts, the new classes of multi-label text data are obtained and the performance of the proposed approach is evaluated.
3.1Latent Semantic Analysis
LSA is one of the models (Dumais, 2004) which is often used in natural language processing tasks. The advantage of this method over other dimensionality reduction methods is that the dimensionality reduction considers the context of the text data. The main aim of the LSA model is to detect a relationship between text data and the words they contain. LSA assumes that words in the text data that are close by their meaning will occur in similar pieces of text, by the so-called distributional hypothesis. Also, the LSA model is a dimensionality reduction method, so it helps to reduce the dimensionality of huge text vectors. Suppose we have a text data
(1)
3.2Text Similarity Measures
In the stage of a class assignment in our proposed approach, we used the similarity measure. The related works showed that the most common similarity measure used in text analysis is a cosine similarity distance. Other similarity measures such as Dice coefficient, overlap, etc. (Stefanovič et al., 2019) can also be used in text similarity detection. The performed primary research showed that there is no significant difference between usage of cosine and Dice coefficient in our model. The cosine similarity distance between text vectors
(2)
Let’s say we have three words that describe our selected and analysed data class the best: “euros”, “lent”, “more”. The text data samples are given in Table 1. The text matrix (1) with relative word frequency is formed, and we want to find which of the texts
Table 1
The example of text data.
| Texts | Text content | Text matrix | Cosine similarity distance |
| Today I found 50 euros | 0.5774 | ||
| 100 euros is more than 50 euros | 0.7746 | ||
| The man lent 100 euros to his friend | 0.7001 |
The cosine similarity distance is in the interval
3.3Self-Organizing Map
There are many methods applied in data science, most of them are used nowadays to solve data classification and clustering tasks. In our research, we pay attention to data clustering. Various clustering methods can be used (Aggarwal and Zhai, 2012), such as density-based clustering, hierarchical clustering, k-means, etc. In our proposed approach, we used SOM. SOM is one of the artificial neural network models proposed by Kohonen (2012). The main advantage of this method is that it not just clusters the data, but also shows the results in a visual form that can be interpreted much easier by a researcher. The SOM visual form can be presented in various ways (Stefanovič and Kurasova, 2011; Dzemyda and Kurasova, 2002) but the main aim of SOM is to preserve the topology of multidimensional data when they are transformed into a lower-dimensional space (usually two-dimensional). SOM can be applied in various fields such as data mining (López et al., 2019), text mining (Yoshioka and Dozono, 2018), and even in image analysis tasks (Licen et al., 2020; Aly and Almotairi, 2020). SOM can be used to cluster, classify, and visualize the data. SOM is a set of nodes connected via a rectangular or hexagonal topology. The rectangular topology of SOM is presented in Fig. 2.
Fig. 2
Two-dimensional SOM (rectangular topology).
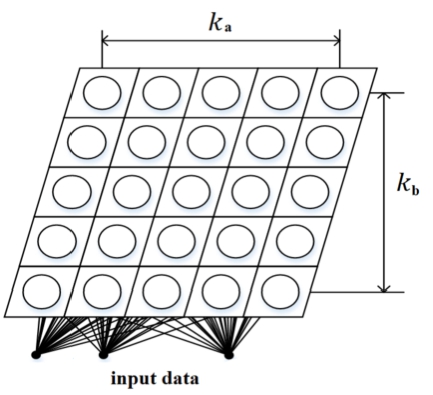
The set of weights forms a vector
(3)
3.4The Proposed Approach
Suppose we have a multi-label text data
Then, all analysed text data has to be split into the subsets
(4)
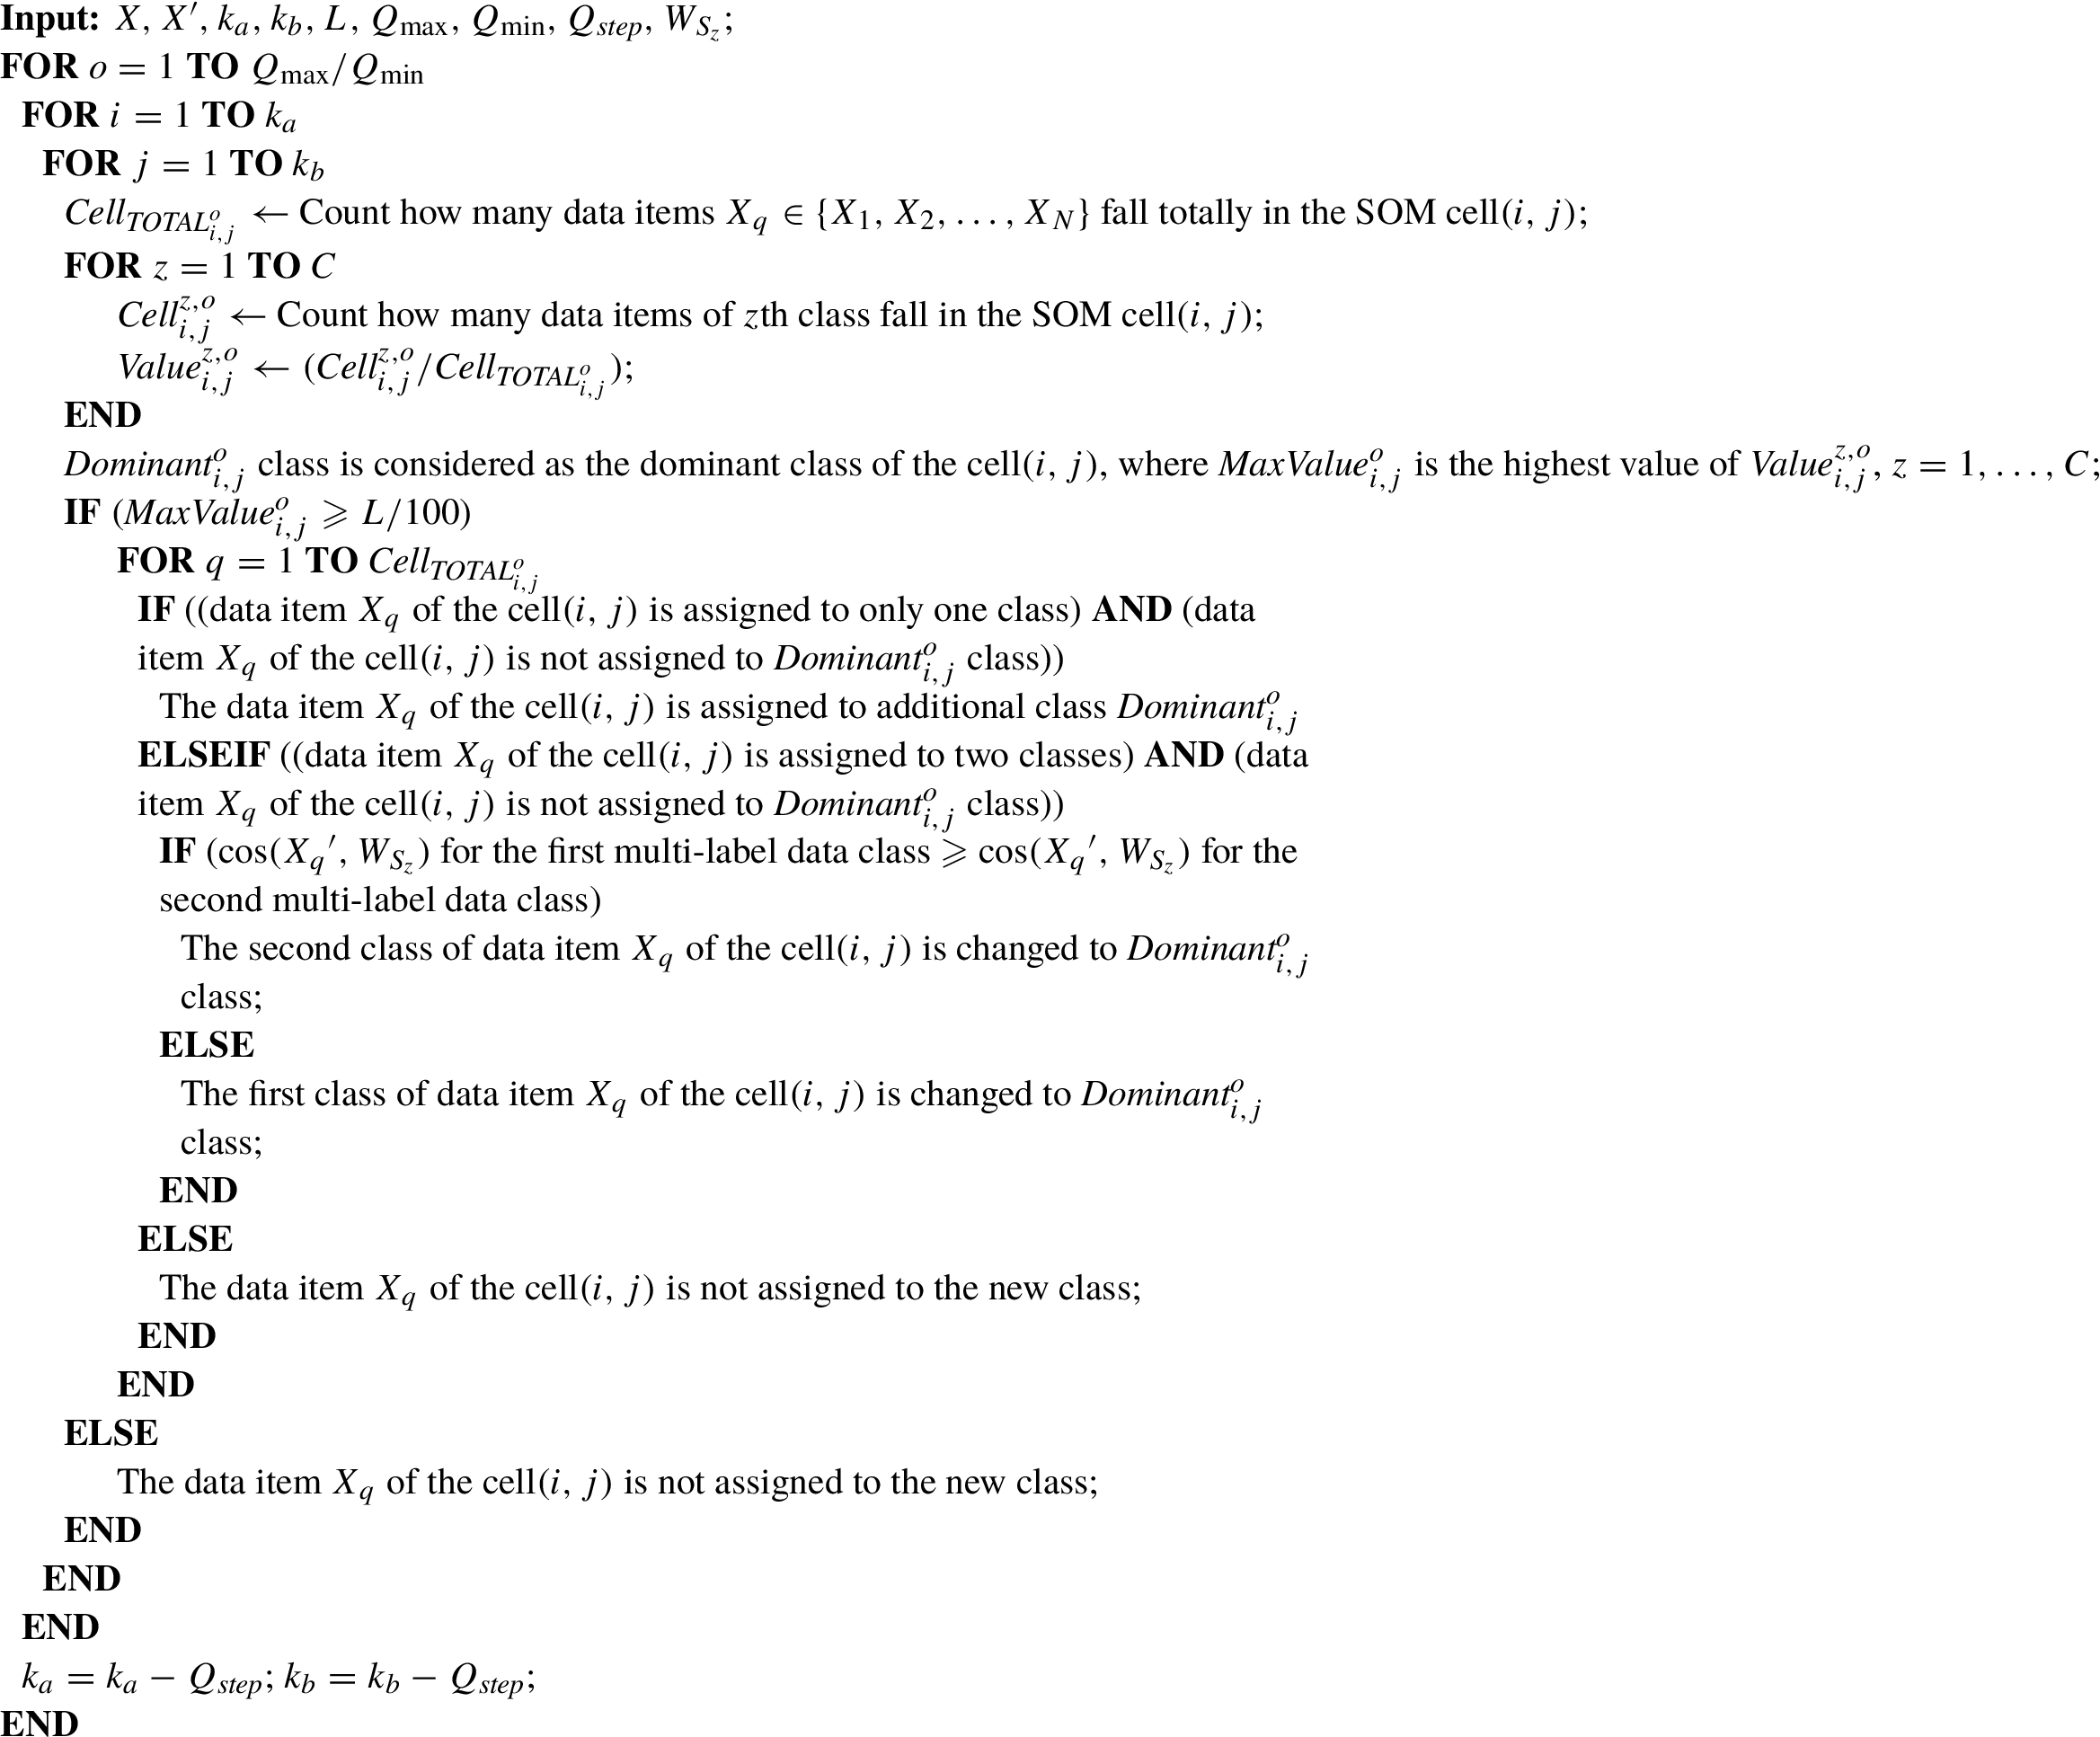
Algorithm 1
New class assignment using SOM.
4Experimental Investigation
4.1Text Data Analysed
To perform the experimental investigation, the newly collected data has been used (LFND, 2021). The data is collected from public financial Lithuania news websites and stored in a database as texts. The analysed data is a set of text
Fig. 3
The token number distribution of unpre-processed text data.
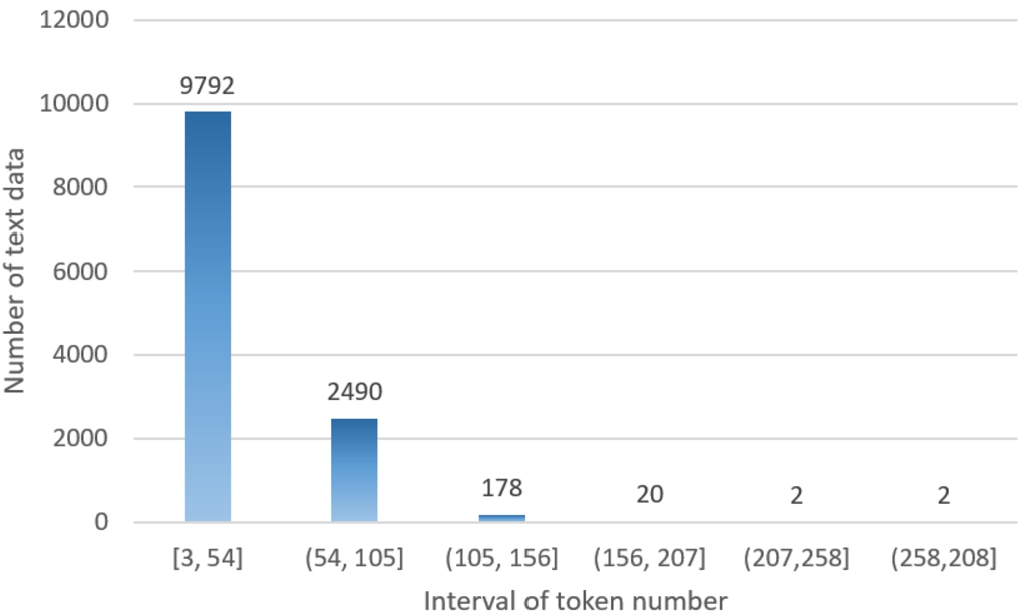
The token number distribution of unpre-processed text data is presented in Fig. 3. As we can see in Fig. 3, the majority of the text length is no more than 54 tokens. There are 2490 texts whose number of tokens is equal from 54 to 105, and there are just 202 texts that are longer than 105 tokens.
In this research, the multi-label text data is analysed, thus some texts belong to one or two classes. Suppose, we have a text that belongs to “Pandemic” and “Collective” classes, so this text will be considered as “Pandemic, and “Collective” at the same time. The data class distribution is presented in Fig. 4 (if data item has more than one class, it is presented in both classes). Because of the reason that this data is collected from a financial news website, the majority of the text belongs to the class “Finance”. The number of data items from the other classes is similar, except the number of classes “Industry”, “Development”, and “Collective” is larger. The smallest number of data items are from class “Politics”.
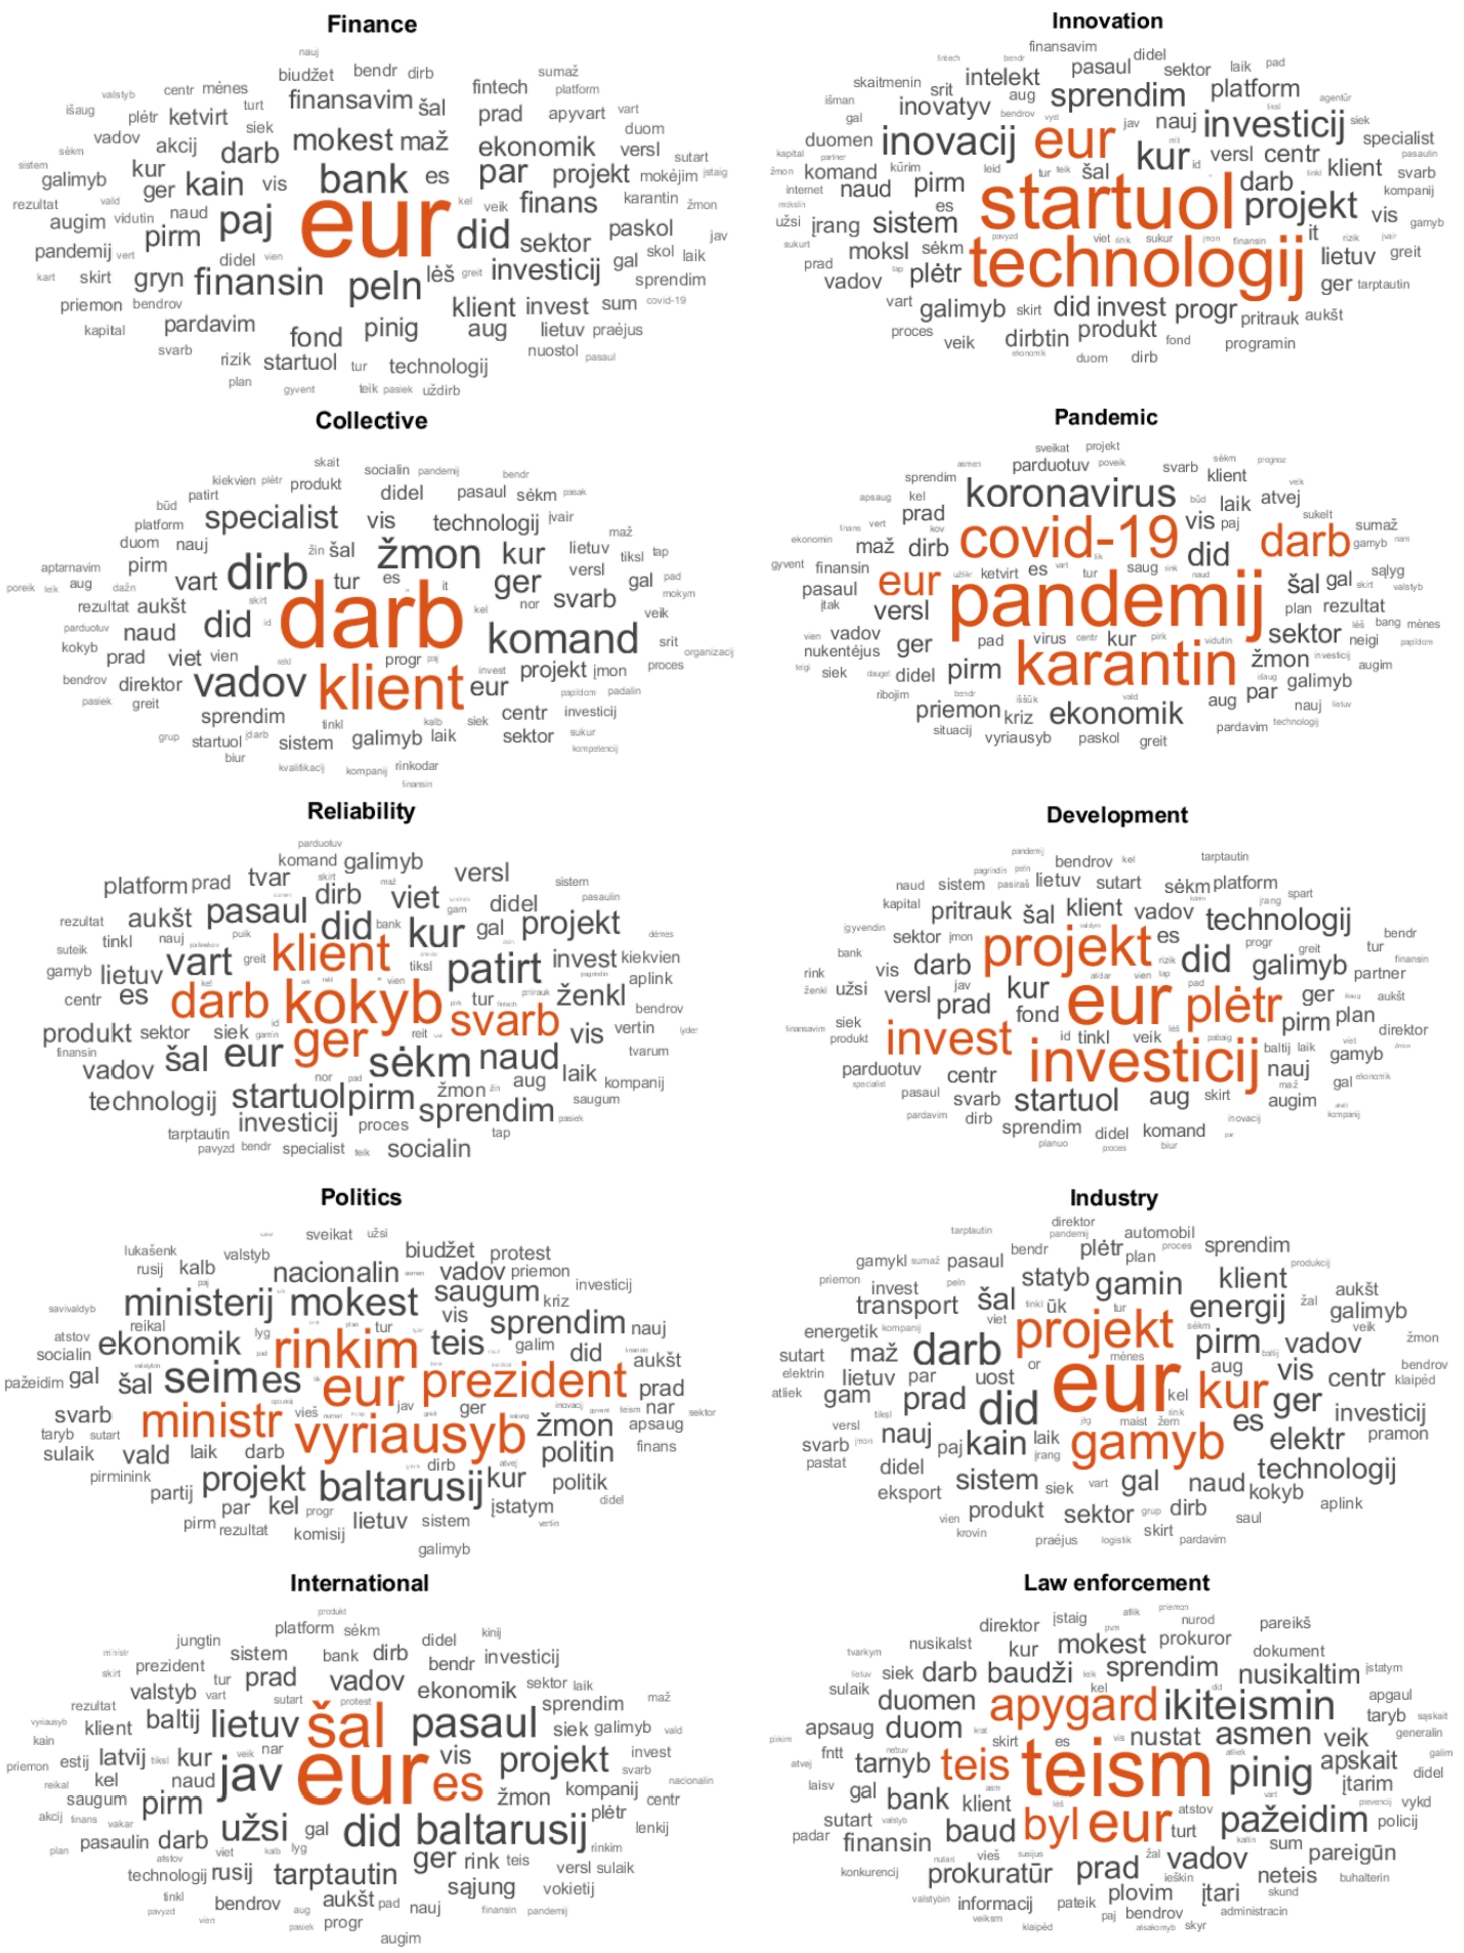
There are 6025 texts that got just one class assigned, and the rest 6459 of data items are assigned to two classes. The total number of tokens over all the data is equal to 438730 when the data is unpre-processed (59148 unique tokens) and, respectively, after pre-processing (filters are described in Subsection 3.4) overall number of tokens is equal to 254615 (22730 unique tokens). The most frequent words of each data class are presented in Fig. 5, which allows us to find which words represent each class the best.
Fig. 4
Distribution of data class.
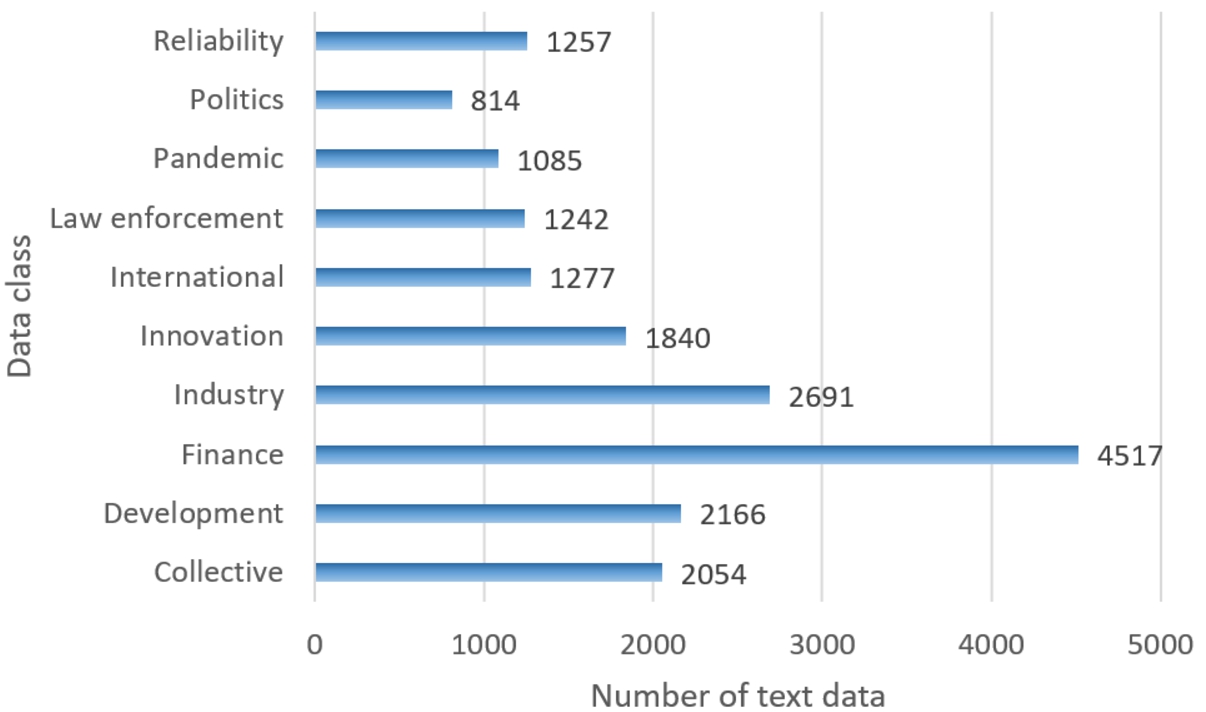
Fig. 5
Word clouds of each class.
4.2Experimental Research Results and Validation
As it was mentioned before, first of all, the text data has to be pre-processed. In our experimental investigation, we used the following pre-processing filters: removed numbers, tokens were converted to the lower case, used Lithuanian language snowball stemming algorithm (Jocas, 2020), erased punctuation, used smaller than three characters tokens’ length, and used the Lithuanian language stop words list. An example of SOM using the analysed data is presented in Fig. 6. An Orange data mining tool has been used for the visual presentation of SOM (Demšar et al., 2013). In this type of visualization, the circles show just the class label of the majority data items which fall in the one SOM cell, so some data items from other classes can be in the same cell as well. In this example, the selected size of the SOM is equal to
Fig. 6
Data presented in
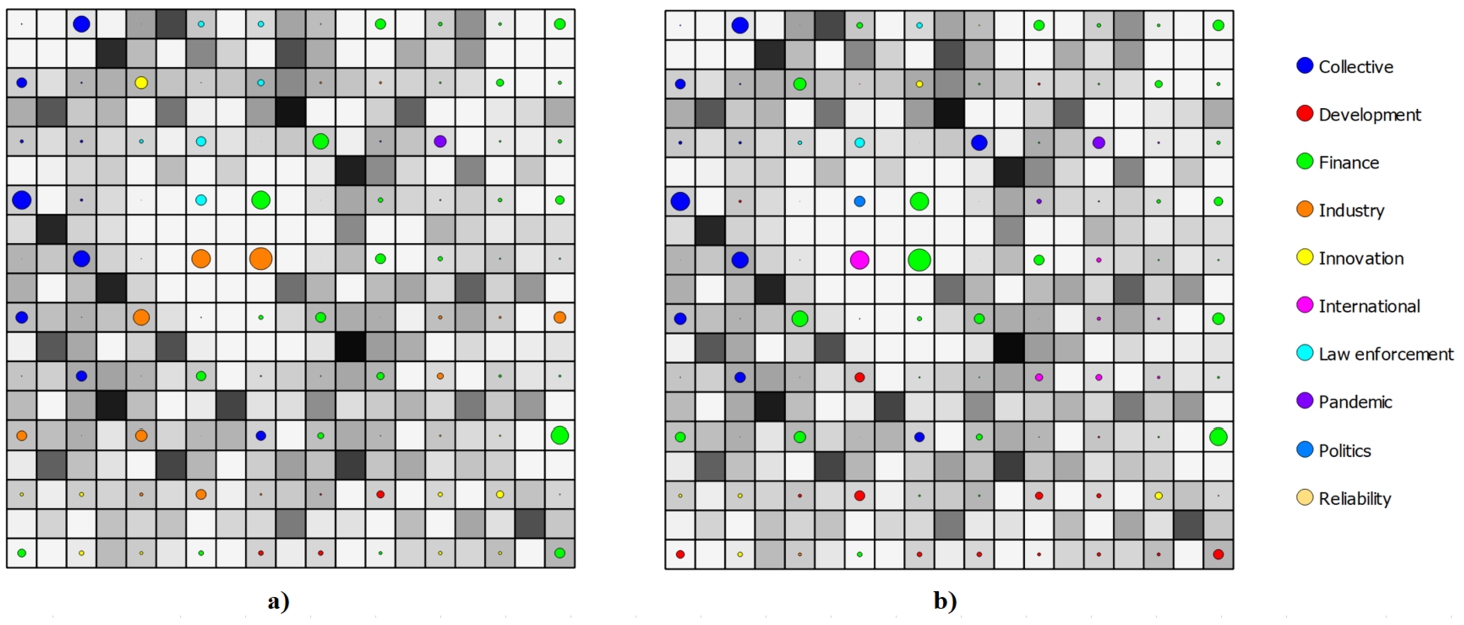
There are a lot of various options that can be selected in the approach, so according to our previous research (Stefanovic and Kurasova, 2014), we choose the following SOM parameters by default: SOM size is equal to
Table 2
Class assignments tags and their descriptions.
| Tag name | Tag description |
| Accept | The “Accept” tag is used if the new class is unambiguously assigned correctly. For example, the text primarily belongs to one class, and the approach finds that an additional class has to be assigned. If the new class assignment is correct, the expert marks it as “Accept”. In other situation, if the text primarily is assigned to two classes, and the approach changes one of the class correctly, this tag also is used. |
| Decline | “Decline” is marked if the approach assigns the class obviously incorrectly. For example, the text primarily belongs to the classes “Finance” and “Politics”. The proposed approach assigned a new class “Development” instead of the class “Finance”, but this class is incorrect, so the expert has to mark the tag “Decline”. |
| Possible | Suppose the text is primarily assigned to two classes – “Industry” and “Finance”. The proposed approach makes a new assignment, and as a result, the “Finance” class has been changed to the class “Innovation”. If the analysed text data can have more than two classes and the “Innovation” class is correct, the tag “Possible” has to be used. In such a way, the artificial balancing of assigned classes can be done when the class depends not on the human point of view but is based only on the words in the text. |
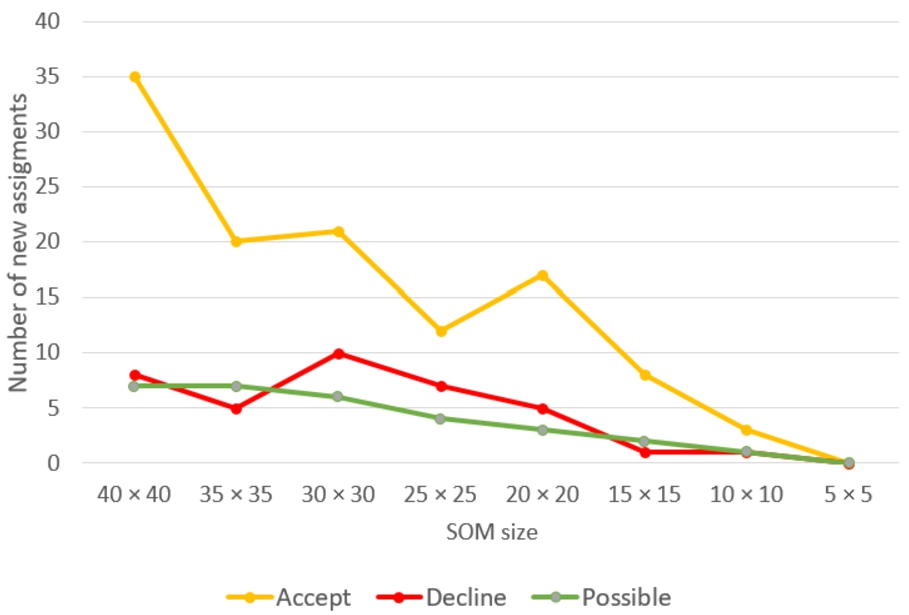
First of all, the primary research has been performed to find out how the size of the SOM influences the number of new assignments. Thus, for simplicity, when using LSA, the dimensionality is reduced to
Fig. 7
Class assignments reviewed by experts,
In this experimental investigation, we will assume that if the new class assignments reviewed by experts are tagged as “Accept” and “Possible”, it will be considered as a correct new class assignment, and the data is not corrupted. In such a way, the correct assignment ratio can be calculated using the simple formula (5). The ratio can be expressed as percentages:
(5)
Fig. 8
Class assignments reviewed by experts,
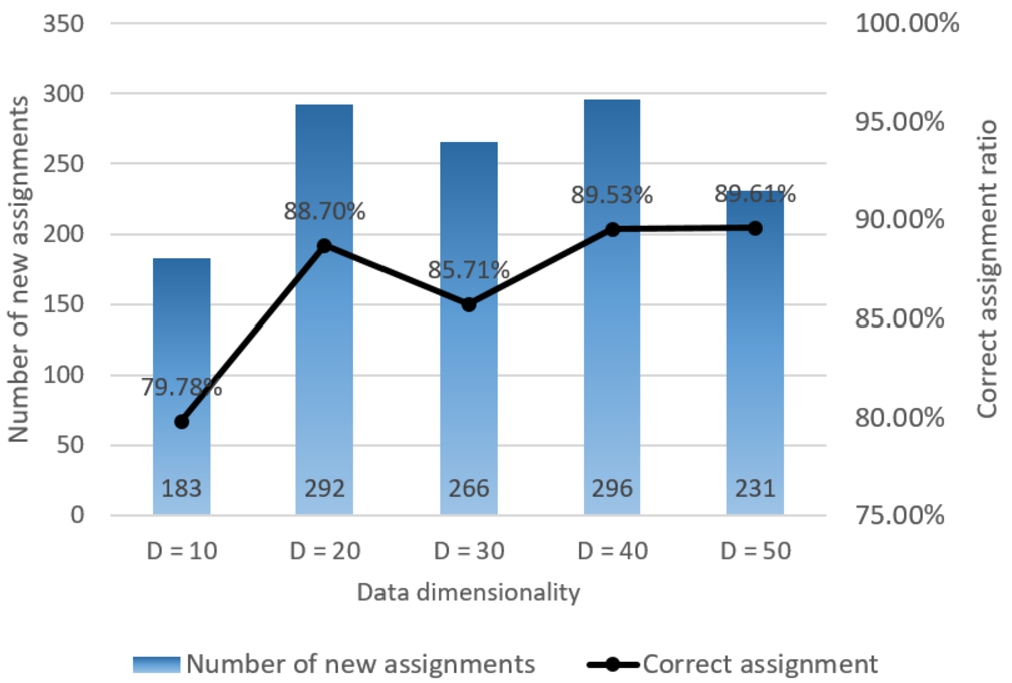
The same calculations have been performed using the approach with different reduced dimensionalities, and the overall correct assignment value is presented in Fig. 8. As we can see, using
Fig. 9
Dependence of the numbers of new class assignments on SOM size,
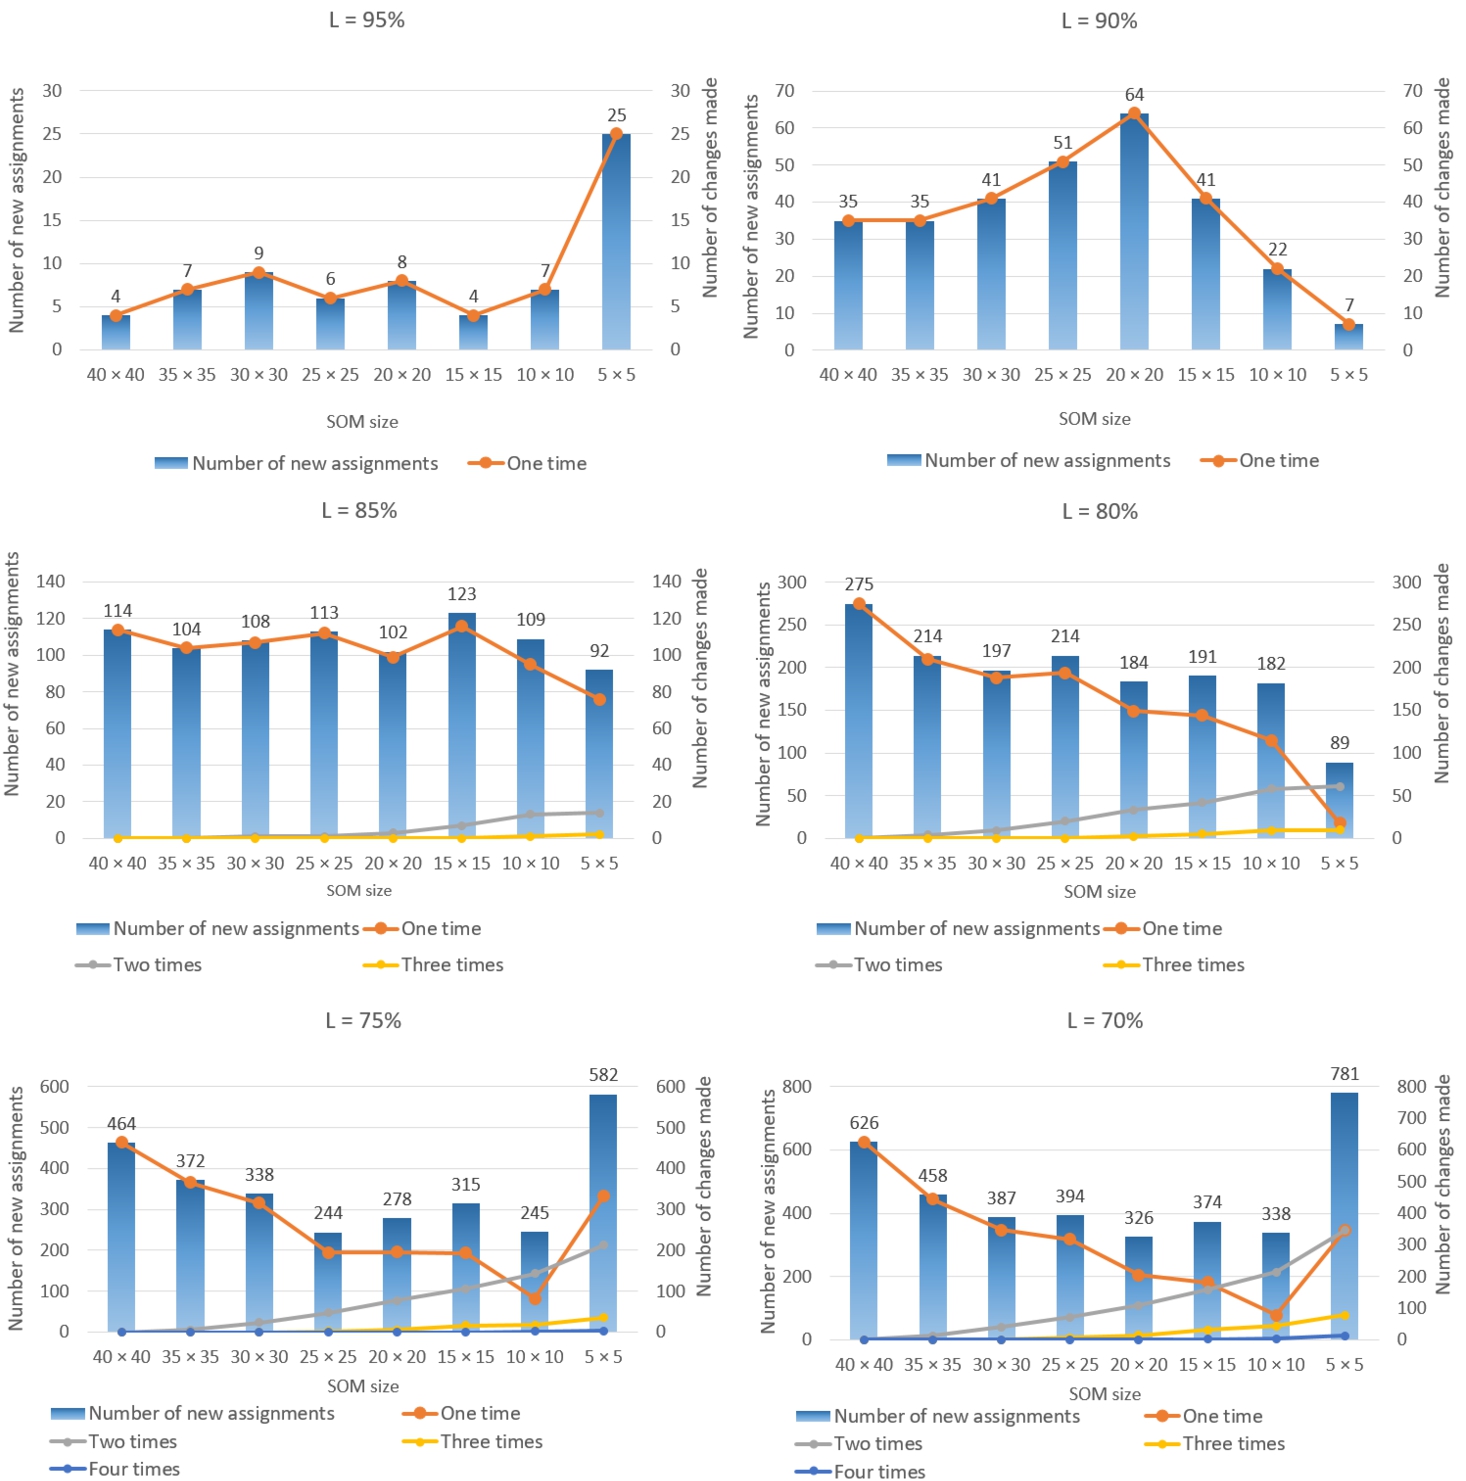
As we can see, when the limit is equal to
Fig. 10
Class assignments reviewed by experts,
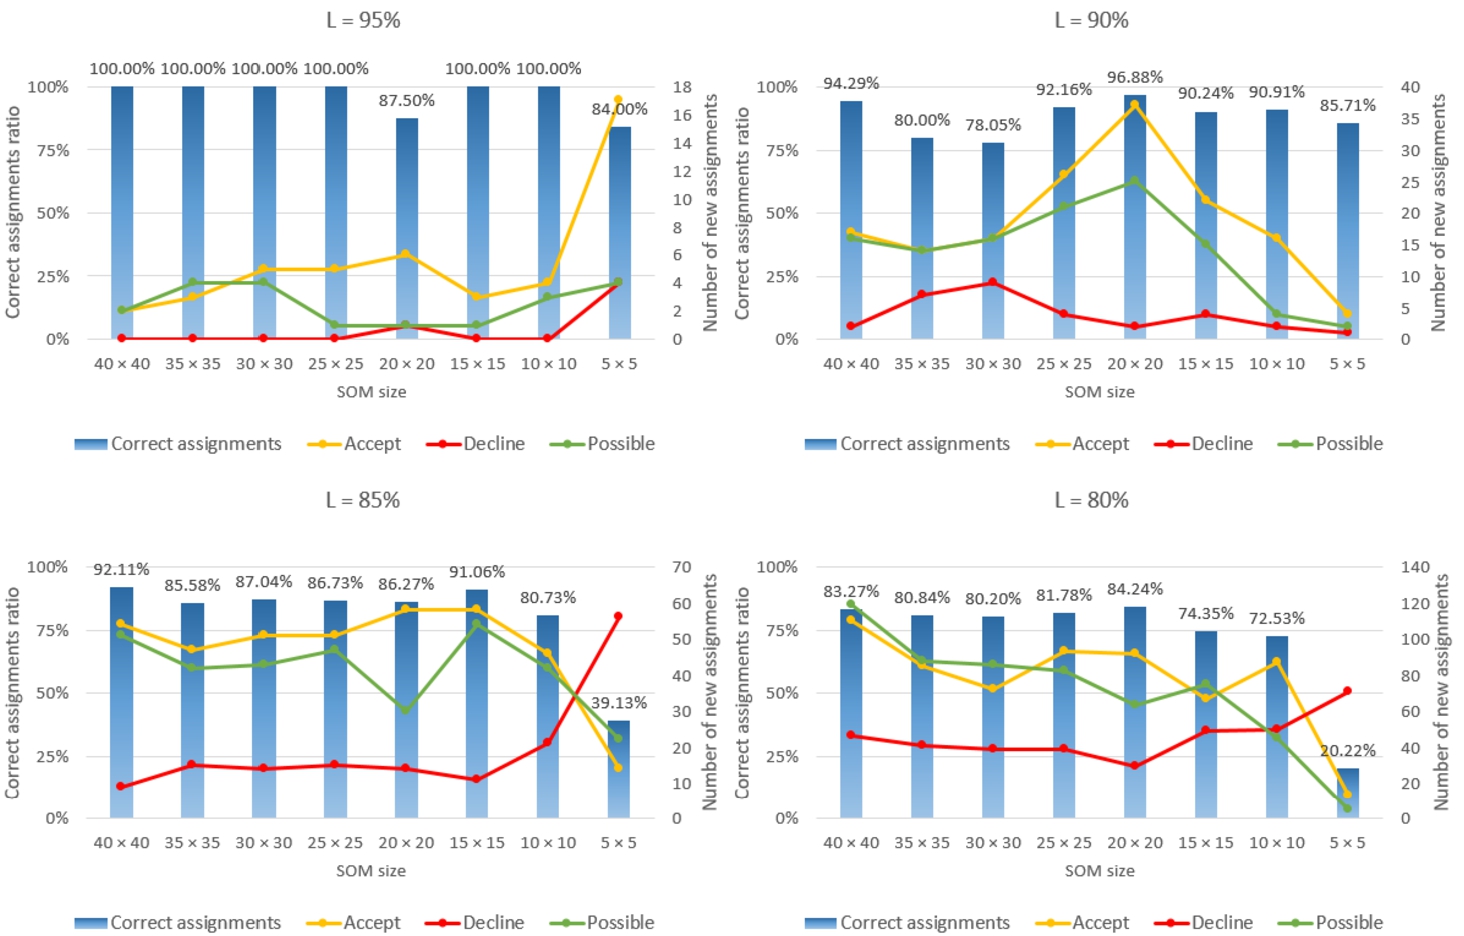
A deeper analysis of the SOM size
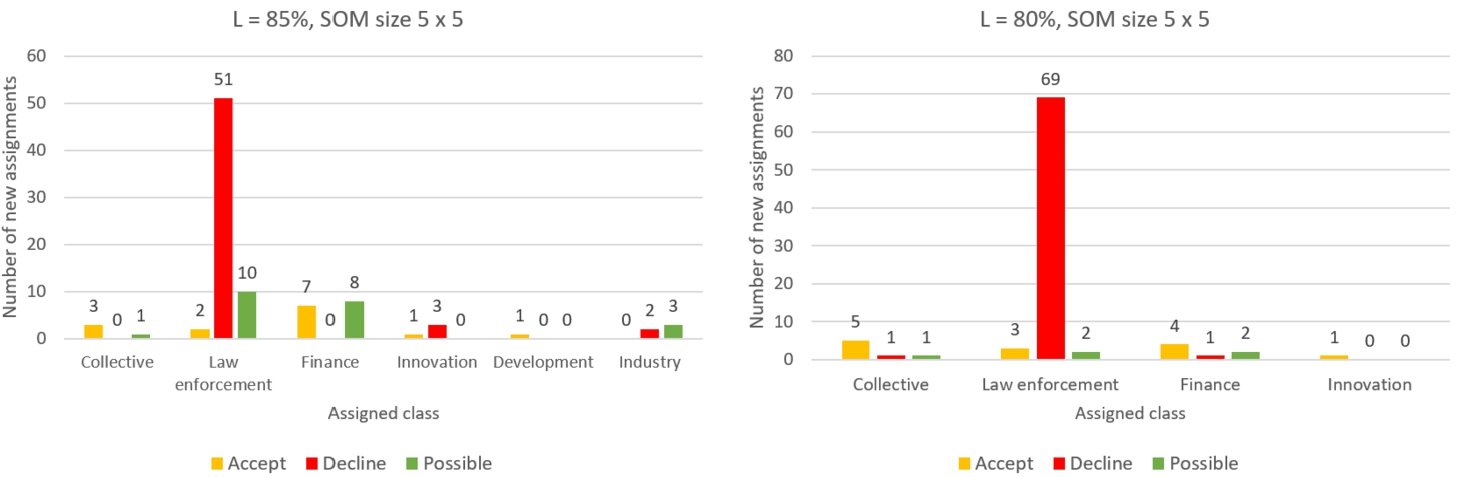
Fig. 11
The distribution of new class assigments, when SOM size is
The correct assignment ratio per all steps of the SOM size reduction is obtained and presented in Fig. 12. As we can see, with each reduction of the SOM size, the correct assignments are gradually decreasing, but the number of assignments is increasing. When the limit percent
Fig. 12
The correct assignment ratio over all steps of the proposed approach,
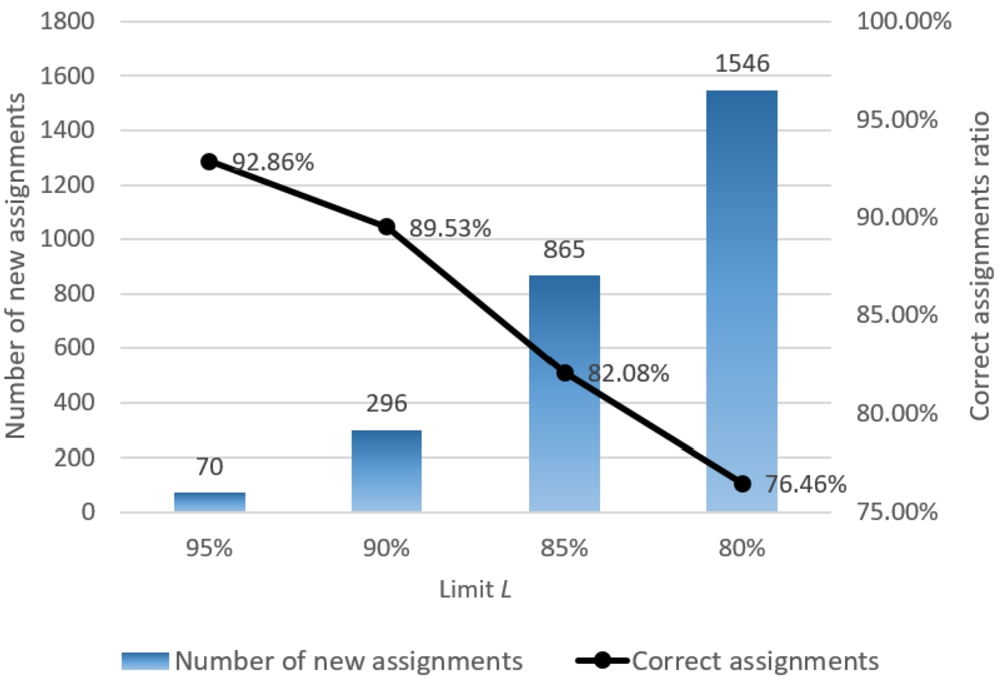
The experimental investigation has shown that the optimal limit percent is equal to
4.3Discussion
The comprehensively experimental investigation has been performed using one Lithuanian multi-label text data, and the usability of the proposed approach has been experimentally proved. The analysed data has been chosen because of the following reasons: the data size (the usage of the proposed approach with higher amount of text data); the text data is not in the English language (the English language usually is suitable for various methods and is structurally simpler); the data must be multi-label (one data item belongs to more than one class). The same level experimental investigation using other multi-label text data has not been performed, because data with similar properties have not been found. Usually, all of the data in the various freely accessed databases are of small size or artificially made. Primary research has shown that the chosen language does not significantly influence the obtained results, the concept of the model remains the same. Therefore, the proposed approach can be used to adjust multi-label text data classes in any language. There is also a limitation on how many classes need to have one item of the analysed data.
When analysing other data with other properties, for example, text data that have more classes, different language and different lengths of text, the selected parameters used in the proposed approach should be tuned according to the specificity of text data. For example, an English stemming algorithm should be used to analyse an English text, and if the text is much longer, the frequency of words included may also be higher than three, etc. Different pre-processed data may affect the parameters of the LSA and SOM algorithms (reduced data dimensionality may be higher, while SOM size reduction starts with smaller/larger SOM size). Each newly proposed approach has its limitations and threats, but the results of the experimental study are promising and will be used in future work on classification tasks.
5Conclusions
The multi-label text class verification and adjustment is a complex task because many different factors can influence the final results, such as language specificity, the natural language pre-processing methods, and the model used to assign the classes. Nowadays, many types of research focus on multi-label text data classification using conventional machine learning algorithms or deep learning algorithms, but no effort is made to improve the data quality. In text analysis, many human factors are involved in the preparation of the data. When text data has been labelled manually, errors or inconsistencies are sometimes unavoidable. Therefore, the main aim of the proposed approach is to improve the quality of the data.
The experimental investigation has proved that the proposed approach can be used for multi-label text class adjustment and verification. The main steps of the proposed approach are as follows: 1) data are pre-processed; 2) LSA is used to reduce the dimensionality of the data; 3) the most frequent words in the texts of each class are collected; 4) SOM is used to detect similarities between texts; 5) each data item is assigned to a class according to SOM and cosine similarity distance; 6) new classes are verified and adjusted by experts. The dimensionality reduction analysis using LSA has shown that the highest number of new assignments is made when the dimensionality is reduced to
Deeper research has shown that the use of the automatic extraction of the most frequent words from each class has advantages and disadvantages. The advantage is that the researcher does not have to worry about the context of the data, but on the other hand, the proposed approach probably would be more accurate with a manually extracted and verified word list of each class by experts. More detailed research should be performed in future work to prove this hypothesis.
References
1 | Aggarwal, C.C., Zhai, C. ((2012) ). A survey of text clustering algorithms. In: Mining Text Data, pp. 77–128. Springer. |
2 | Ahmed, N.A., Shehab, M.A., Al-Ayyoub, M., Hmeidi, I. ((2015) ). Scalable multi-label arabic text classification. In: 2015 6th International Conference on Information and Communication Systems (ICICS), pp. 212–217. IEEE. |
3 | Aly, S., Almotairi, S. ((2020) ). Deep convolutional self-organizing map network for robust handwritten digit recognition. IEEE Access, 8: , 107035–107045. |
4 | Bhuiyan, H., Ara, J., Bardhan, R., Islam, M.R. ((2017) ). Retrieving YouTube video by sentiment analysis on user comment. In: 2017 IEEE International Conference on Signal and Image Processing Applications (ICSIPA), pp. 474–478. IEEE. |
5 | Blei, D.M., Ng, A.Y., Jordan, M.I. ((2003) ). Latent dirichlet allocation. Journal of Machine Learning Research, 3: , 993–1022. |
6 | Blum, M.G., Nunes, M.A., Prangle, D., Sisson, S.A., et al.((2013) ). A comparative review of dimension reduction methods in approximate Bayesian computation. Statistical Science, 28: (2), 189–208. |
7 | Demšar, J., Curk, T., Erjavec, A., Gorup, Č., Hočevar, T., Milutinovič, M., Možina, M., Polajnar, M., Toplak, M., Starič, A., Štajdohar M., Umek, L., Žagar, L., Žbontar, J., Žitnik, M., Zupan, B. ((2013) ). Orange: data mining toolbox in Python. Journal of Machine Learning Research, 14: (1), 2349–2353. |
8 | Dumais, S.T. ((2004) ). Latent semantic analysis. Annual Review of Information Science and Technology, 38: (1), 188–230. |
9 | Dzemyda, G., Kurasova, O. ((2002) ). Comparative analysis of the graphical result presentation in the SOM software. Informatica, 13: (3), 275–286. |
10 | Hernández-Alvarez, M., Gomez, J.M. ((2016) ). Survey about citation context analysis: Tasks, techniques, and resources. Natural Language Engineering, 22: (3), 327–349. |
11 | Hmeidi, I., Al-Ayyoub, M., Mahyoub, N.A., Shehab, M.A. (2016). A lexicon based approach for classifying Arabic multi-labeled text. International Journal of Web Information Systems. 12: (4), 504–532. |
12 | Jocas, D. (2020). Lithuanian Stemming Algorithm. https://snowballstem.org/algorithms/lithuanian/stemmer.html. |
13 | Joulin, A., Grave, E., Bojanowski, P., Mikolov, T. (2016). Bag of tricks for efficient text classification. arXiv preprint arXiv:1607.01759. |
14 | Kapočiūtė-Dzikienė, J., Damaševičius, R., Woźniak, M. ((2019) ). Sentiment analysis of Lithuanian texts using traditional and deep learning approaches. Computers, 8: (1), 4. |
15 | Khan, J.Y., Khondaker, M.T.I., Afroz, S., Uddin, G., Iqbal, A. ((2021) ). A benchmark study of machine learning models for online fake news detection. Machine Learning with Applications, 4: , 100032. |
16 | Kharlamov, A.A., Orekhov, A.V., Bodrunova, S.S., Lyudkevich, N.S. ((2019) ). Social network sentiment analysis and message clustering. In: International Conference on Internet Science, pp. 18–31. Springer. |
17 | Kim, K., Chung, B.-s., Choi, Y., Lee, S., Jung, J.-Y., Park, J. ((2014) ). Language independent semantic kernels for short-text classification. Expert Systems with Applications, 41: (2), 735–743. |
18 | Kohonen, T. ((2012) ). Self-Organizing Maps, Vol. 30: . Springer Science & Business Media. |
19 | Krilavičius, T., Medelis, Ž., Kapočiūtė-Dzikienė, J., Žalandauskas, T. ((2012) ). News media analysis using focused crawl and natural language processing: case of Lithuanian news websites. In: International Conference on Information and Software Technologies, pp. 48–61. Springer. |
20 | LFND (2021). Lithuanian Financial News Dataset (LFND) (multi-labeled). https://www.kaggle.com/pavelstefanovi/lithuanian-financial-news-dataset-multilabeled. |
21 | Licen, S., Di Gilio, A., Palmisani, J., Petraccone, S., de Gennaro, G., Barbieri, P. ((2020) ). Pattern recognition and anomaly detection by self-organizing maps in a multi month e-nose survey at an industrial site. Sensors, 20: (7), 1887. |
22 | López, A.U., Mateo, F., Navío-Marco, J., Martínez-Martínez, J.M., Gómez-Sanchís, J., Vila-Francés, J., Serrano-López, A.J. ((2019) ). Analysis of computer user behavior, security incidents and fraud using self-organizing maps. Computers & Security, 83: , 38–51. |
23 | Minaee, S., Kalchbrenner, N., Cambria, E., Nikzad, N., Chenaghlu, M., Gao, J. ((2021) ). Deep learning–based text classification: a comprehensive review. ACM Computing Surveys (CSUR), 54: (3), 1–40. |
24 | Nanculef, R., Flaounas, I., Cristianini, N. ((2014) ). Efficient classification of multi-labeled text streams by clashing. Expert Systems with Applications, 41: (11), 5431–5450. |
25 | Park, C.H., Lee, M. ((2008) ). On applying linear discriminant analysis for multi-labeled problems. Pattern Recognition Letters, 29: (7), 878–887. |
26 | Ramage, D., Hall, D., Nallapati, R., Manning, C.D. ((2009) ). Labeled LDA: a supervised topic model for credit attribution in multi-labeled corpora. In: Proceedings of the 2009 Conference on Empirical Methods in Natural Language Processing, pp. 248–256. |
27 | Stefanovič, P., Kurasova, O. ((2011) ). Visual analysis of self-organizing maps. Nonlinear Analysis: Modelling and Control, 16: (4), 488–504. |
28 | Stefanovič, P., Kurasova, O. ((2014) ). Creation of text document matrices and visualization by self-organizing map. Information Technology and Control, 43: (1), 37–46. |
29 | Stefanovic, P., Kurasova, O. ((2014) ). Investigation on learning parameters of self-organizing maps. Baltic Journal of Modern Computing, 2: (2), 45. |
30 | Stefanovič, P., Kurasova, O., Štrimaitis, R. ((2019) ). The n-grams based text similarity detection approach using self-organizing maps and similarity measures. Applied Sciences, 9: (9), 1870. |
31 | Štrimaitis, R., Stefanovič, P., Ramanauskaitė, S., Slotkienė, A. ((2021) ). Financial context news sentiment analysis for the Lithuanian language. Applied Sciences, 11: (10), 4443. |
32 | Ueda, N., Saito, K. ((2003) ). Parametric mixture models for multi-labeled text. In: Advances in Neural Information Processing Systems, pp. 737–744. |
33 | Ultsch, A., Siemon, H.P. ((1989) ). Exploratory Data Analysis: Using Kohonen Networks on Transputers. Univ., FB Informatik. |
34 | Yoshioka, K., Dozono, H. (2018). The classification of the documents based on Word2Vec and 2-layer self organizing maps. International Journal of Machine Learning and Computing, 8: (3), 252–255. |


