
The effect of patient quality measurements and HCAHPS patient satisfaction on hospital reimbursements
Abstract
BACKGROUND:
The Centers of Medicare & Medicaid Services (CMS) links hospital reimbursements to quality metrics. Likewise, the Hospital Value-Based Purchasing (VBP) program offers financial incentives to acute-care hospitals based on performance improvements on several quality measures included in the national Hospital Consumer Assessment of Healthcare Providers and Systems (HCAHPS) survey. A research gap exists with regard to assessing the effectiveness of VBP incentives on improving the patient’s quality of care.
OBJECTIVE:
This study is to determine whether hospitals which reported better patient quality metrics and lower frequency of pressure sores received higher reimbursements.
METHODS:
The data were retrieved from the CMS Care Compare website utilizing matched data from 2297 US hospitals. Information on HCAHPS, the VBP Program in Patient Safety Index, and Reimbursements was obtained for this study. Partial Least Square (PLS) was utilized thru SmartPLS 3.0 to test the hypotheses.
RESULTS:
The results did not reveal any financial penalties when hospitals reported lower patient quality outcomes and increased numbers of pressure sores. However, lower patient quality measures were associated with lower patient satisfaction. Controversially, lower patient satisfaction scores were associated with higher reimbursement rates overall.
CONCLUSIONS:
The main contribution of this study reveals that the effectiveness of value-based reimbursements and the concept of continuous improvement is constrained due to the lack of unified measurement objectives across US healthcare institutions.
 Hui-chuan Chen is an Associate Professor in the College of Business and Global Affairs at the University of Tennessee at Martin. Her research is focused on the healthcare industry in quality management and operational efficiency.
 Tommy Cates serves as the Tom E. Hendrix Chair of Excellence in Free Enterprise in the College of Business and Global Affairs at the University of Tennessee at Martin. His research centers on healthcare issues and market forces in education and industry.
 Monty Taylor is a lecturer in the College of Business and Global Affairs at the University of Tennessee at Martin. His research interests include business human resource management, business writing, and healthcare.
1Introduction
According to the Centers for Medicare and Medicaid Services (CMS), US healthcare spending reached $4.1 trillion or $12,530 per person in 2020 which accounted for approximately 19.7% of the nation’s Gross Domestic Product [1]. Despite this level of health care expenditures, the US consistently ranks poorly on quality outcomes (e.g. infant mortality and childhood obesity) when compared to other developed countries. Specifically, the 2011 National Scorecard on US Health System Performance revealed poor overall performance. These issues have prompted a reevaluation of the national health care system with the goal of achieving improved quality outcomes while also reducing healthcare costs [2]. For decades, health care administrators have questioned the validity and reliability of patient satisfaction surveys. While these surveys are under scrutiny, they are still utilized although they are often criticized for inadequate reporting, lack of comprehensive psychometric analyses, and ignoring nonresponse bias [3]. In some instances, case studies have been used as the primary source of collecting patient satisfaction results. More recently, better validity and reliability of the survey data have improved the ability of researchers to apply their findings across a broader spectrum of institutions in healthcare. Nevertheless, irregular patient satisfaction measures fail to provide meaningful results if such evaluations cannot be compared before and after the necessary medical procedures, between patient populations, and among various settings [4]. Specifically, this present study considers the following questions: (1) In the VBP program, is a better patient safety index associated with higher reimbursements? (2) In the HCAHPS patient survey, does a better patient safety index led to higher HCAHPS ratings? (3) In the HCAHPS patient survey, do HCAHPS ratings affect reimbursement payment amounts?
The passage of the Affordable Care Act (ACA) facilitated development of the Partnership for Patients initiative. This initiative shifts the focus on quality of care to the patient perspective, thereby forcing hospitals to improve the quality of services provided or risk financial penalty [5]. The ACA has seemingly forced a shift in the economics of the US healthcare industry, along with a renewed focus on higher quality at lower costs— thereby leading to tremendous financial pressures on healthcare providers. These changes in healthcare delivery standards are forcing US hospitals to be more efficient by controlling expenditures and achieving industry-wide standards. In 2002, CMS utilized a survey instrument and data collection methodology to assess patient satisfaction in US hospitals which aligned with ACA’s initiative to consider the patient’s healthcare perspective. The Hospital Consumer Assessment of Healthcare Providers and Systems (HCAHPS) survey was the first quality standard for collecting patients’ perspectives of care; furthermore, the survey outcomes have been used to develop a database which provides valid hospital comparisons. The HCAHPS survey evaluates patient perspectives of care after discharge from a hospital stay [6]. The HCAHPS survey consists of the determining factors of the incentive system, thus putting more power in the hands of patients in the US health care system. Under this model, the information submitted by patients on the HCAHPS survey directly impacts provider revenue. Therefore, this financial incentive and reimbursement model strives to establish a healthcare system which prioritizes improved patient outcomes with an emphasis on the patient perspective [7].
Value-Based Healthcare is generally considered as the design for supporting the best management approaches in healthcare [8]. Hospital Value-Based Purchasing programs (VBP) are being implemented by CMS and other large payer organizations in an effort to increase the quality and efficiency of healthcare. One of the objectives for VBP was based on the national healthcare goal of associating 85% of Medicare payments to quality by 2016. The program encourages collaboration between hospitals and post-acute care providers by associating financial incentives with quality performance. The VBP program also incentivizes continual improvements, as future reimbursements can be influenced by previous performance [9]. The VBP program represents a historic shift to pay-for-performance in the US healthcare system. Specifically, the program utilizes the withholding of 2% of total reimbursement to incentivize quality achievement and improvement. Composite quality measures are based on clinical processes, patient perceptions of care, and 30-day mortality related to conditions such as heart failure, pneumonia, or acute myocardial infarction. However, a recent data analysis of results from the first 4 years of VBP failed to associate the program with improved clinical processes or patient experiences [10]. Although a significant reduction in pneumonia-associated mortality was identified, no significant reduction in mortality was demonstrated for patients with heart failure or myocardial infarctions. The analysis revealed insignificant results overall, indicating that the large national program has been ineffective in its first four years of implementation [11].
The Hospital-Acquired Condition (HAC) Reduction Program is part of the VBP program which connects Medicare reimbursement amounts to inpatient patient healthcare quality within the hospital setting. Each year, CMS assesses overall hospital performance by evaluating Total HAC Scores as the weighted average of scores on specific measurement ratings included in the program. For example, patient pressure ulcer rates are one of twenty-seven (27) targeted HAC scores. If a hospital’s HAC scores exceed the 75th percentile of all Total HAC scores, the hospital will receive reductions in reimbursements [12].
The HCAHPS surveys are a component of VBP’s quality measurements which include patient perceptions of care. Thus, CMS Hospital Inpatient Quality stipulates that a portion of a hospital’s 2% of reimbursement can be withheld, contingent upon reporting core measures of the HCAHPS data. Beginning in 2013, the Affordable Care Act of 2010 established the VBP financial incentive reimbursement arrangement for hospitals. Presently, hospitals are incentivized to improve performance rather than receiving “payments for reporting”. This performance measure utilizes HCAHPS data, along with other metrics, to determine each hospital’s overall VBP rating (i.e. score). This result is then used to determine the amount each hospital is eligible to receive in financial reimbursement or fined in the form of a penalty. The total amount withheld for each hospital began at one percent in FY 2013 and increased to two percent in 2017 [6]. Thirty percent of this amount is tied directly to HCAHPS performance [13]. Determining the extent to which VBP incentives reflect patient’s quality of care via HCAHPS and HAC scores is a worthwhile research gap that merits further study. In order to fill the existing lack of research on this topic, this present study may be the first attempt to assess the relationships among patient safety index (HAC), reimbursements, and patient satisfaction scores with the goal of identifying whether the VBP program effectively utilizes financial incentives to encourage US healthcare providers to improve clinical quality and achieve better patient satisfaction ratings. Furthermore, this study allows academic researchers an opportunity to investigate CMS healthcare data through the comprehensive VBP program perspective.
Hospitals must provide higher quality patient services and attain improved patient satisfaction ratings in order to obtain greater reimbursement amounts from CMS. Thus, the primary objective of this current study is to establish the actual relationship of patient safety outcomes on payments/reimbursements in order to determine if CMS effectively penalizes the hospitals which do not meet quality standards. The secondary objective of this study is to understand how patient safety index quality outcomes influence HCAHPS ratings, as well as the impact on reimbursement.
2Literature review and hypotheses
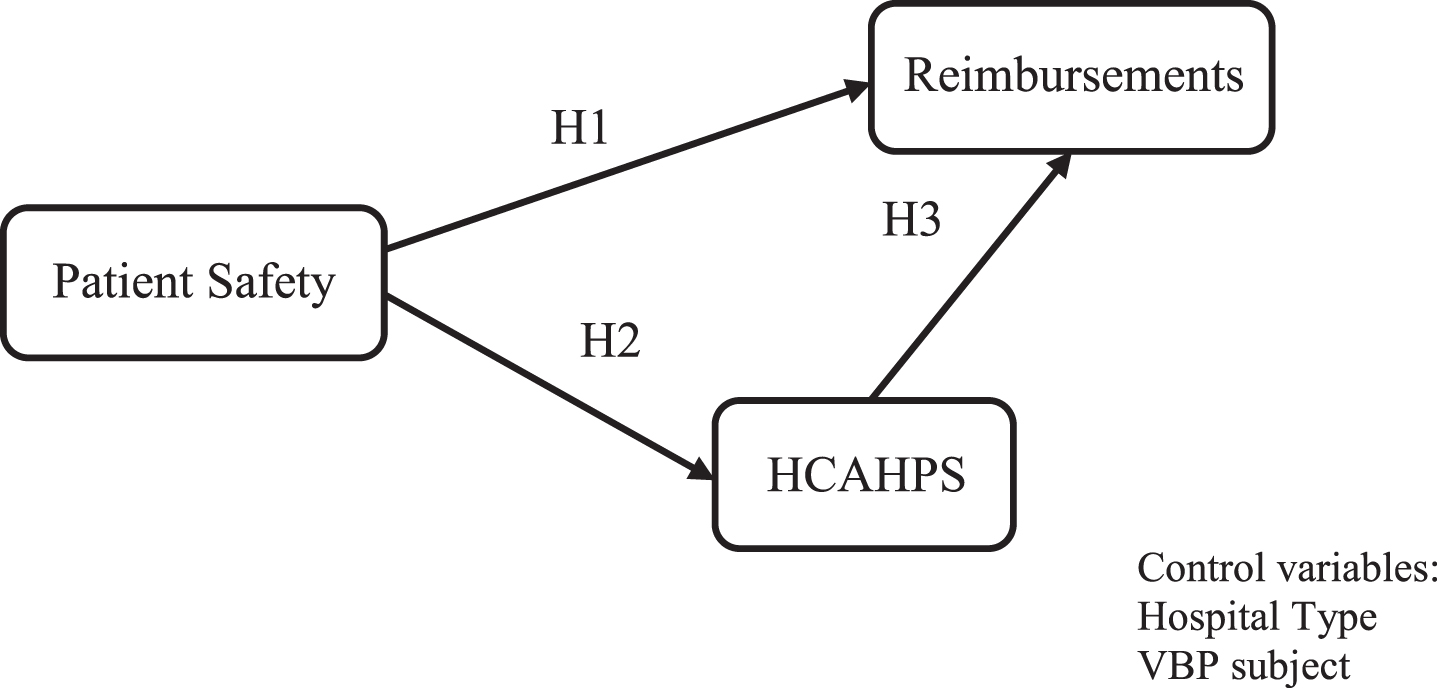
The research model for this study is shown in Fig. 1 Patient Safety and effects on HCAHPS and Reimbursements. The literature review for patient safety index includes ratings of hospital patients’ performance from the Hospital-Acquired Condition (HAC) Reduction Program, HCAHPS, and reimbursements is provided in this section, along with the research hypotheses.
Fig. 1
Patient Safety and effects on HCAHPS and reimbursements.
2.1Hospital value-based purchasing programs (VBP)
Beginning in 2003, CMS developed a process to provide financial incentives to hospitals which produce higher quality, more cost-effective care. The most prominent example of this process is a pilot project in 2003 based on pay-for-performance. The Premiere Hospital Quality Incentive Demonstration (HQID) tracked the outcomes of (1) acute myocardial infarction (AMI), (2) congestive heart failure (CHF), (3) pneumonia, (4) coronary artery bypass graft surgery, (5) hip and knee replacement surgery, and (6) perioperative management of surgical patients (including prevention of surgical site infections) through 2009 [14]. Incentivizing certain behaviors in hospitals to provide the highest quality of patient care and outcomes requires that measures of quality be very specific. Therefore, in 2005, CMS began utilizing a website (Hospital Compare Web) that allowed public access to data on hospital performance measures, including resource utilization, spending, clinical outcomes, and process quality. The VBP established a baseline level of performance for each hospital to compare outcomes to other hospitals (for a specific year) and to itself (for previous years). Establishing a baseline is important because errors at the beginning of a process improvement translate to problems in later time frames [15]. Random variation during the time a baseline is being set could show either higher or lower quality when compared to a steady state of the organization. In such cases, the improvement (or lack thereof) may be caused by this random error as the process improvement continues. Notably, these measures of outcomes may not be related to the existing processes. Likewise, subsequent morale issues among the employees may cause them to become disinterested in the process. The VBP uses larger sample sizes to avert such problems; however, not all process improvement measures have high reliability. These variations may be outgrowths from procedures that rarely occur in some hospitals. Thus, longer term use of VBP will require that CMS balance statistical reliability in the data while increasing the number of hospitals in the program. Adjustments may need to be made as the overall program progresses [16].
In 2016, approximately 60% of hospitals received total penalties or incentives of less than±$30,000 [17]. The maximum VBP penalties or financial bonuses were capped at+/-2% for the hospitals. Their results also indicated that the cumulative financial effects can significantly impact hospitals if the same institutions are receiving penalties each year. Carroll and Clement [16] studied the impact of the VBP program on the hospital’s organizational, community, and management characteristics. They found that 24% of the hospitals improved their VBP program performance. However, 11% of hospitals were being penalized each year. Results also showed that 18% of the hospitals performed well in the early years but experienced declines later. Thus, the contributions to the VBP program scores were associated with the different types of hospital characteristics. Many studies have demonstrated that VBP financial incentives positively impacts quality of care and patient safety [18–21]. Lee et al. [22] noted that the penalized hospitals changed their operations to reflect operational performance, thereby resulting in improved VBP metrics to enhance hospital operational outcomes and financial revenues. However, other studies have found that pay-for-performance programs such as VBP generate little or no improvements in patient outcomes [23–26]. Notably, some hospitals which participated in VBP were not impacted during the initial VBP implementation period [27]. As an example, one component of the VBP measurements is mortality rate; however, Figueroa et al. [15] indicated that VBP did not improve patient mortality rates from 2008 to 2013. Likewise, Mendelson et al. [28] found that VBP did not improve hospital cost efficiency.
2.1.1Hospital-acquired condition (HAC) reduction program
The Hospital-Acquired Condition (HAC) Reduction Program is part of the Medicare value-based purchasing (VBP) program which reduces payments to hospitals based on unsatisfactory performance of the hospital-acquired condition measurements. The HAC Reduction program pushes hospitals to utilize best practices to reduce patients’ rates of healthcare associated infections and to improve overall patient safety. CMS adjusts reimbursements to hospitals which rank in the worst-performance quartile (above the 75th percentile). Hospitals with all Total HAC scores greater than the 75th percentile will receive 1% payment reductions which apply to annual Medicare payments when CMS fulfills hospital claims [29]. The VBP program is supported by reducing a participating hospital’s payments based on its Total Performance Scores (TPS) each year. Specifically, CMS applied four quality domains and weights for FY 2021, including (1) clinical outcomes (25%), (2) person and community engagement (25%), (3) safety (25%), and (4) efficiency and cost reduction (25%) [30]. HAC measurements are partially applied from the VBP’s quality domains. Specifically, HACs are adverse events which contain two (2) areas of measurement sets. Area 1 measures consist of ten (10) patient safety indicators such as pressure ulcer rate, iatrogenic pneumothorax rate, in-hospital fall with hip fracture rate, postoperative respiratory failure rate, etc. Area 2 metrics include five (5) components of healthcare-associated infections (HAI), such as central line-associated bloodstream infection, catheter-associated urinary tract infection, etc. [31]. A study by Sankaran et al. [32] found that 724 hospitals which had received payments from CMS were penalized an estimated US$373 m for poor performance under the HAC in 2015; however, results indicated that receiving a financial penalty for poor quality does not necessarily affect subsequent behavior of the hospital staff, administration, or doctors. Certainly, some hospitals may be motivated to implement strong process improvement programs. However, the penalties may not change long term quality improvement efforts in other hospitals. For example, research suggests that hospitals which care for larger numbers of disadvantaged patients tend to be penalized more than other hospitals. If these hospitals do not improve their quality and thus continue to be penalized, the reduction in payments may produce long term problems that will tend to increase the gap between these hospitals compared to other hospitals which do not treat as many disadvantaged patients. Thus, HAC may have the effect of widening the differences between hospitals based on their patients’ ability to pay.
In 2007 to 2010, Maryland hospitals implemented the CMS-required clinical process-of-care measures aligned to hospital-acquired conditions with the goal of improving the quality of care in their state. As a result of implementing programs to improve metrics of hospital-acquired conditions, the hospital-acquired conditions rate in Maryland declined by 15.26% with an estimated cost savings of $110.9 million over two years [33]. Although the hospitals with high HAC scores might receive penalties, such consequences may not change existing efforts for quality improvement and could potentially reduce hospital resources over the long term [34]. Moreover, hospitals which are more likely to receive the lowest HAC scores may be providing care for more disadvantaged patients; as such, these institutions may lack sufficient resources to improve their HAC scores in response to penalization. This could lead to a long-term reduction in payments for these hospitals [35]. On the other hand, Rajaram et al. [36] found that hospitals with good accreditation, higher patient volumes, and those providing more advanced services with better performance on process-of-care were penalized more frequently in the HAC reduction program. However, several studies provide evidence that hospitals are motivated to improve through various quality improvement initiatives in order to avoid or recoup the penalizations from the VBP and HAC programs [20, 37, 38]. From the various studies described above, researchers found that VBP programs often negatively impacted the hospitals in their efforts to improve HAC scores. This effect occurred because the penalized hospitals might have insufficient resources or serve demographically disadvantaged areas. However, VBP programs have been successful in encouraging hospitals to find innovative methods to improve patient quality. For this current study, the first hypothesis involves whether the HAC program consistently reflects the CMS policies to penalize hospitals with lower patient quality outcomes. Thus, the first hypothesis is presented as follows:
Hypothesis 1: A higher Hospital Acquired Condition (HAC) Patient Safety score is associated with lower Reimbursements.
2.2Hospital consumer assessment of healthcare providers and systems (HCAHPS)
The Hospital Consumer Assessment of Healthcare Providers and Systems (HCAHPS) patient satisfaction survey is an instrument developed by the Centers for Medicare and Medicaid Services (CMS) and the Agency for Healthcare Research and Quality (AHRQ) to establish a standardized process for reporting patients’ perceptions of care. HCAHPS results have remained publicly available since 2008 [39]. A secondary outcome of the HCAHPS survey encompasses various domains, including nursing and physician communication, pain control, environmental factors, medication communication, quality of discharge information, as well as patient perceptions on the responsiveness of staff. For an institution to be considered a high performer in these domains, the hospital must score above the median in top-box responses for each survey question [40]. As described above, HCAHPS surveys are a component of VBP’s quality measurements which consist of patient experiences with regard to hospital care. Through the integration of HCAHPS scores into the value-based incentive payments, CMS has placed greater importance on patient satisfaction as an aspect of quality of care. The HCAHPS survey, in conjunction with changes in Medicare’s reimbursement practices, has placed great value on the patient experience. These changes in Medicare reimbursement policies tend to modify hospitals’ strategic management plans as they attempt to secure peak levels of reimbursement. In the past, successful Medicare policies were often replicated by the private sector within only a few years. Now, hospitals must learn to navigate these policy changes before private insurers implement similar policies [7]. While it is clear that delivering patient-centered care should be a priority for health care providers, it is not evident that patient satisfaction presents a direct link to patient safety or effectiveness of care. Various studies with the aim of developing direct associations among patient safety, satisfaction, and outcomes have failed to produce consistent results [39].
In 2013, all acute care hospitals in the United States (excluding those in Maryland) were eligible to participate in the VBP program. Exceptions to this opportunity were psychiatric hospitals, rehabilitation hospitals, long-term care facilities, children’s hospitals, and cancer hospitals. CMS had revised the payment process to encourage these facilities to improve clinical processes of care and patient experience of care. As such, hospitals were required to report at least ten cases each in at least four of twelve measures included in the clinical processes of care domain, and/or submit at least 100 completed HCAHPS. The HCAHPS survey serves as the standard means to measure satisfaction of patients and how they perceive hospital care. This instrument measures: 1) communication with nurses, 2) communication with doctors, 3) responsiveness of hospital staff, 4) pain management, 5) communication about medicines, 6) cleanliness and quietness of the hospital environment, 7) discharge information, and 8) overall rating of the hospital. Hospitals saw even higher financial incentives (or penalties) as the VBP program evolved based on their delivery of higher value care compared to previous incentives based on higher volume of patients and procedures. Due to such constraints, hospital policy makers and doctors should consider the various challenges when considering the merits of VBP in providing generally higher quality care to patients [14]. In 2015, HAC was added as part of the VBP program by CMS to reduce payments by 1% for hospitals when ranked above the 75th percentile of risk-adjusted total HAC scores. The HAC penalty emphasizes the necessity for hospitals to remain quality-focused and safety-focused, which could potentially influence their performance on patient satisfaction with care, another crucial performance metric tied to reimbursement.
One study by Menendez and Ring [31] assessed the correlation between HAC scores and HCAHPS patients’ perspectives of care measurements. They found that higher quality of care (which corresponds to a lower HAC score) is associated with a better patient experience (reflected by higher HCAHPS scores). Meanwhile, Silvera [41] stated that hospital size influences the relationship between patient safety patient experiences. With larger hospitals, the providers’ ability to deliver care might be less responsive to individual needs, thereby increasing the adverse events on patient safety. Tzeng et al. [42] provided a brief study of the relationship between the rate of pressure ulcers and in-patient satisfaction levels. Higher rates of pressure ulcers were associated with lower in-patient satisfaction levels, especially in staff responsiveness and nurses’ communication. A more in-depth study with Odom-Maryon et al. [12] explored the occurrence of hospital-acquired pressure ulcers with HCAHPS scores in Medicare patients 65 years or older. Their findings revealed that pressure ulcers occurred less frequently among patients who indicated higher patient satisfaction HCAHPS scores for quietness at night and satisfactory nurse communication. The majority of studies indicate that hospitals which provide better quality care usually receive higher patient satisfaction responses. Thus, the current study seeks to determine whether the VBP program actually reflects quality of care and patient responsiveness via HCAHPS regarding the care that they received. As such, the second hypothesis is presented as follows:
Hypothesis 2: A higher Hospital Acquired Condition (HAC) Patient Safety score is associated with lower HCAHPS.
It is intuitive that doctors who communicate well develop better relationships with their patients; likewise, better relationships tend to improve patient ratings of the quality of service for the hospital. Hospital administrators should stress open and clear communication between doctors and patients in order to avoid problems ranging from misdiagnoses to incorrectly following treatment plans. In one study, 75% of the orthopedic surgeons indicated that they communicated satisfactorily with their patients, but only 21% of the patients reported satisfactory communication with their doctors. This represents a dramatic difference in the perceptions of good communication between physicians and patients [43]. The actions of physicians and nurses consist of the largest element of the HCAHPS survey scores due to their extensive interaction with patients. Particularly, caring attitudes and good communication skills are strong predictors of trust and confidence in healthcare providers [44]. Therefore, the quality of communication by medical professionals serves as a crucial measure of perceived patient experiences in the HCAHPS survey.
Carter et al. [45] evaluated patient satisfaction/experience aspects before patients were discharged. In their study, patients were less likely to return to the hospital for further treatment if they were “very satisfied” with the overall care, and the physicians listened to them during their hospital stay. Hence, identifying patient demands prior to discharge may improve overall satisfaction scores. Cruz et al. [46] found that communication, teamwork, and good leadership are essential reasons for a well-designed discharge plan intervention. As a result, good discharge planning is associated with higher HCAHPS survey results. Likewise, patients with proper discharge plans were more likely to recommend hospitals where they had received treatment. In an earlier study, Merlino et al. [13] demonstrated that when treating patients with more severe illnesses, hospitals frequently obtained lower HCAHPS scores which possibly led to lower reimbursements from CMS. More recently, Jindal et al. [47] studied factors that influenced hospital penalties due to lower quality outcomes. They observed that a hospital was about 40% less likely to be penalized when a higher percentage of patients showed that their doctor communicated well and indicated that staff offered necessary information regarding discharge. Based on the above literature, higher quality care in hospitals is typically associated with higher scores on patient survey responses. Several studies have assessed the relationships regarding patient responses of the quality care and hospital incentives, as well as reimbursement impact. For the present study, patient responses to the quality of care surveys (HCAHPS) were tested to identify whether a relationship exists between HCAHPS scores and a hospital’s reimbursement from CMS. Thus, the third hypothesis is presented as follows:
Hypothesis 3: A higher HCAHPS score is associated with higher Reimbursements.
3Research methodology
3.1Data sources and characteristics
The Centers of Medicare & Medicaid Services (CMS) report various data on the Care Compare website regarding healthcare providers’ operations and quality measurement information on Doctors & Clinicians, Hospitals, Nursing homes, etc. The “Hospitals” data includes US hospitals’ quality ratings and patient satisfaction information on over 4,000 Medicare-certified hospitals. For the present study, various categories of secondary data were retrieved from the CMS “Hospitals” database for the analysis. Specifically, we utilize hospitals’ datasets for 2020 and coordinate the items of the Value-Based Purchasing Program (VBP) in the Patient Safety Indicator/Index, HCAHPS, and Reimbursement information. The Patient Safety Indicator (PSI) provides a patient’s safety indicator (e.g. pressure sores) which is indicated in a ratio format. The HCAHPS survey contains different publicly reported measures asking recently-discharged patients to evaluate various aspects of their hospital experience. The HCAHPS includes seven collective variables (Communication with Nurses, Care Transition, Recommend Hospital, Communication about Medicines, Communication with Doctors, Discharge Information, and Staff Responsiveness), two individual variables, and two global variables within each variable based on one to three questions with scales which range from 1 to 5. For example, the questions are related to how well nurses and doctors communicate with patients, how well the staff members communicate with patients about medicine, how responsive hospital staff are to patient needs, whether the patients would recommend the hospital to others, etc. Reimbursements include Medicare spending per beneficiary and Medicare hospital spending by claim which are listed in ratio and average spending format. Table 1: Definitions and Measurements of variables provides information regarding the variable definitions and survey questions for this study [48].
Table 1
Definitions and measurements of variables
| Patient Safety Indictor (PSI) | |
| PSI-90 | (1) composed of 11 National Quality Forum-endorsed measures |
| PSI-12 | (1) postoperative pulmonary embolism or deep vein thrombosis rate |
| PSI-03 | (1) Pressure ulcer rate |
| Reimbursements | |
| MSPB-1: Medicare spending per beneficiary | (1) Medicare Part A and Part B payments to a Medicare beneficiary. |
| Medicare hospital spending by claim inpatient | (1) Average spending per episode for inpatient admission |
| HCAHPS | |
| Communicate with Nurses | (1) During this hospital stay, how often did nurses treat you with courtesy and respect? |
| (2) During this hospital stay, how often did nurses listen carefully to you? | |
| (3) During this hospital stay, how often did nurses explain things in a way you could understand? | |
| Care Transition | (1) During this hospital stay, staff took my preferences and those of my family or caregiver into account in deciding what my health care needs would be when I left. |
| (2) When I left the hospital, I had a good understanding of the things I was responsible for in managing my health. | |
| (3) When I left the hospital, I clearly understood the purpose for taking each of my medications. | |
| Recommend Hospital | (1) Would you recommend this hospital to your friends and family? |
| Communication about Medicines | (1) Before giving you any new medicine, how often did hospital staff tell you what the medicine was for? |
| (2) Before giving you any new medicine, how often did hospital staff describe possible side effects in a way you could understand? | |
| Communication with Doctors | (1) During this hospital stay, how often did doctors treat you with courtesy and respect? |
| (2) During this hospital stay, how often did doctors listen carefully to you? | |
| (3) During this hospital stay, how often did doctors explain things in a way you could understand? | |
| Discharge Information | (1) During this hospital stay, did doctors, nurses or other hospital staff talk with you about whether you would have the help you needed when you left the hospital? |
| (2) During this hospital stay, did you get information in writing about what symptoms or health problems to look out for after you left the hospital? | |
| Staff Responsiveness | (1) During this hospital stay, after you pressed the call button, how often did you get help as soon as you wanted it? |
| (2) How often did you get help in getting to the bathroom or in using a bedpan as soon as you wanted? |
After eliminating all missing values, the data variables of HCAHPS, VBP (Patient Safety Index –PSI), and Reimbursements were utilized for this present study. The remaining total sample size of 2,297 acute care hospitals was applied for our data analysis. Please see Table 2: Sample hospital demographics and characteristics –frequency data by Region (Midwest, Northeast, South, and West) and Type of Hospital (Government, Not-for-Profit, and For-Profit). The hospitals are subject to the Value-Based Purchasing (VBP) Program which withholds specific reimbursement amounts due to low scores on relevant quality measurements. For this study, the control variables were the hospital’s ownership (i.e., Government, Not-For-Profit, For-Profit) and categorization of VBP subjects (i.e. CMS withholds some percentage of the reimbursement: Yes, No). Next, we analyzed the data by applying exploratory factor analysis (EFA) for data reduction to determine the number of constructs with the cutoff point set at 0.4. A total of sixteen (16) items were included in the EFA analysis to stipulate the number and patterns of common factors: Patient Safety (four items), HCAHPS (nine items), and Reimbursements (three items). The output provided three interpreted constructs, along with two or more items for each construct for a total of twelve (12) items to comprise the sample structure: Patient Safety (3), HCAHPS (7), and Reimbursements (2).
Table 2
Sample hospital demographics and characteristics –Frequency data
| Variable (n = 2297) | Frequency | Percent |
| Region | ||
| Midwest | 536 | 23.3 |
| Northeast | 399 | 17.4 |
| South | 870 | 37.8 |
| West | 492 | 21.5 |
| Type of Hospital | ||
| Government | 286 | 12.5 |
| Not-For-Profit | 1,567 | 68.2 |
| For-Profit | 444 | 19.3 |
| Hospitals Subject to adjust reduction reimbursements | ||
| No | 1,697 | 73.9 |
| Yes | 600 | 26.1 |
3.2Reliability and validity analysis
Reliability is assessed via Cronbach’s coefficient alpha and composite reliability (CR) on three scale constructs. The general principle for Cronbach’s alpha is specified as at least 0.6 as the lower limit for reliability [49]. In this present study, the Cronbach’s alpha (CA) values for Patient Safety, HCAHPS, and Reimbursements are 0.724, 0.812, and 0.922, respectively. Factor analysis was conducted to reduce item responses to a particular score for each of the three construct dimensions. Principle component analysis is used to summarize the original data into a range of scores. All composite reliability values are between 0.834 and 0.938, which indicates acceptable reliability as these values exceed 0.70. Please see Table 3: Measurement scales and Loadings.
Table 3
Measurement scales and loadings
| Construct /Indicator | Mean | Std. Dev. | Item loading |
| Patient Safety: (CA = 0.724 /CR=0.834 /AVE=0.629) | |||
| PSI-90: Serious complications | 0.997 | 0.198 | 0.909 |
| PSI-12: Serious blood clots after surgery | 3.604 | 0.949 | 0.756 |
| PSI-03: Pressure sores | 0.569 | 0.561 | 0.701 |
| Reimbursements: (CA = 0.812 /CR=0.914 /AVE=0.841) | |||
| MSPB-1: Medicare spending per beneficiary | 0.995 | 0.064 | 0.922 |
| Medicare hospital spending by claim inpatient: Avg_Spending_Per_Episode_Hospital | 2871 | 1131.5 | 0.912 |
| HCAHPS: (CA = 0.922 /CR=0.938 /AVE=0.683) | |||
| Communication with Nurses | 3.13 | 0.822 | 0.876 |
| Care Transition | 2.44 | 0.791 | 0.866 |
| Recommend Hospital | 3.50 | 0.970 | 0.823 |
| Communication about Medicines | 2.60 | 0.872 | 0.813 |
| Communication with Doctors | 2.96 | 0.914 | 0.807 |
| Discharge information | 2.83 | 0.906 | 0.806 |
| Staff responsiveness | 2.85 | 0.877 | 0.789 |
AVE=average variance extracted, CR = composite reliability, CA = Cronbach alpha.
The Variance Inflation Factor (VIF) is calculated to assess the presence of multicollinearity among the predictor variables: HCAHPS and Reimbursements. If the VIF is higher than 10, the possibility of multicollinearity would cause a concern. The VIF values in this study reveal that all indicators are less than 7, indicating that no collinearity issues exist. All average variance extracted (AVE) values range between 0.629 and 0.841 (at the construct level) which is greater than 0.5. This implies that convergent validity at the indicator and construct levels is validated. The square root of each AVE is examined for discriminant validity and should be greater than 0.7 [50] and exceed the related inter-construct correlations for reflective constructs. All the square roots of AVE are greater than the related inter-construct correlations. Heterotrait-monotrait (HTMT) ratio of correlation is further conducted to check for discriminant validity based on the variance-based view. Table 4: HTMT provides the specific construct values. All of the HTMT values (ranging from 0.112 to 0.434) from the comparison constructs are less than HTMT0.85 criterion values which indicates that no discriminant validity issues exist among the latent constructs. Therefore, discriminant validity is confirmed.
Table 4
HTMT results
| Patient safety | HCAHPS | Reimbursement | |
| Patient safety | |||
| HCAHPS | 0.125 | ||
| Reimbursement | 0.112 | 0.434 |
3.3Hypothesis tests and research results
For this present study, the research model (Fig. 1) is implemented and analyzed to assess causal relationships in the healthcare industry, especially in hospital settings using Partial Least Squares (PLS) modeling via Smart-PLS. PLS was implemented instead of covariance-based SEM because of PLS having no strict normality distribution assumptions for the data, and both formative and reflective constructs can be modeled within the same study [51]. Table 5 provides R2, f2, and Q2 output. The recommended value for R2 is that it should be higher than 10 percent [52]. The R2 value for endogenous variables HCAHPS and Reimbursement were 0.072 and 0.157, respectively. The value of f2 is an indicator of the effect size. The f2 values of 0.02, 0.15, and 0.35 are considered small, medium, ad large effects, respectively [53]. The f2 effect size for the predictive value of Patient Safety on Reimbursement and HCAHPS are 0.003 and 0.011, respectively, which shows that Patient Safety has a small effect in generating the R2 for Reimbursement and HCAHPS. By estimating the scale of the R2 value as a measure of predictive accuracy, Q2 values indicate the model’s predictive relevance if Q2 is greater than 0 [54]. Both Q2 values for HCAHPS and Reimbursement (0.069 and 0.044, respectively) are less than 0 which indicates that the model has rather low predictive relevance for these constructs. The bootstrap procedure of resampling (1,000 subsamples) is utilized to acquire the path coefficients, t-statistics, and the 95% confidence interval. The input for the partial least squares model estimations is based on scores of a total of three dimensions: Patient Safety, HCAHPS, and Reimbursements. The results for the present hypotheses are shown in Table 6: Summary for Hypothesis tests which lists the path coefficients, t-statistics, and 95% confidence interval.
Table 5
R2, f2, and Q2
| R2 | f2 | Q2 | ||
| Reimbursement | HCAHPS | |||
| Patient safety | 0.003 | 0.011 | ||
| HCAHPS | 0.072 | 0.130 | 0.069 | |
| Reimbursement | 0.157 | 0.044 | ||
Hypothesis 1 states that a higher Patient Safety score is associated with lower Reimbursements which would indicate a negative relationship. Based on the PLS-SEM output from Table 6, Patient Safety score is significantly related to Reimbursements (p < 0.01). However, Patient Safety shows a significant positive relationship (p < 0.01) with Reimbursement which indicates the opposite relationship expected in Hypothesis 1. This finding suggests that in spite of a higher patient safety index in serious complications, blood clots, and pressure sore rates, the hospital typically receives higher reimbursements for these patients with higher complication rates.
Table 6
Summary for hypothesis tests
| Path | PLS results | ||||
| Coefficient | T-stat. | 95% conf. interval | Supported or not | ||
| H1 | Patient Safety→Reimbursements | 0.055 | 2.83* | (0.016, 0.092) | Supported |
| H2 | Patient Safety→HCAHPS | –0.109 | 5.33* | (-0.150, -0.070) | Supported |
| H3 | HCAHPS→Reimbursements | –0.344 | 17.81* | (-0.382, -0.305) | Supported |
| Hospital Type→Reimbursements | 0.099 | 4.84* | (0.060, 0.140) | ||
| Hospital Type→HCAHPS | –0.022 | 9.69* | (–0.268, –0.182) | ||
| HAC Subjects→Reimbursements | 0.057 | 2.61* | (0.015, 0.099) | ||
| HAC Subjects→HCAHPS | –0.118 | 5.376* | (–0.161, –0.075) | ||
*p <0.01.
Hypothesis 2 states that a higher Patient Safety score is related to lower HCAHPS which indicates a negative relationship. The results from Table 6 reveal that Patient Safety and HCAHPS had a significant negative relationship (p < 0.01). This outcome provided the same results as originally stated in Hypothesis 2 because a lower score in Patient Safety ratings (indicating fewer complications) is related to higher patient satisfaction. According to the CMS website, lower hospital patient safety indexes are indicative of higher quality care. As such, this outcome implies that a lower patient safety rating for patients relates to a higher consumer (patient) assessment based on the consumer/patient ratings regarding doctors, nurses, medicine, staff, discharge procedures, care transition, and hospital recommendations.
Hypothesis 3 states that a higher HCAHPS score is positively related to higher Reimbursements. Based on the results presented in Table 6, a facility’s HCAHPS score is significantly related to Reimbursements (p < 0.01). However, HCAHPS and Reimbursements revealed a significant negative relationship (p < 0.01) which implies the opposite relationship predicted in Hypothesis 3. This finding suggests that although a hospital receives a lower rating on patient assessments, it may still obtain larger reimbursements from Medicare patient services.
For the current research model, two (2) control variables are utilized: Hospital Type and HAC subjects of withholding of reimbursements. The control variable— hospital ownership (Government, Not-For-Profit, For-Profit)— displays varied results for the dependent variables of Reimbursements and HCAHPS. Reimbursements is positively linked to the type of ownership which implies that For-Profit hospitals tend to obtain higher reimbursements from patient services compared to Government or Not-For-Profit hospitals. Additionally, For-Profit hospitals received lower HCAHPS compared to Government or Not-For-Profit hospitals. The control variable –HAC Subjects (Yes, No) withholding hospitals –provided different results for dependent variables of Reimbursements and HCAHPS. The hospitals subject to withholding payments still obtained higher reimbursements compared to the hospitals without being subject to withholding penalties. Nevertheless, the hospitals were subjected to CMS penalties of withholding payments due to lower HCAHPS scores.
4Discussion
This study investigated the impact of patient quality measures and patient responses regarding the quality of care on VBP penalty amounts. The empirical results provide statistically significant support for three hypotheses: (1) higher Patient Safety score is linked with lower Reimbursements, (2) higher Patient Safety score is related to lower HCAHPS, and (3) higher HCAHPS score is associated with higher Reimbursements. Even though the results for all three of hypotheses indicated statistically significant relationships, the findings revealed an opposite direction in the relationships for Hypothesis 1 and 3. The theorical implications are described below in order to explain the statistical results, the practical implications for health care industry professionals and stakeholders, as well as the limitations of this present study.
4.1Theoretical implications
Research question 1 predicted that a lower HAC score (i.e. better patient safety index ratings) would be associated with higher reimbursements. The actual results indicated that high “Patient Safety” (high HAC scores) were associated with higher “Reimbursements” for patient services, in contrast to the research hypothesis which predicted a negative relationship. These results are in alignment with the findings of Rajaram et al. [36] and Zuckerman et al. [35] which indicated that VBP incentive policies did not considerably increase reimbursements for the hospitals. Their findings indicated that hospitals with better performance on process care were still penalized more frequently. Thus, hospitals with higher HAC scores (due to pressure sores, for example) could still receive greater reimbursements. Furthermore, hospitals obtained higher payment amounts per episode of hospital admittance for Medicare beneficiaries even though the HAC scores remained high. For research question 2, does a low HAC score (i.e. better patient safety index ratings) lead to higher HCAHPS ratings? The results of this present study reveal that better “Patient Safety” index ratings (i.e. low HAC scores) are associated with higher HCAHPS ratings. These findings were similar to the results of several other studies [12, 31, 41, 42] noting that better patient safety is correlated with patient satisfaction. With regard to research question 3, do HCAHPS ratings affect reimbursement payment amounts? The results of this present study suggest that HCAHPS ratings were negatively related to reimbursement amounts. Although the patient/consumer gave lower HCAHPS scores, the hospitals still collected higher reimbursement payments from CMS. Thus, the results of this present study were in opposition to Hypothesis 3 which predicted the relationship would be positive, as indicated by the literature review. The above theoretical results contributed some evidence that the VBP program is not achieving its intended goal of penalizing hospitals with lower quality patient care. Indeed, when hospitals report lower patient quality of care and lower patient satisfaction, the hospital generally did not receive any financial penalty (i.e. decreased reimbursements). However, the results of this present study confirmed that lower patient quality care was associated with lower patient satisfaction.
4.2Practical implications
The findings of this present study indicate that data obtained from the CMS Care Compare website for the acute-care hospitals accurately reflect quality outcomes. Nevertheless, the VBP was not associated with financial incentives or penalties when the hospitals reported high patient safety issues. The VBP was designed to provide financial incentives to hospitals which consistently provide cost-effective, high-quality care for patients. However, the effectiveness of value-based reimbursement and the concept of continuous improvement is constrained due to a lack of unified measurement objectives across healthcare platforms. This process strongly enhances the concepts of hospital quality that impact patient outcomes. Meanwhile, other studies question the associations between improvements in quality and hospital reimbursements [15, 24, 27]. Additionally, incentivizing certain criteria from HCAHPS may produce unintended consequences. Attempts to improve scores on the HCAHPS criteria may cause hospitals to divert resources from certain activities that have yet to be emphasized by VBP. The stated goals for VBP (i.e. improving patient outcomes efficiently) may not reduce overall patient morbidity and mortality, nor improve patient satisfaction at lower costs. Nevertheless, by placing more power in the hands of patients within the US healthcare system, results of the HCAHPS survey have become a determining factor in the reward system of hospital payments. Consequently, the information obtained from patients on the HCAHPS survey directly impacts provider revenue. Since such policies are expected to remain in effect for the foreseeable future, healthcare administrators should develop processes and procedures to meet these demands.
4.3Limitations and future research
Several important limitations have been noted for this present study. First, several options exist to improve the VBP program. Rather than imposing a strict penalty for hospitals in the highest quartile, CMS should give progressively lower reimbursements for hospitals in the highest quartile of performance issues as measured by performance and patient satisfaction criteria. The Hospital-Acquired Condition (HAC) Reduction Program uses such a system, and it is more equitable. Second, legitimate concerns have been raised regarding comparisons between hospitals which serve more disparate populations as compared to competing providers. Hence, outcome measures should better represent local patient demographics. The suggestion would be to use a graduated scale for reduced reimbursement based on the percentage of disadvantaged patients that the hospital serves. This would protect hospitals which treat patients who have higher rates of chronic health issues, along with patients who cannot afford to pay for services rendered. Finally, this present study implies that the quality of healthcare is perceived not only from patients’ opinions of experience with physicians, nurses, or the environment, but also from the quality of outcome performance, such as patient safety in HAC scores. Notably, the findings of this present study show that a poor patient safety index is not related to lower reimbursement payments. Therefore, these results indicate weaknesses in the VBP’s policy of financially penalizing hospitals for poor patient safety ratings. Hence, existing quality measures in the healthcare industry may not completely and accurately reflect the performance of healthcare organizations and providers.
Future researchers may wish to consider the following suggestions. This present study was based on a single year of data. More extensive longitudinal studies should consider the patient safety index compared to payments over a minimum period of three years. Additionally, further research could determine whether the same hospitals with patient safety index ratings above the Medicare 75th percentile for three consecutive years, for example, still obtain the full amount of reimbursement without financial penalty. In order to create legitimate comparisons that are valid across all health care environments, stakeholders must reach a unified stance on the definition and assessment of quality. The VBP program includes five collective measurements (1. Mortality and complications, 2. Healthcare-associated infections, 3. Patient safety, 4. Patient experience, and 5. Efficiency and cost reduction). The present study primarily investigated patient safety and patient experiences. A full-scale study might consider including all five (5) collective measurements by comparing the impact of reimbursements on overall hospital quality.
5Conclusion
Hospitals in the US will face many challenges in the coming years. As such, incentivizing certain behaviors within hospitals in order to provide the highest quality patient care and desirable outcomes requires that measures of quality be specific and accurate. The hospital value-based purchasing (VBP) program is intended to provide financial incentives which enhance the performance of acute-care hospitals. The VBP program establishes a baseline level of performance for each hospital to compare the hospital to itself (in the past) and to other hospitals. Obtaining a baseline of performance is important because errors at the beginning of a process improvement are often associated with problems in later time frames. Longer-term use of VBP will require that CMS balance statistical reliability in the data with the increasing number of hospitals in the program. Adjustments may be necessary as the overall program progresses. HCAHPS comprises the patient’s view of specific experiences regarding services provided by hospitals. Thus, HCAHPS surveys are one of the defining elements for hospitals to collect the payments to financially support the hospital. One of the main contributions offered by the present study is evidence that higher payments from the government are related to higher patient evaluations of medical services obtained from the hospital. Thus, when patients provide lower service quality ratings of hospitals, these hospitals often obtain lower reimbursements. The Medicare VBP was established to penalize hospitals with higher patient safety index ratings. However, the novel contribution of this present study reveals that hospitals are not necessarily penalized for excessively high HAC scores. In fact, hospitals received larger reimbursements while having higher HAC scores. Consequently, US policy makers and healthcare providers should create procedures and policies based on appropriate comparisons which are valid across all healthcare environments. Likewise, stakeholders should seek to achieve a unified perspective on the definition and assessment of healthcare quality in order to enhance the long-term practices of the US healthcare industry.
Acknowledgments
The authors have no acknowledgements.
Author contributions
CONCEPTION: Hui-chuan Chen, Tommy Cates and Monty Taylor.
METHODOLOGY: Hui-chuan Chen.
DATA COLLECTION: Hui-chuan Chen.
INTERPRETATION OR ANALYSIS OF DATA: Hui-chuan Chen.
PREPARATION OF THE MANUSCRIPT: Hui-chuan Chen, Tommy Cates and Monty Taylor.
REVISION FOR IMPORTANT INTELLECTUAL CONTENT: Hui-chuan Chen, Tommy Cates and Monty Taylor.
SUPERVISION: Hui-chuan Chen.
References
[1] | Centers for Medicare and Medicaid Services. Historical. Available from: https://www.cms.gov/Research-Statistics-Data-and-Systems/Statistics-Trends-and-Reports/NationalHealthExpendData/NationalHealthAccountsHistorical. 2021. |
[2] | Spaulding A , Zhao M , Haley DR Value-based purchasing and hospital acquired conditions: Are we seeing improvement? Health Policy. (2014) ;118: (3):413–421. |
[3] | Hankins M , Fraser A , Hodson A , Hooley C , Smith H Measuring patient satisfaction for the quality and outcomes framework. British Journal of General Practice. (2017) ;57: (542):737–740. |
[4] | Voutilainen A , Pitkäaho T , Vehviläinen-Julkunen K , Sherwood PR Meta-analysis: Methodological confounders in measuring patient satisfaction. Journal of Research in Nursing. (2015) ;20: (8):698–714. |
[5] | Centers for Medicare and Medicaid Services. The affordable care act: Strengthening Medicare in 2021. Available from: https://www.cms.gov/newsroom/press-releases/affordable-care-act-strengthening-medicare-2011. 2012. |
[6] | Centers for Medicare and Medicaid Services. HCAHPS: patients’ perspectives of care survey. Available from: https://www.cms.gov/Medicare/Quality-Initiatives-Patient-Assessment-Instruments/HospitalQualityInits/Hospital-HCAHPS. 2017. |
[7] | Petrullo KA , Lamar S , Nwankwo-Otti O , Alexander-Mills K , Viola D The patient satisfaction survey: What does it mean to your bottom line. Journal of Hospital Administration. (2012) ;2: (2):1–8. |
[8] | Falivena C , Palozzi G Value-based healthcare paradigm for healthcare sustainability. In Accountability, ethics and sustainability of organizations. 133-153, Springer Cham; 2020. |
[9] | Norton EC , Li J , Das A , Chen LM Moneyball in Medicare. Journal of Health Economics. (2018) ;61: :259–273. |
[10] | Ryan AM , Krinsky S , Maurer KA , Dimick JB Changes in hospital quality associated with hospital value-based purchasing. New England Journal of Medicine. (2017) ;376: (24):2358–2366. |
[11] | D’Angelo ALD , Lawson EH Assessing quality in payment reform initiatives. Seminars in Colon and Rectal Surgery. (2018) ;29: (2):64–68. |
[12] | Odom-Maryon T , Hu HM , Tzeng HM Associations between hospital-level patient satisfaction scores and hospital-acquired pressure ulcer occurrences among Medicare stroke patients. Journal of Nursing Care Quality. (2019) ;34: (4):364–369. |
[13] | Merlino JI , Kestranek C , Bokar D , Sun Z , Nissen SE , Longworth DL HCAHPS survey results: Impact of severity of illness on hospitals’ performance on HCAHPS survey results. Journal of Patient Experience.. (2014) ;1: (2):16–21. |
[14] | Blumenthal D , Jena AB Hospital value-based purchasing. Journal of Hospital Medicine. (2013) ;8: (5):271–277. |
[15] | Figueroa JF , Tsugawa Y , Zheng J , Orav EJ , Jha K Association between the value-based purchasing pay for performance program and patient mortality in US hospitals: Observational study. BMJ. (2016) ;353: :i2214. |
[16] | Carroll NW , Clement JP Hospital performance in the first 6 years of Medicare’s value-based purchasing program. Medical Care Research and Review. (2021) ;78: (5):598–606. |
[17] | Bazzoli GJ , Thompson MP , Waters TM Medicare payment penalties and safety net hospital profitability: Minimal impact on these vulnerable hospitals. Health Services Research. (2018) ;53: (5):3495–3506. |
[18] | Benzer JK , Young GJ , Burgess JF , Baker E , Mohr DC , Charns MP , Kaboli PJ Sustainability of quality improvement following removal of pay-for-performance incentives. Journal of General Internal Medicine. (2014) ;29: (1):127–132. |
[19] | Mehrotra A , Damberg CL , Sorbero ME , Teleki SS Pay for performance in the hospital setting: What is the state of the evidence? American Journal of Medical Quality. (2009) ;24: (1):19–28. |
[20] | Roberts ET , Zaslavsky AM , Barnett ML , Landon BE , Ding L , McWilliams JM Assessment of the effect of adjustment for patient characteristics on hospital readmission rates: Implications for pay for performance. JAMA Internal Medicine. (2018) ;178: (11):1498–1507. |
[21] | Werner RM , Kolstad JT , Stuart EA , Polsky D The effect of pay-for-performance in hospitals: lessons for quality improvement. Health Affairs. (2011) ;30: (4):690–698. |
[22] | Lee SJ , Venkataraman S , Heim GR , Roth AV , Chilingerian J Impact of the value-based purchasing program on hospital operations outcomes: an econometric analysis. Journal of Operations Management.. (2020) ;66: (1-2):151–175. |
[23] | Damberg CL , Sorbero ME , Lovejoy S.L , Martsolf GR , Raaen L , Mandel D Measuring success in health care value-based purchasing programs: findings from an environmental scan, literature review, and expert panel discussions. Rand Health Quarterly. (2014) ;4: (3):9. |
[24] | Hong YR , Nguyen O , Yadav S , Etzold E , Song J , Duncan RP , Turner K Early performance of hospital value-based purchasing program in Medicare: A systematic review. Medical Care. (2020) ;58: (8):734–743. |
[25] | Houle SK , McAlister FA , Jackevicius CA , Chuck AW , Tsuyuki RT Does performance-based remuneration for individual health care practitioners affect patient care? A systematic review. Annals of Internal Medicine. (2012) ;157: (12):889–899. |
[26] | Ryan A , Sutton M , Doran T Does winning a pay-for-performance bonus improve subsequent quality performance? Evidence from the hospital quality incentive demonstration. Health Services Research. (2014) ;49: (2):568–587. |
[27] | Ryan AM , Burgess JF Jr , Pesko MF , Borden WB , Dimick JB The early effects of Medicare’s mandatory hospital pay-for-performance program. Health Services Research. (2015) ;50: (1):81–97. |
[28] | Mendelson A , Kondo K , Damberg C , Low A , Motúapuaka M , Freeman M , O’neil M , Relevo R , Kansagara D The effects of pay-for-performanceprograms on health, health care use, and processes of care: Asystematic review. Annals of Internal Medicine. (2017) ;166: (5):341–353. |
[29] | Centers for Medicare and Medicaid Services. Hospital-acquired condition reduction program (HACRP). Available from: https://qualitynet.cms.gov/inpatient/hac. 2018. |
[30] | Centers for Medicare and Medicaid Services. The hospital value-based purchasing (VBP) program. Available from: https://www.cms.gov/Medicare/Quality-Initiatives-Patient-Assessment-Instruments/HospitalQualityInits/Hospital-Value-Based-Purchasing-. 2021 |
[31] | Menendez ME , Ring D Do hospital-acquired condition scores correlate with patients’ perspectives of care? Quality Management in Healthcare. (2015) ;24: (2):69–73. |
[32] | Sankaran R , Sukul D , Nuliyalu U , Gulseren B , Engler TA , Arntson E , Zlotnick H , Dimick JB , Ryan AM Changes in hospital safety following penalties in the US hospital acquired condition reduction program: Retrospective cohort study. BMJ. (2019) ;366: :I4109. |
[33] | Calikoglu S , Murray R , Feeney D Hospital pay-for-performance programs in Maryland produced strong results, including reduced hospital-acquired conditions. Health Affairs. (2012) ;31: (12):2649–2658. |
[34] | Markovitz AA , Ryan AM Pay-for-performance: disappointing results or masked heterogeneity? Medical Care Research and Review. (2017) ;74: (1):3–78. |
[35] | Zuckerman RB , Sheingold SH , Orav EJ , Ruhter J , Epstein AM Readmissions, observation, and the hospital readmissions reduction program. New England Journal of Medicine. (2016) ;374: (16):1543–1551. |
[36] | Rajaram R , Chung JW , Kinnier CV , Barnard C , Mohanty S , Pavey ES , McHugh MC , Bilimoria KY Hospital characteristics associated with penalties in the centers for Medicare & Medicaid services hospital-acquired condition reduction program. Jama. (2015) ;314: (4):375–383. |
[37] | Chen M , Grabowski DC Hospital readmissions reduction program: Intended and unintended effects. Medical Care Research and Review. (2019) ;76: (5):643–660. |
[38] | Ibrahim AM , Dimick JB , Sinha SS , Hollingsworth JM , Nuliyalu U , Ryan AM Association of coded severity with readmission reduction after the hospital readmissions reduction program. JAMA Internal Medicine. (2018) ;178: (2):290–292. |
[39] | Kennedy GD , Tevis SE , Kent KC Is there a relationship between patient satisfaction and favorable outcomes? Annals of Surgery. (2014) ;260: (4):592. |
[40] | Tevis SE , Kennedy GD Patient satisfaction: Does surgical volume matter? Journal of Surgical Research. (2015) ;196: (1):124–129. |
[41] | Silvera GA The moderating role of hospital size on the relationship between patient experience and patient safety. Quality Management in Health Care. (2017) ;26: (4):210–217. |
[42] | Tzeng HM , Hu HM , Yin CY Relationship between inpatient pressure ulcer prevalence and patient satisfaction levels based on US Medicare’s Hospital Compare data. Journal of Clinical Nursing. (2015) ;24: :1730–1732. |
[43] | Belasen A , Belasen AT Doctor-patient communication: A review and a rationale for using an assessment framework. Journal of Health Organization and Management. (2018) ;32: (7):891–907. |
[44] | Shepherd AJ , Cowie J , Beattie M An exploration of how domains of quality of care relate to overall care experience. International Journal of Health Care Quality Assurance. (2019) ;32: (5):848–856. |
[45] | Carter J , Ward C , Wexler D , Donelan K The association between patient experience factors and likelihood of 30-day readmission: A prospective cohort study. BMJ Quality & Safety. (2018) ;27: (9):683–690. |
[46] | Cruz LC , Fine JS , Nori S Barriers to discharge from inpatient rehabilitation: A teamwork approach. International Journal of Health Care Quality Assurance. (2017) ;30: (2):137–147. |
[47] | Jindal RP , Gauri DK , Singh G , Nicholson S Factors influencing hospital readmission penalties: are they really under hospitals’ control? Decision Support Systems. (2018) ;110: :58–70. |
[48] | Centers for Medicare and Medicaid Services. System requirements specification hospital downloadable database data dictionary. Available from: https://data.cms.gov/provider-data/sites/default/files/data_dictionaries/hospital/HospitalCompare-DataDictionary.pdf. 2022. |
[49] | Nunnally JC Psychometric Theory. McGraw-Hill, New York. 1978. |
[50] | Chin W Issues and opinion on structural equation modeling. MIS Quarterly. (1998) ;22: (1):7–16. |
[51] | Peng D , Lai F Using partial least squares in operations management research: A practical guideline and summary of past research. Journal of Operations Management. (2012) ;30: (6):467–480. |
[52] | Hair JF , Sarstedt M , Ringle CM , Gudergan SP Advanced issues in partial least squares structural equation modeling. Sage Publications. 2017. |
[53] | Cohen J Statistical power analysis for the behavioral sciences, 2nd ed. Lawrence Erlbaum, Hillside, NJ. 1988. |
[54] | Hair JF , Sarstedt M , Ringle CM , Mena J An assessment of the use of partial least squares structural equation modeling in marketing research. Journal of the Academy of Marketing Science. (2012) ;40: (3):414–433. |


