
An open educational resource to introduce data analysis in Python for the Humanities
Abstract
The article presents an open educational resource (OER) to introduce humanities students to data analysis with Python. The article beings with positioning the OER within wider pedagogical debates in the digital humanities. The OER is built from our research encounters and committed to computational thinking rather than technicalities. Furthermore, we argue that students best learn with the ‘whole game’ methodology. Learners need to be exposed to meaningful activities as soon and as far as possible. The article presents two examples that implement our approach. The first introduces Python as a data analysis language to students of the humanities. It is different because it concentrates on the principles of the computational thinking behind data analysis rather than programming details. The second example takes the students into the world of machine learning and the whole game of social and cultural research with it. Students learn useful skills such as web scraping but will also run their own machine learning algorithms to follow concrete research questions.
1.Introduction
In his inspiring book, Inayatullah (2022, p. 2) asks ‘[i]f we treat teaching as if it were impossible and learning as unlikely, what can we find in the classroom?’ For him, what is left after ‘the impossible’ are the ‘encounters with students and colleagues’ that lead to new pedagogical developments and learning from each other. We find this idea of encounters a good principle with which to approach teaching programming to non-computer science students. Programming is often perceived as scary and inaccessible to all but an elite few (Liebenberg et al., 2015). Yet teachers must still aim to support an inclusive and unfragmented learning experience that is not limited to a select few students who ‘get it’. This article presents the teaching materials of our Open Educational Resource (OER) for the DiMPAH project, which introduces programming and data analysis to non-expert humanities students based on encounters we had with them and colleagues in the digital humanities.
Since digital humanities have established themselves within universities in academic units and departments, its best teaching practices have been discussed. This expanding, rich debate is just a couple of years old, as digital humanities have mainly started off as research-focussed environments. Introducing his ground-breaking book, Hirsch (2015, p. 3) criticises that pedagogy is often an afterthought in the digital humanities. He calls it ‘bracketing’ or the ‘relegation of the word “teaching” (or its synonyms) to the status of afterthought’. But he also thinks that digital humanities are moving away from this research primacy because working with students has become part of digital humanities research. The link between the research culture of digital humanities and teaching has been extensively picked up. Brier (2012) provides an overview of how this culture works in practice at City University of New York. Cohen and Scheinfeldt (2013, p. 4) bring together an edited book exploring digital humanities ‘hacking’ and ‘the need to move past the stagnation of the lecture into deeper, (…) – and ultimately, more effective – pedagogy.’
Writing in Hirsch’s edited volume, Stephen Ramsay is one the authors who could already report back on years of experience teaching programming to humanities students. According to him, teaching programming to humanists should be about developing ‘computational thinking’ in all students rather than about a limited set of engineering techniques. Computational thinking is defined as ‘thinking with many levels of abstractions, use of mathematics to develop algorithms, and examining how well a solution scales across different sizes of problems (Denning, 2009, p. 28). It is about reaching ‘an evolving representation’ (Denning, 2009, p. 30). According to Ramsey, such computational thinking is complementary to ‘humanistic thinking’, which is a ‘particular form of engagement that characterises the act of building tools, models, frameworks and representations for the traditional objects of humanistic study’ (Ramsay, 2015, p. 24). Teaching programming in the humanities has to link the evolving representations of computational thinking to humanistic thoughts.
These are the debates that have motivated the development of the open educational resources we present in this article. Encounters with students and colleagues have driven much of the principles and choices of platforms, while the direction of all our teaching materials is informed by our own research practices and an emphasis of linking computational and humanistic thinking. After discussion in the DiMPAH consortium, the first open educational resource (OER 1) has furthermore the double aim of introducing students to data analysis with Python, which we discuss in Section 3, and providing basic insights into a more advanced computational analysis with Python, as presented in Section 4. But first we provide some further background on the OER itself.
2.Foundations of OER 1 – educational principles and platforms
OER 1 is supposed to introduce students to Python as a data analysis language. Data analysis has a strong tradition, very established methods, and a broad range of applications in culture, economy, and society (O’Sullivan, 2022), but is not often taught in existing curricula in humanities faculties Our aim was thus to create novel interactive learning experiences to target especially students and other groups generally untrained in data analysis. Students should gain knowledge about the theoretical and practical foundations of data analysis in the humanities – bringing together computational and humanistic thinking. The teaching units in OER 1 address this aim by focussing as much as possible and as soon as possible on real-life datasets and interesting research questions, as our encounters with colleagues and students have taught us. They build upon each other in order to offer humanities students a chance to develop their own data analysis and machine learning skills.
There is a growing number of open educational resources for data analysis and machine learning we can build upon. Initiatives like The Carpentries (2022) already teach computational and data skills to a global community. Like them, our course is organised around the Jupyter notebook platform (Project Jupyter, 2022) which are brought together as a GitBook (2022) – integrating all the notebooks into one structured online book. Jupyter is a web-based computing environment, often used with the Python programming language (Python, 2022) but other languages are also available. Its notebooks contain both computer code and richtext elements including visualisations, maps or interactive elements. Content is shared within cells, which are the building blocks of notebooks for both code and text. Structured into cells, notebooks are human-readable as well as executable documents for data analysis.
Jupyter is as close as possible to the experiences of data analysis beyond the classroom. Its notebook documents provide a complete and reproducible record of a computation and can be shared with others, version-controlled and converted to a wide range of static formats like HTML or slides (Beg et al., 2021). They have thus become a de facto standard for presenting data, code, visualisations as well as results and are widely employed to introduce procedures, models and algorithms for data analysis and machine learning. Getting used to them early means learners can continue their education at their own pace beyond the classroom and autonomously.
Notebooks are also seen as an effective tool to teach programming to existing programmers and novices alike. Vial and Negoita (2018) and Barba et al. (2019) describe how the described affordances of notebooks are especially suited to help novice learners understand programming. They allow students to become autonomous learners, because they ‘integrate code and documentation without mixing them’ (Vial & Negoita, 2018, p. 12). Notebooks make it easier to follow the function of smaller code blocks that can nevertheless be embedded in a wider story, enriched by various multimedia elements. According to Barba et al. (2019) Jupyter notebooks can be used to enrich teaching experiences from creating lessons to experimenting with new learning practices and encouraging students to keep learning. The authors report how they successfully managed to introduce students to coding as a form of ‘translation’, converting a problem step by step into a coded solution.
Notebooks are already widely used in the digital humanities for research (Lavin, 2016; Tan, 2021) as well as open-source educational resources, which makes sharing and repurposing them easy. We have worked with them for years, as have many of our colleagues. William Mattingly has created a series of YouTube tutorials to introduce Python to humanities scholars using notebooks (Mattingly, 2022). The Programming Historian website is based on extended notebooks (Programming Historian, 2022). Melanie Walsh won for her GitBook ‘Introduction to Cultural Analytics and Python’ (Walsh, 2021) the 2021 digital humanities award for best training materials. These courses are, however, generally focussed on technical experiences such as doing text analysis or geographical mapping. Following the discussions in the introduction and the idea of linking computational with humanistic thinking, we attempt to develop a more methods-based approach, introducing technology as a means to answer particular research questions.
Our approach of putting research question and methods first is inspired by David Perkins’ revolutionary ‘whole game’ educational methodology, where students’ efforts are perceived as immediately meaningful and worthwhile, allowing them to experience the big picture rather than learning to ‘do later’ (Perkins, 2010). Our simplified introductory version of data analysis for the humanities will involve less complex programming or easier theoretical descriptions. Yet, this approach still presents the whole workflow and essential theoretical considerations. Students learn how to split up the data analysis into separate tasks, each of which has designated tools. They also find out about data considerations and experience limitations of the approach. For Perkins (2010), the aim is the bigger picture and not to defer meaningful experiences to future. Teaching programming, we spend too much time on teaching students the syntax of a loop, e.g., without making clear why, when and where students need repeated actions for the analysis of humanities data. ‘Playing the whole game’, we should move as soon as possible to experiences that are meaningful and worthwhile.
Notebooks provide an excellent way of structuring teaching into an organised whole game, as they afford different types of media as well as code and theoretical explanation. Videos, images, etc. can be embedded in notebooks to form a story and enrich the student experience and their learning progress towards the whole game. To develop meaningful stories with notebooks, we first needed to find datasets and interesting examples that help students see the relevance of this work for their own research interests. The first data analysis unit ends with a simple structured dataset about death penalties, the specifics of which we introduce further down in the article. In the second unit, students are given structured datasets with excerpts of the US Congress’s decision-making as well as a classical anthropological research datasets and finally historical data. Each dataset is critically evaluated in context. We took a long time to find data examples and prepare them in a way that students at the right level can learn from them.
Figure 1.
An example notebook in Google Colab.
Choosing a language for the units was easier. Python and R dominate as the languages of choice for training data scientists and using machine learning. We decided to employ Python as it is employed in the rest of the DiMPAH suite of OER courses as well. Unfortunately, the current DARIAH-teach environment does not support many of the relevant Python technologies as well as the direct integration of Jupyter notebooks. So, we recreated the general context of the notebooks within DARIAH-teach as well as the introduction and background section of each notebook. Then, we link out to a GitBook including a link to Google Colab (see Fig. 1), where students can execute the notebooks directly (Google Colaboratory, 2022).
In summary, our OER 1 environment follows our own research and teaching encounters and translates these into learning-by-doing and engaging interactive stories using real-life data that should be relevant to students’ research interests. Learning can be self-directed, but the environment is also ideally suited to be linked to other teaching innovations such as the flipped classroom, a pedagogical approach swapping in-class and homework teaching strategies (Bishop, 2013). In the following sections, we explore the two teaching units we deployed with our environment for OER 1 (see Fig. 2).
Figure 2.
The course structure in DARIAH-teach.
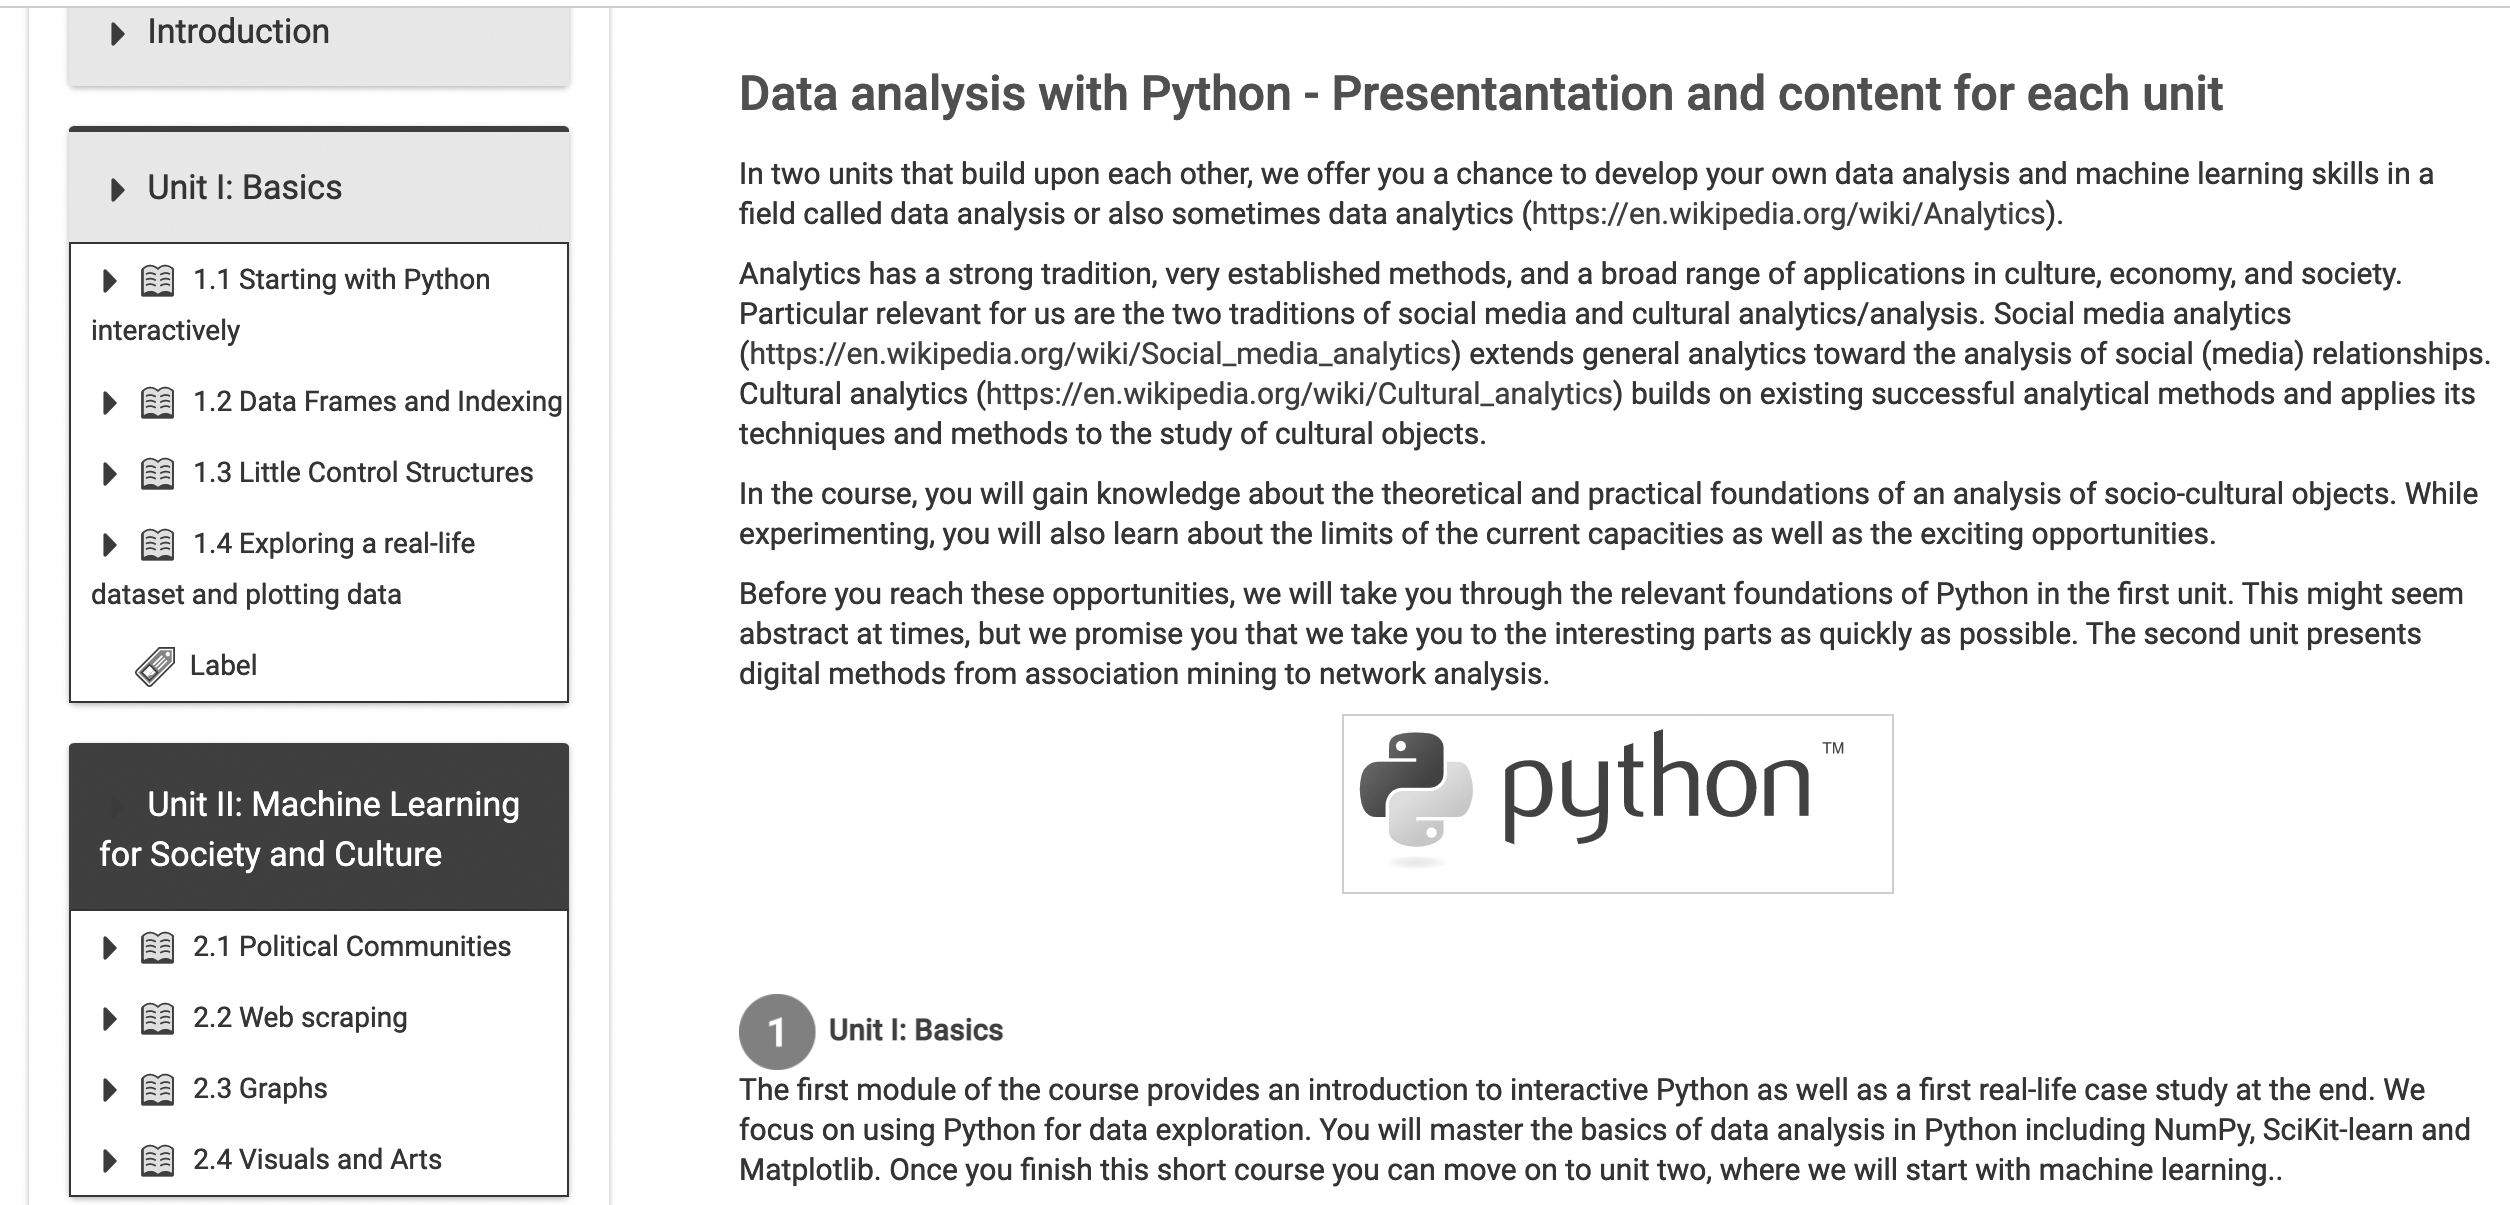
Section 3 discusses our first unit, which provides the basics of interactive Python as well as a first real-life case study at the end. For the basics, the module first covers diverse topics from understanding how one can move in Python from basic data structures to advanced dataframes. At the end, students have gained a good overview for Python for data exploration and the basics of visualisation. They then master the foundations of data analysis in Python with a number of different toolkits and are able to apply it to their first real-life use case analysing race relations in the US justice system. Once this unit is completed, students can move on to the second one about basic machine learning, which is discussed in Section 4. They are introduced to association mining to analyse communities of practice in the history of US parliaments. We also employ network analysis to split up a small community network into groups and clusters before finally learning more visualisation and image analysis techniques.
3.Introduction to Python for humanities data analysis
In this section, we cover the classes to introduce Python data analysis to humanities students in introductory lessons. We assume that the students do not have much experience with programming but are interested in experimenting with it for the analysis of research questions. We make clear at the beginning that there is a distinction here between learning to program and learning data analysis or even data science. Programming in a language like Python constitutes a number of possible application domains such as web development or implementation of larger enterprise-level applications. Data analysis makes use of programming languages like Python but focuses on abilities like sorting through and analysing smaller- and larger-scale information in order to understand what insights might be hidden in it or which relations come out of it. This constitutes an important difference in the implied computational thinking and is relevant to the research in the digital humanities.
Data analysis focuses on making meaning and supporting the understanding of decision-making of humans, which is something humanities students should have already experienced in other contexts. We teach students applied data science that uses key components of the Python ecosystem like NumPy, SciPy or Pandas and keeps the rest of this very rich programming language to a minimum. Following the ‘whole game approach’, we emphasize overall ideas and computational thinking rather than the maths computer scientists would be interested in. The aim is to enable students to justify the algorithms and data structures they use to solve a particular problem but not necessarily be able to develop their own. If they want to learn more, we point them to additional online free resources, to make clear it is only the beginning of a much longer journey.
The structure of the first unit is:
1.1 Starting with Python interactively 1.1.1 The first lesson 1.1.2 Python lists 1.1.3 Arrays 1.2 Dataframes and Indexing 1.2.1 Dataframes 1.2.2 Dataframe Indexing 1.3 Little Control Structures 1.3.1 If-statements and for loops 1.4 Exploring a real-life dataset and plotting data 1.4.1 Death penalties in Florida 1.4.2 Basic Plotting
3.1Getting started with humanities data analysis
In our experience, it is useful to link data analysis using programming languages to experiences students might already have had in other environments. We tried to follow this idea in this first part of this module, the Introduction to Data Analysis with Python. Here, we designed the first class so that it resembled the experience of a calculator, starting with numerical operations before moving on to symbolic manipulations with Python strings. We also introduce the concept of variables based on the experience students might have when saving simple values in their calculators.
The second session then presents the most common way of storing several values together, which is the list in Python. Here, for the first time we concentrate on the elements of a Python object that are important for data analysis. So, rather than introducing loops to iterate over lists we present ways of slicing and dividing lists and immediately transition to the idea of NumPy arrays in the third session. While they are very similar to lists, many highly useful analysis operations are possible only with NumPy arrays, which can be later on used with real-life data. They can be easily reshaped, transposed, etc., and can be made into multidimensional matrices and arrays. This is why they are such a core ingredient of image manipulation in Python, which we will talk about in the second unit. They also offer a range of highly effective element-based operations.
At the end of the first part on data analysis with Python, dataframes are presented, which are the most important data structure in Python to store and process data using a library called Pandas. We introduce dataframes as close to computational thinking about objects and their attributes. They have many operations we have already introduced for matrices and arrays and can handle different types of data. Just like matrixes, dataframes are two-dimensional and have rows and columns. They can hold different types of variables in each of their columns. This way, we can record many observations in the world, which will have different attributes we associate with it. For instance, flowers can be of different types and colours. With dataframes, we can record each observation of flowers by recording it in rows and assign to the columns the various features we observe like colour, type, etc. Python was not the first language to have dataframes for data analysis but has only become such an important skill because it has the Pandas library, which is built around dataframes.
OER1’s first module thus introduces what students need from Python in order to gather, clean and prepare data based on specific research questions. While this first module mainly provides data in order for students to practise related data-wrangling skills, it is made clear that this is only the first step. Students are quickly introduced how to download simple datasets, before we continue with day-to-day data acquisition techniques in the digital humanities.
3.2The first real-life data analysis
The second part of introduction to data analysis with Python covers more advanced topics in data analysis like visualisation and indexing and also leads to the first realistic data analysis investigating racial biases. This part benefits from collaborative exchanges of the students via the various DiMPAH learning platforms. Students have to increasingly find their own solutions and ask their peers for help. In this part, we first introduce more programming fundamentals like loops and control statements as they are necessary to work with data in Python. As much as possible we follow set-based approaches to datasets rather than row-by-row iterations in order to make clear the distinction of data analysis and other types of programming. To this end, we make substantial use of the earlier discussions of arrays in NumPy. Similarly, we introduce dataframe indexing in Pandas, which can be tedious, but is highly effective in processing the data as a whole.
Figure 3.
Part of the EDA of Florida death penalties.
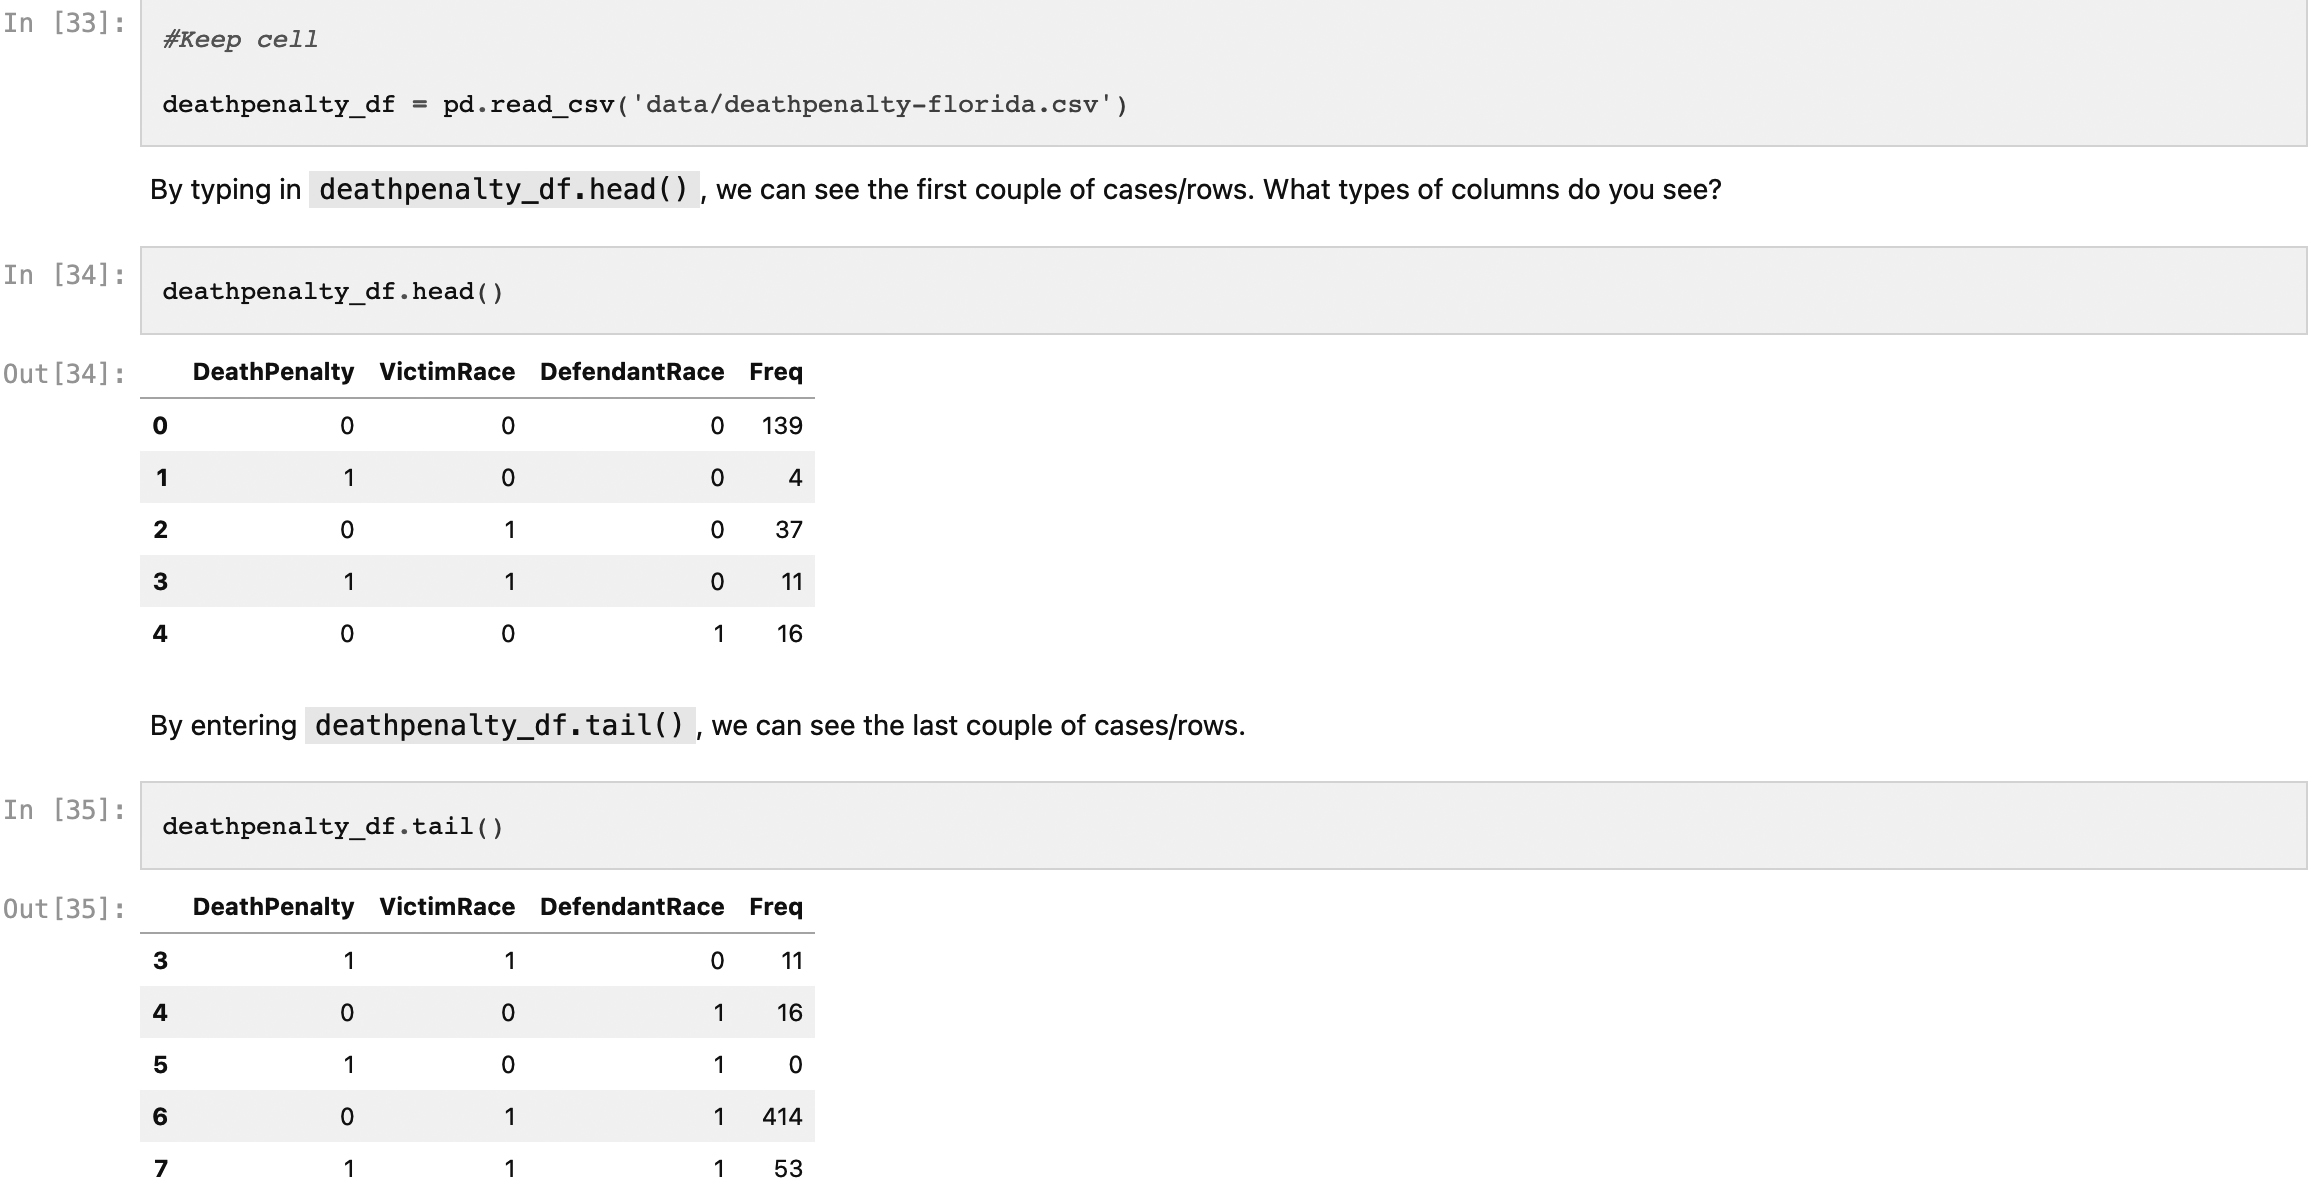
However, the main objective of this second part of the first unit is to lead as quickly as possible to real-life work with motivating datasets, which are close to humanities interests. Applying the learned knowledge, students are asked to analyse a historical snapshot of death penalties; working through a detailed example of data exploration and analysing a very small part of the complex question of racism in the USA (see Fig. 3). The course also presents data exploration as a data analysis technique and develops with it the whole story of Florida’s history of death penalties. To this end, we make use of the full power of notebooks, as introduced in the Introduction. Students could conduct a similar analysis with other datasets because the Florida notebook is reusable.
According to the classic introduction to the field by Tukey (1977), Exploratory Data Analysis (EDA) is focussed on what the data can tell us rather than coming with a pre-defined hypothesis. It includes techniques for summarising data as well as visualising it. Especially for cultural datasets, data exploration is much more than its standard definition as the initial exploration of datasets before more advanced techniques are applied. Learning EDA, allows students to understand the importance of generating their own hypotheses and get a feel of the data. This is especially important in the humanities, as the research processes are often much more open-ended and are not defined by looking for a clear target.
To explore the ways of summarising data, we discuss Florida death penalties with a dataset that covers judgements of defendants in cases of multiple murders in Florida between 1976 and 1987. The cases all have features that (a) describe whether the death penalty was handed out, (b) the recorded/assigned race of the defendant and (c) the recorded/assigned race of the victim. To introduce the session, we start by discussing with the students the problems of assigning race as binaries in datasets and point to historical issues statistical analysis has with racial bias. There is extensive literature analysing the problematic history of early statistics, like the case of the famous statistician Ronald Fisher, who was also an eugenicist.
In the practical exercises of this part, we show how to apply classical EDA following Tuckey to the dataset of death penalties in Florida (see Fig. 3), calculating basic summary statistics and pointing towards the analytical difference between averages and medians, as it is very important in critical social research. Students learn that critical knowledge is often not gained from the absolute numbers directly but from hidden relations. The data might show a low proportion of black people receiving the death penalty, but it also shows that over 70% of death penalties for black people were for killing a white person, while none of the death penalties for white people in the Florida of the time were given for killing a black person. The final session of the first module covers with basic visualisation another part of EDA. Typical data summary plots are introduced such as line graphs and box plots, and how they can be built by incrementally adding graphical elements like axes, titles, colours, etc.
4.Machine learning with a social twist
Figure 4.
The course in the International Artificial Intelligence Doctoral Academy.
The second unit further explores interactive data analysis with Python. Students work through several research use cases using basic machine learning. For instance, we present association mining to analyse communities of practice and network analysis to split up a small community network into groups and clusters. Overall, the unit contains six smaller sessions organised in three themes, which all follow our principle of methodology and research first before we start with any technical engineering. The unit’s first theme is community analysis covering not only how to understand political communities computationally but also how to access web data. The second theme investigates the growing importance of using network analysis in the humanities before the third one continues our earlier discussions on visualisations and introduces basic image analysis. All parts have been tested and evaluated in several classes at King’s College London and the University of Amsterdam. Figure 4 shows how the course is furthermore deployed within the International Artificial Intelligence Doctoral Academy as a short course for social sciences and humanities students.
The structure of the second unit is:
2.1 Political Communities and Clustering 2.2 Web Scraping 2.3 Graphs 2.3.1 Making Graphs from Data 2.3.2 Graph Visualisation 2.4 Visuals and Arts 2.4.1 Advanced Visualisation 2.4.2 Image Analysis
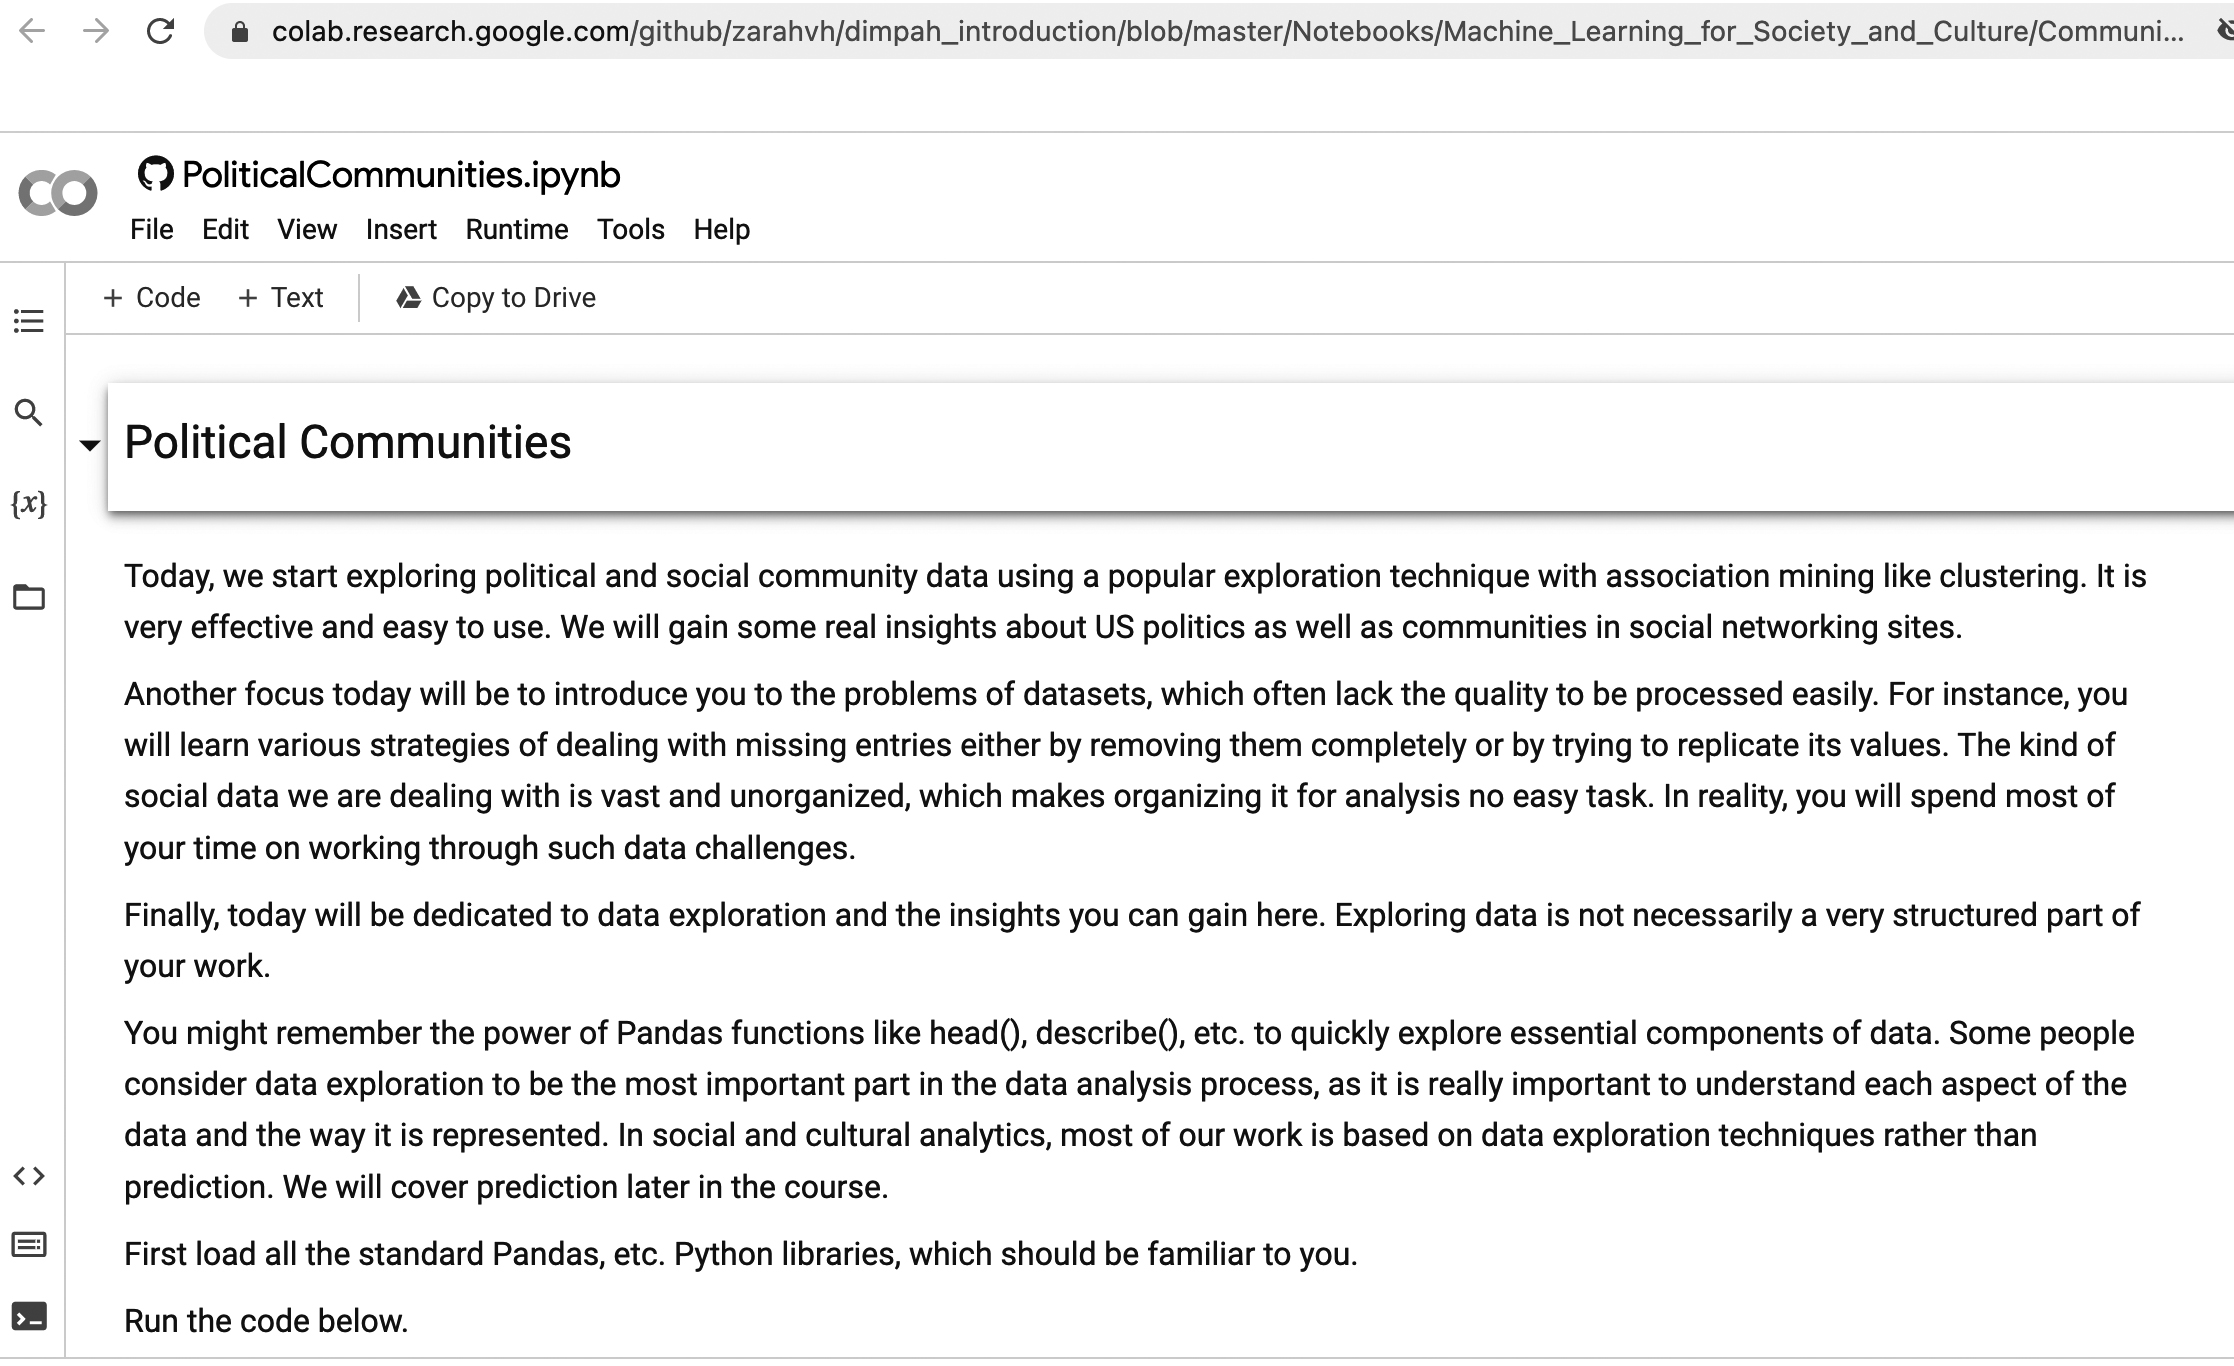
4.1Exploring communities of practice with association mining
The first part of this module explores political and social community data using a popular exploration technique and in particular association mining and clustering. Again, we rely on the idea to introduce students to data analysis by exposing them as soon as possible to real-life research use cases. Here, they gain insights into US politics as well as communities in social networking sites. Another pivot is to introduce the problems of cultural datasets, which often lack the quality to be processed easily. Students learn, e.g., about strategies of dealing with missing entries either by removing them completely or by trying to replicate its values. The kind of data we are dealing with is vast and unorganised, which makes preparing it for analysis not an easy task.
We familiarise students with the power of digital methodologies and data exploration to advance research with a well-established but powerful method called clustering, which is closely related to the understanding of communities of practice. For a particular historical moment of the US Senate, we wanted to find which communities of practice are formed through actively supporting and voting for bills, which might differ from official party affiliations. We chose the US Senate as the data is fairly easy to access and it is formed by two big parties and their alliances (DataQuest, 2022). This makes the exploration of communities of practice easier, as we just need to investigate whether the two official allegiances are frequently broken over the daily issues of politics.
We employ the basics of clustering that delivers powerful results very fast. In particular, we use the k-means algorithm, which was invented by MacQueen in the late 1960s (Cf. Steinley, 2006). Despite being relatively old, k-means is still widely used, because it delivers good results with great performance. For us, however, it has mainly the advantage that it takes as an input k or the number of clusters the dataset should be split into. We can use k to experiment whether we can find an optimal distribution of the Senate’s voting behaviour. Students learn that a computational analysis can indeed show how senators form in this historical situation smaller allegiances beyond the two major parties. They can also see who the outliers were and who generally did not vote with their parties. Again, the power of notebooks is to present these stories across cells of documentation and executable code combined with multi-media further exploration.
In the second part of the first session, students learn how to download and access data from the web. Among other practices, they have to scrape US senate data from Wikipedia. This is a complex task and linked to questions of representation, which humanities students should be familiar with. The data is often messy, as all the content on the web is presented in HyperText Markup Language (HTML) (Vaughan-Nichols, 2010). HTML is not made for data access but for presenting web content in a universal way. It also contains so-called hyperlinks that allow web users to jump from web content to web content. When deploying this this part, we have to frequently adjust the steps in the US Senate story, as the data is changing by further edits on Wikipedia. At the end, students have learned how to analyse election challenges in a parliament that is of great contemporary interest.
4.2From networks to visuals
The second theme of the machine learning module introduces network analysis and the visualisation of complex socio-historical data. For students to understand the long tradition of network analysis and its humanistic relevance, we use one of the classical anthropological research examples. Zachary’s karate club is a social network of friendships of 34 members of a karate club at a US university in the 1970s. It is described in (Zachary, 1977) and an early example of successful social network analysis. Zachary presents how during the study a conflict between the administrator and instructor led to the club being split into two. Half of the members formed a new club around the instructor; the other members looked for a new instructor or left karate altogether. Using network analysis, Zachary shows how to correctly assign the members to one of these two groups.
Figure 5.
Part of the analysis of the Karate network.
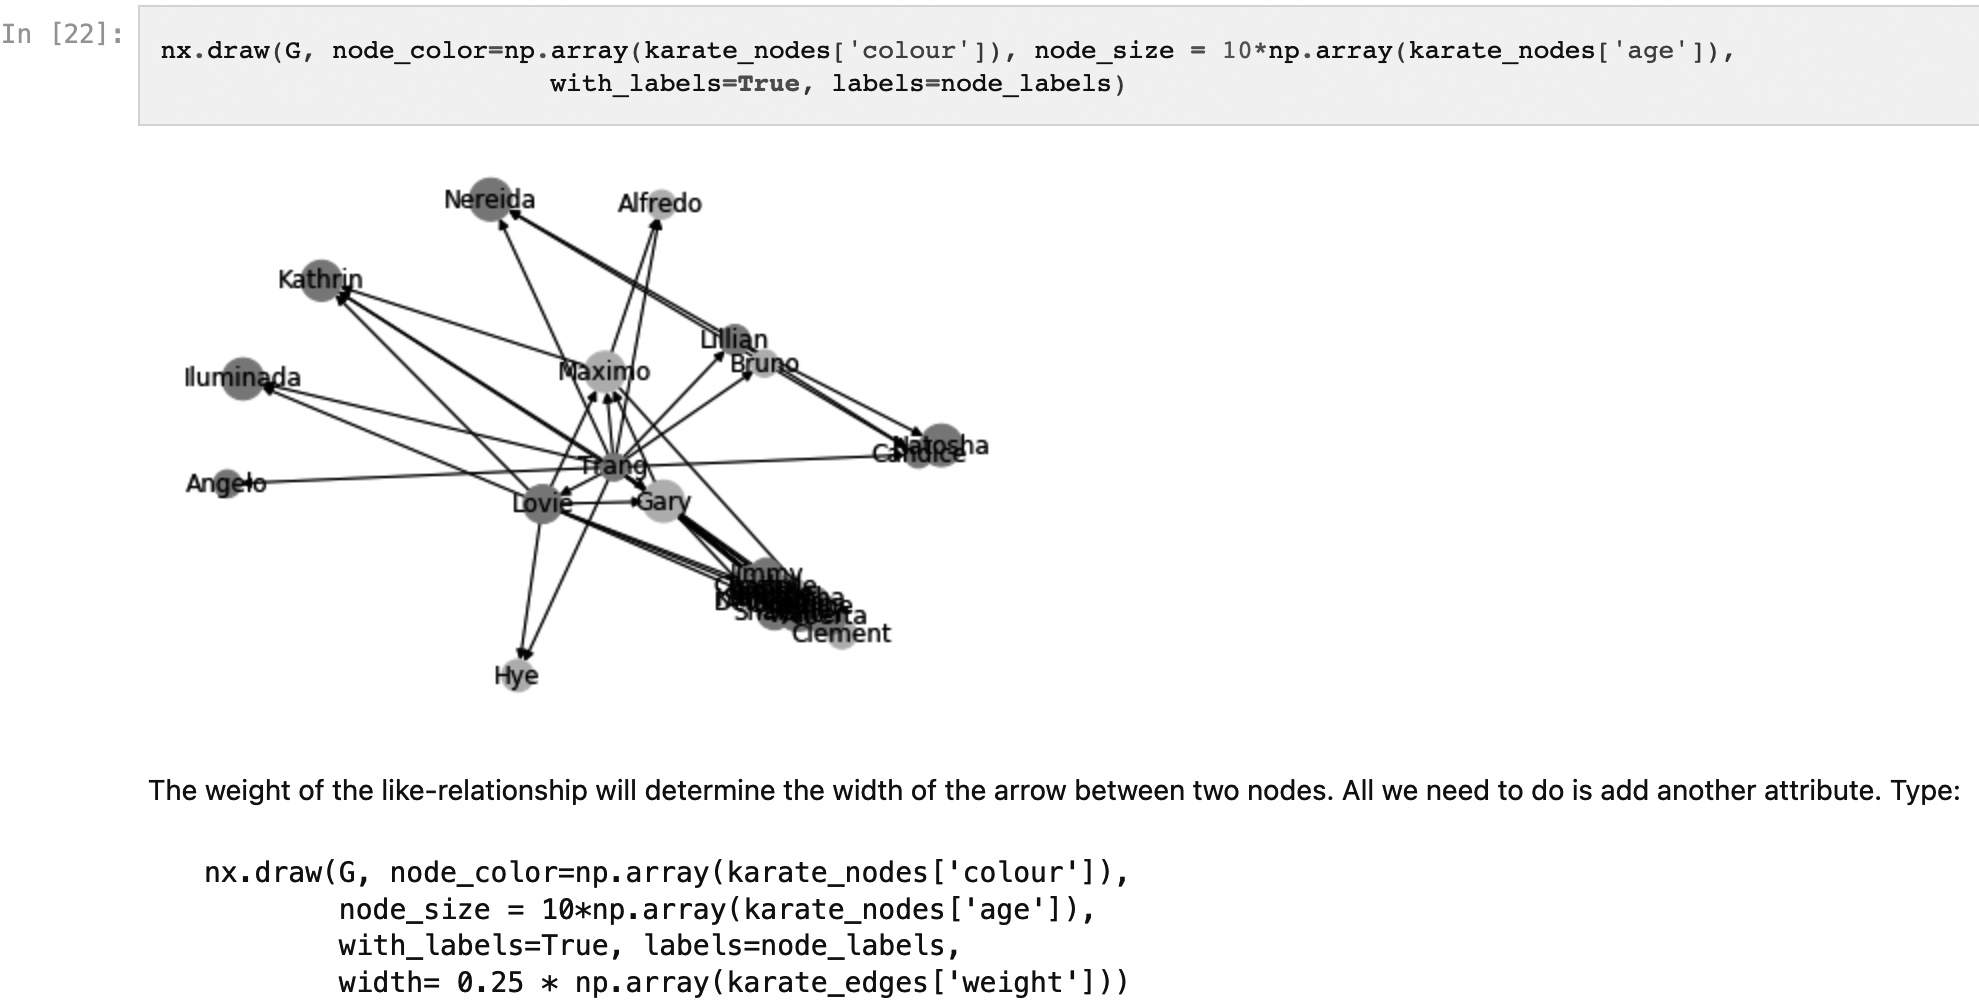
Working on Zachary’s study, students are invited to recreate the analysis from this famous research paper, which is an essential skill in data analysis. To this end, they have to find out about the way all data in networks is represented as either edges or nodes, both of which can have further attributes. While we provide some introductory links, students are encouraged to explore this vast field together autonomously and recognize its importance in digital humanities. Using the Python library networkx, students learn how to create their own network and manipulate it based on its attributes (see Fig. 5). They are challenged to visualise the karate club network experimenting with different layouts. Finally, they gain an understanding of how to run a cluster analysis with networks. The clusters clearly show which groups the members belong to as well as where the potential breaking points are that then led to the split. Reimplementing research papers is immensely important in data analysis and is employed here as another example of the whole game approach.
Visualisation and image analysis are key components of digital humanities. In the final theme of the second module, we pick up visualisation and visuals in more detail. This time the aim is to introduce students to a highly realistic example and the challenges of visualising incomplete, inconsistent humanities data. In line with the heritage objectives of the DiMPAH project, we have created a dataset that covers museum exhibits in the Tate family in the UK and the MoMA in New York. Both are at the forefront of how to publish their statistics for analysis. Students learn how to download museum open data from GitHub. The museums are also brand names that will provide students with the feeling to really be involved in realistic environments. We transport them into a situation where they work for either museum.
Several arts museums around the world publish their collections’ metadata online. New York’s Museum of Modern Art (MoMA) collection data is widely used (MoMA, 2022). Of special interest is their artworks’ information. The data is refreshed monthly and fairly large with over 50 MB at the time of writing, of which we select a sample for students. Whereas in the previous exercise we asked students to reimplement a research paper on the splitting of the karate network, here they are supposed to work for MoMA. One of their managers has asked them to create a visualisation showcasing the development of the museum stock. They should show how the stock has developed in recent years and visualise it. While experimenting they learn how to build graphs from data by iteratively adding visual elements. For the UK’s Tate galleries, students are given attendance data with visitor numbers since 2006. There are five galleries spread across the UK. While working through another whole game of plotting data, students learn about the principles of ‘tidy data’ (Wickham, 2014). Tidy data according to Wickham matches the structure and meaning of a dataset. It takes care that every column in a dataset is a variable, every row corresponds to an example observation, and every cell is a single value.
Producing visuals of data is, however, not the only visual method, as the students learn in the final session of the second unit. In digital humanities, the analysis of images and other multimedia has become more and more important (Drucker, 2015). Students learn that basic image manipulation is actually based on simple structures because images are matrices and can be manipulated just like any other matrix. It is again just another question of representation. In the case of images, they are matrices of pixel values. Images are complex not because they are especially difficult data structures but because they contain so many pixels, each of which also generally consists of different colour combinations to define their particular colour. Thus, images in Python are three-dimensional matrices, with two dimensions reserved for the two screen axes while the third dimension provides the colour. In the module’s final session, students begin to understand that even a complex topic such as image transformations is based on manipulating data structures they already know, which are in this case matrices across three dimensions.
5.Conclusion
This article has introduced our contribution to the fast-growing debate of open educational resources in the digital humanities. Built around research encounters, supportive of student-led learning and committed to computational thinking rather than technicalities, we believe that students learn best with the ‘whole game’ approach. They need to be exposed to meaningful activities as soon and as far as possible. This means finding datasets and methods that make a difference in the humanities but are also adequate for beginners. In the article, we present datasets about the problems of racial and social inequalities and how to critically assess it. Parliamentary diversity is as much a topic as regional differences in museum data. Jupyter notebooks that can be deployed and reused with a marginal investment in infrastructure are well suited for the whole game. They can be embedded in several local teaching environments, should speak to a diverse group of students and should provide them with an understanding of methodologies and technologies useful for their future.
The article has presented two DiMPAH units that follow our approach. The first introduces Python as a data analysis language to students of the humanities. It is different because it concentrates on the principles of the computational thinking behind data analysis rather than programming details. It foregrounds dataframes and thinking in sets. Despite being an introduction, the module quickly exposes students to the whole game of an EDA to understand racial inequalities. It finally offers future possibilities for data visualisation. The second unit takes students into the world of machine learning and the whole game of social-cultural research with it. Students learn useful skills such as web scraping but will also run their own machine learning algorithms to follow concrete research questions. They are furthermore asked to reimplement a famous anthropological research paper by working together. Their computational thinking is honed by finally introducing them to the fact that images are just another data type that can be manipulated in the same way as other data they have already got to know.
References
[1] | Barba, L.A., Barker, L.J., Blank, D.S., Brown, J., Downey, A.B., George, T., Heagy, L.J., Mandli, K.T., Moore, J.K., Lippert, D., Niemeyer, K.E., Watkins, R.R., West, R.H., Wickes, E., Willing, C., & Zingale, M. ((2019) ). Teaching and Learning with Jupyter. https://jupyter4edu.github.io/jupyter-edu-book/, Accessed 10/6/22. |
[2] | Beg, M., Taka, J., Kluyver, T., Konovalov, A., Ragan-Kelley, M., Thiéry, N.M., & Fangohr, H. ((2021) ). Using Jupyter for reproducible scientific workflows. Computing in Science & Engineering, 23: (2), 36-46. doi: 10.1109/MCSE.2021.3052101. |
[3] | Bishop, J., & Verleger, M.A. ((2013) ). The Flipped Classroom: A Survey of the Research. In 2013 ASEE Annual Conference & Exposition, pp. 23.1200.1-23.1200.18. Available at: https://peer.asee.org/the-flipped-classroom-a-survey-of-the-research (Accessed: 13 February 2023). |
[4] | Brier, S. ((2012) ). Where’s the Pedagogy? The Role of Teaching and Learning in the Digital Humanities. In M.K. Gold (Ed.), Debates in the Digital Humanities. University of Minnesota Press. pp. 390-401. doi: 10.5749/minnesota/9780816677948.003.0038. |
[5] | Cohen, D., & Scheinfeldt, J. ((2013) ). Hacking the Academy: New Approaches to Scholarship and Teaching from Digital Humanities. digitalculturebooks. doi: 10.3998/dh.12172434.0001.001. |
[6] | DataQuest ((2022) ). Tutorial: K-means, Dataquest. Available at: https://www.dataquest.io/blog/topics/data-science-tutorials/page/20/&cd=2&hl=en&ct=clnk&gl=nl (Accessed: 13 February 2023). |
[7] | Denning, P.J. ((2009) ). The profession of IT. Beyond computational thinking. Communications of the ACM, 52: (6), 28-30. doi: 10.1145/1516046.1516054. |
[8] | Drucker, J. ((2015) ). Graphical Approaches to the Digital Humanities. In A New Companion to Digital Humanities. New York: John Wiley & Sons, Ltd. pp. 238-250. doi: 10.1002/9781118680605.ch17. |
[9] | Gitbook ((2022) ). GitBook – Where technical teams document. Available at: https://www.gitbook.com/ (Accessed: 13 February 2023). |
[10] | Google Colaboratory ((2022) ). Google Colaboratory. Available at: https://colab.research.google.com/ (Accessed: 13 February 2023). |
[11] | Hirsch, B.D. ((2015) ). Digital Humanities and the Place of Pedagogy. In Digital Humanities Pedagogy: Practices, Principles and Politics. London: Open Book Publishers. pp. 3-30. http://books.openedition.org/obp/1613. |
[12] | Inayatullah, N. ((2022) ). Pedagogy as Encounter: Beyond the Teaching Imperative. https://rowman.com/ISBN/9781538165119. |
[13] | Lavin, M. ((2016) ). Using Jupyter Notebooks to Build Code Literacy and Introduce Digital Humanities. Bucknell University Digital Scholarship Conference. https://digitalcommons.bucknell.edu/digital-scholarship-conference/budsc2016/workshop/2, Accessed 10/6/22. |
[14] | Liebenberg, J., Huisman, M., & Mentz, E. ((2015) ). The relevance of software development education for students. IEEE Transactions on Education, 58: (4), 242-248. doi: 10.1109/TE.2014.2381599. |
[15] | Mattingly, W. ((2022) ). Python Tutorials for Digital Humanities – YouTube. Available at: https://www.youtube.com/pythontutorialsfordigitalhumanities (Accessed: 13 February 2023). |
[16] | MoMA ((2022) ). The Museum of Modern Art (MoMA) Collection. Available at: https://github.com/MuseumofModernArt/collection (Accessed: 13 February 2023). |
[17] | O’Sullivan, J. ((2022) ). The Bloomsbury Handbook to the Digital Humanities. London: Bloomsbury Publishing. |
[18] | Perkins, D. ((2010) ). Making Learning Whole: How Seven Principles of Teaching Can Transform Education (1st edition). San Francisco (CA): Jossey-Bass. |
[19] | Python ((2022) ). Welcome to Python.org, Python.org. Available at: https://www.python.org/. (Accessed: 13 February 2023). |
[20] | Ramsay, S. ((2015) ). Programming with Humanists: Reflections on Raising an Army of Hacker-Scholars in the Digital Humanities. In B.D. Hirsch (Ed.), Digital Humanities Pedagogy: Practices, Principles and Politics. London: Open Book Publishers. pp. 227-239. http://books.openedition.org/obp/1642. |
[21] | Project Jupyter ((2022) ). Project Jupyter. Available at: https://jupyter.org (Accessed: 13 February 2023). |
[22] | Programming Historian ((2022) ). Programming Historian. Available at: https://programminghistorian.org/ (Accessed: 13 February 2023). |
[23] | Steinley, D. ((2006) ). K-means clustering: A half-century synthesis. British Journal of Mathematical and Statistical Psychology, 59: (1), 1-34. doi: 10.1348/000711005X48266. |
[24] | Tan, C.-R. ((2021) ). The Nascent Case for Adopting Jupyter Notebooks as a Pedagogical Tool for Interdisciplinary Humanities, Social Science, and Arts Education. Computing in Science & Engineering, 23: (2), 107-113. doi: 10.1109/MCSE.2021.3062199. |
[25] | The Carpentries ((2022) ). About Us, The Carpentries. Available at: https://carpentries.org/about/ (Accessed: 13 February 2023). |
[26] | Tukey, J. ((1977) ). Exploratory Data Analysis (1st edition). London: Pearson. |
[27] | Vial, G., & Negoita, B. ((2018) ). Teaching Programming to Non-Programmers: The Case of Python and Jupyter Notebooks. ICIS 2018 Proceedings. https://aisel.aisnet.org/icis2018/education/Presentations/1, Accessed 10/6/22. |
[28] | Vaughan-Nichols, S.J. ((2010) ). Will HTML 5 Restandardize the Web? Computer, 43: (4), 13-15. Available at: doi: 10.1109/MC.2010.119. |
[29] | Walsh, M. ((2021) ). Introduction to Cultural Analytics. Available at: doi: 10.5281/ZENODO.4411250. |
[30] | Wickham, H. ((2014) ). Tidy data. Journal of Statistical Software, 59: , 1-23. doi: 10.18637/jss.v059.i10. |
[31] | Zachary, W.W. ((1977) ). An Information Flow Model for Conflict and Fission in Small Groups. Journal of Anthropological Research, 33: (4), 452-473. |


