
(i)Square dancing: Visual analysis in the classroom and beyond
Abstract
This paper demonstrates a dynamic, collaborative, and dialogic strategy for guiding students (and experienced researcher teams) through rudimentary forms of visual analysis using draw-and-write datasets. The approach identifies five sequential stages of the visual analysis process and further delineates twenty activities therein. Akin to the instructional “calls” spoken during square dancing, a leader with a script verbally prompts participants through a series of observational and analytical exercises and poses discussion questions along the way. The interactive experience unfolds stepwise and engenders in participants a feeling of intimacy with the images; introduces an array of analytical lenses; gives rise to discoveries about the concept being studied visually; kindles esprit de corps; and is fun. To encourage the adoption of this approach – called (i)Square Dancing – a blueprint for a student-geared, draw-and-write study and the leader’s script are provided for educators and scholars alike to borrow and customize to their own courses, research questions, and disciplines.
1.Introduction
In an encouraging voice, an instructor says to her students, “Here we go! Everyone please stand up and gather in a circle around the table about an arm’s length apart from each other. Slowly, take one step to the left so that your entire group moves together in a clockwise direction. Continue stepping to the left until everyone in the group has travelled full circle. While doing so gaze across the display of drawings …”
At first, a reader might think the people referred to above are engaged in a variation of square dancing, a traditional form of dance in which groups of dancers are prompted by a ‘caller’ through a sequence of steps in time to music. However, the last sentence with its cue to “gaze across the display of drawings …” reveals that this is actually an exercise in observation. In fact, the ‘dancers’ are graduate students from the Faculty of Information, University of Toronto and they are being directed by their professor to look systematically at more than 150 drawings of information on small squares of paper – coined iSquares – produced through the draw-and-write technique.
2.The draw-and-write technique
The draw-and-write technique [36] is an empirical, arts-informed [8] visual data gathering method that is gaining popularity across the social sciences. It is used to evoke a visual expression of a concept by asking informants to draw that concept and then answer questions about their drawing. The process generates a visual and textual dataset that can be analyzed in myriad ways [22]. The draw-and-write technique has been used to elicit a fresh perspective on concepts such as celebrity [13], teachers [43], women’s illnesses [17], and energy [4] to name a few exemplar studies. Like any method, the draw-and-write technique has both strengths and limitations (see [1] for critical views) which will not be presented here.
3.The iSquare research program
The iSquare Research Program (www.iSquares.info) is a draw-and-write study launched in 2011 in the field of information science. Its goal is to contribute an alternative visual conception of the central concept within information science – information – and to explore how populations envision that concept differently. The iSquare study has refined a version of the draw-and-write technique in which informants are allowed 7 minutes to answer the question “What is information?” by drawing with a black pen on a small (4” by 4”) piece of cardstock and then writing a short caption for the picture on the reverse side. This iSquare protocol [24] is convenient and inexpensive to implement, and can generate a compact yet evocative visual and textual dataset that lends itself to manipulation and display. To date, more than 3,000 iSquares have been collected from 12 countries [21], many academic disciplines, and the general public; results have been reported in the information science literature [18, 19, 20, 21, 25] and visual research journals [22]. A portion of the iSquare corpus can be seen online at www.iSquares.info.
4.Pedagogical applications of the draw-and-write technique
In addition to its application as a visual research method, the draw-and-write technique can also stimulate reflection and conversation in a classroom setting [19]. In the most basic application, students can be treated as the drawers-and-writers to produce a set of drawings and then discuss their pictures with peers. This activity works especially well at the start of a semester as a social ice-breaker and means to introduce any important concept.
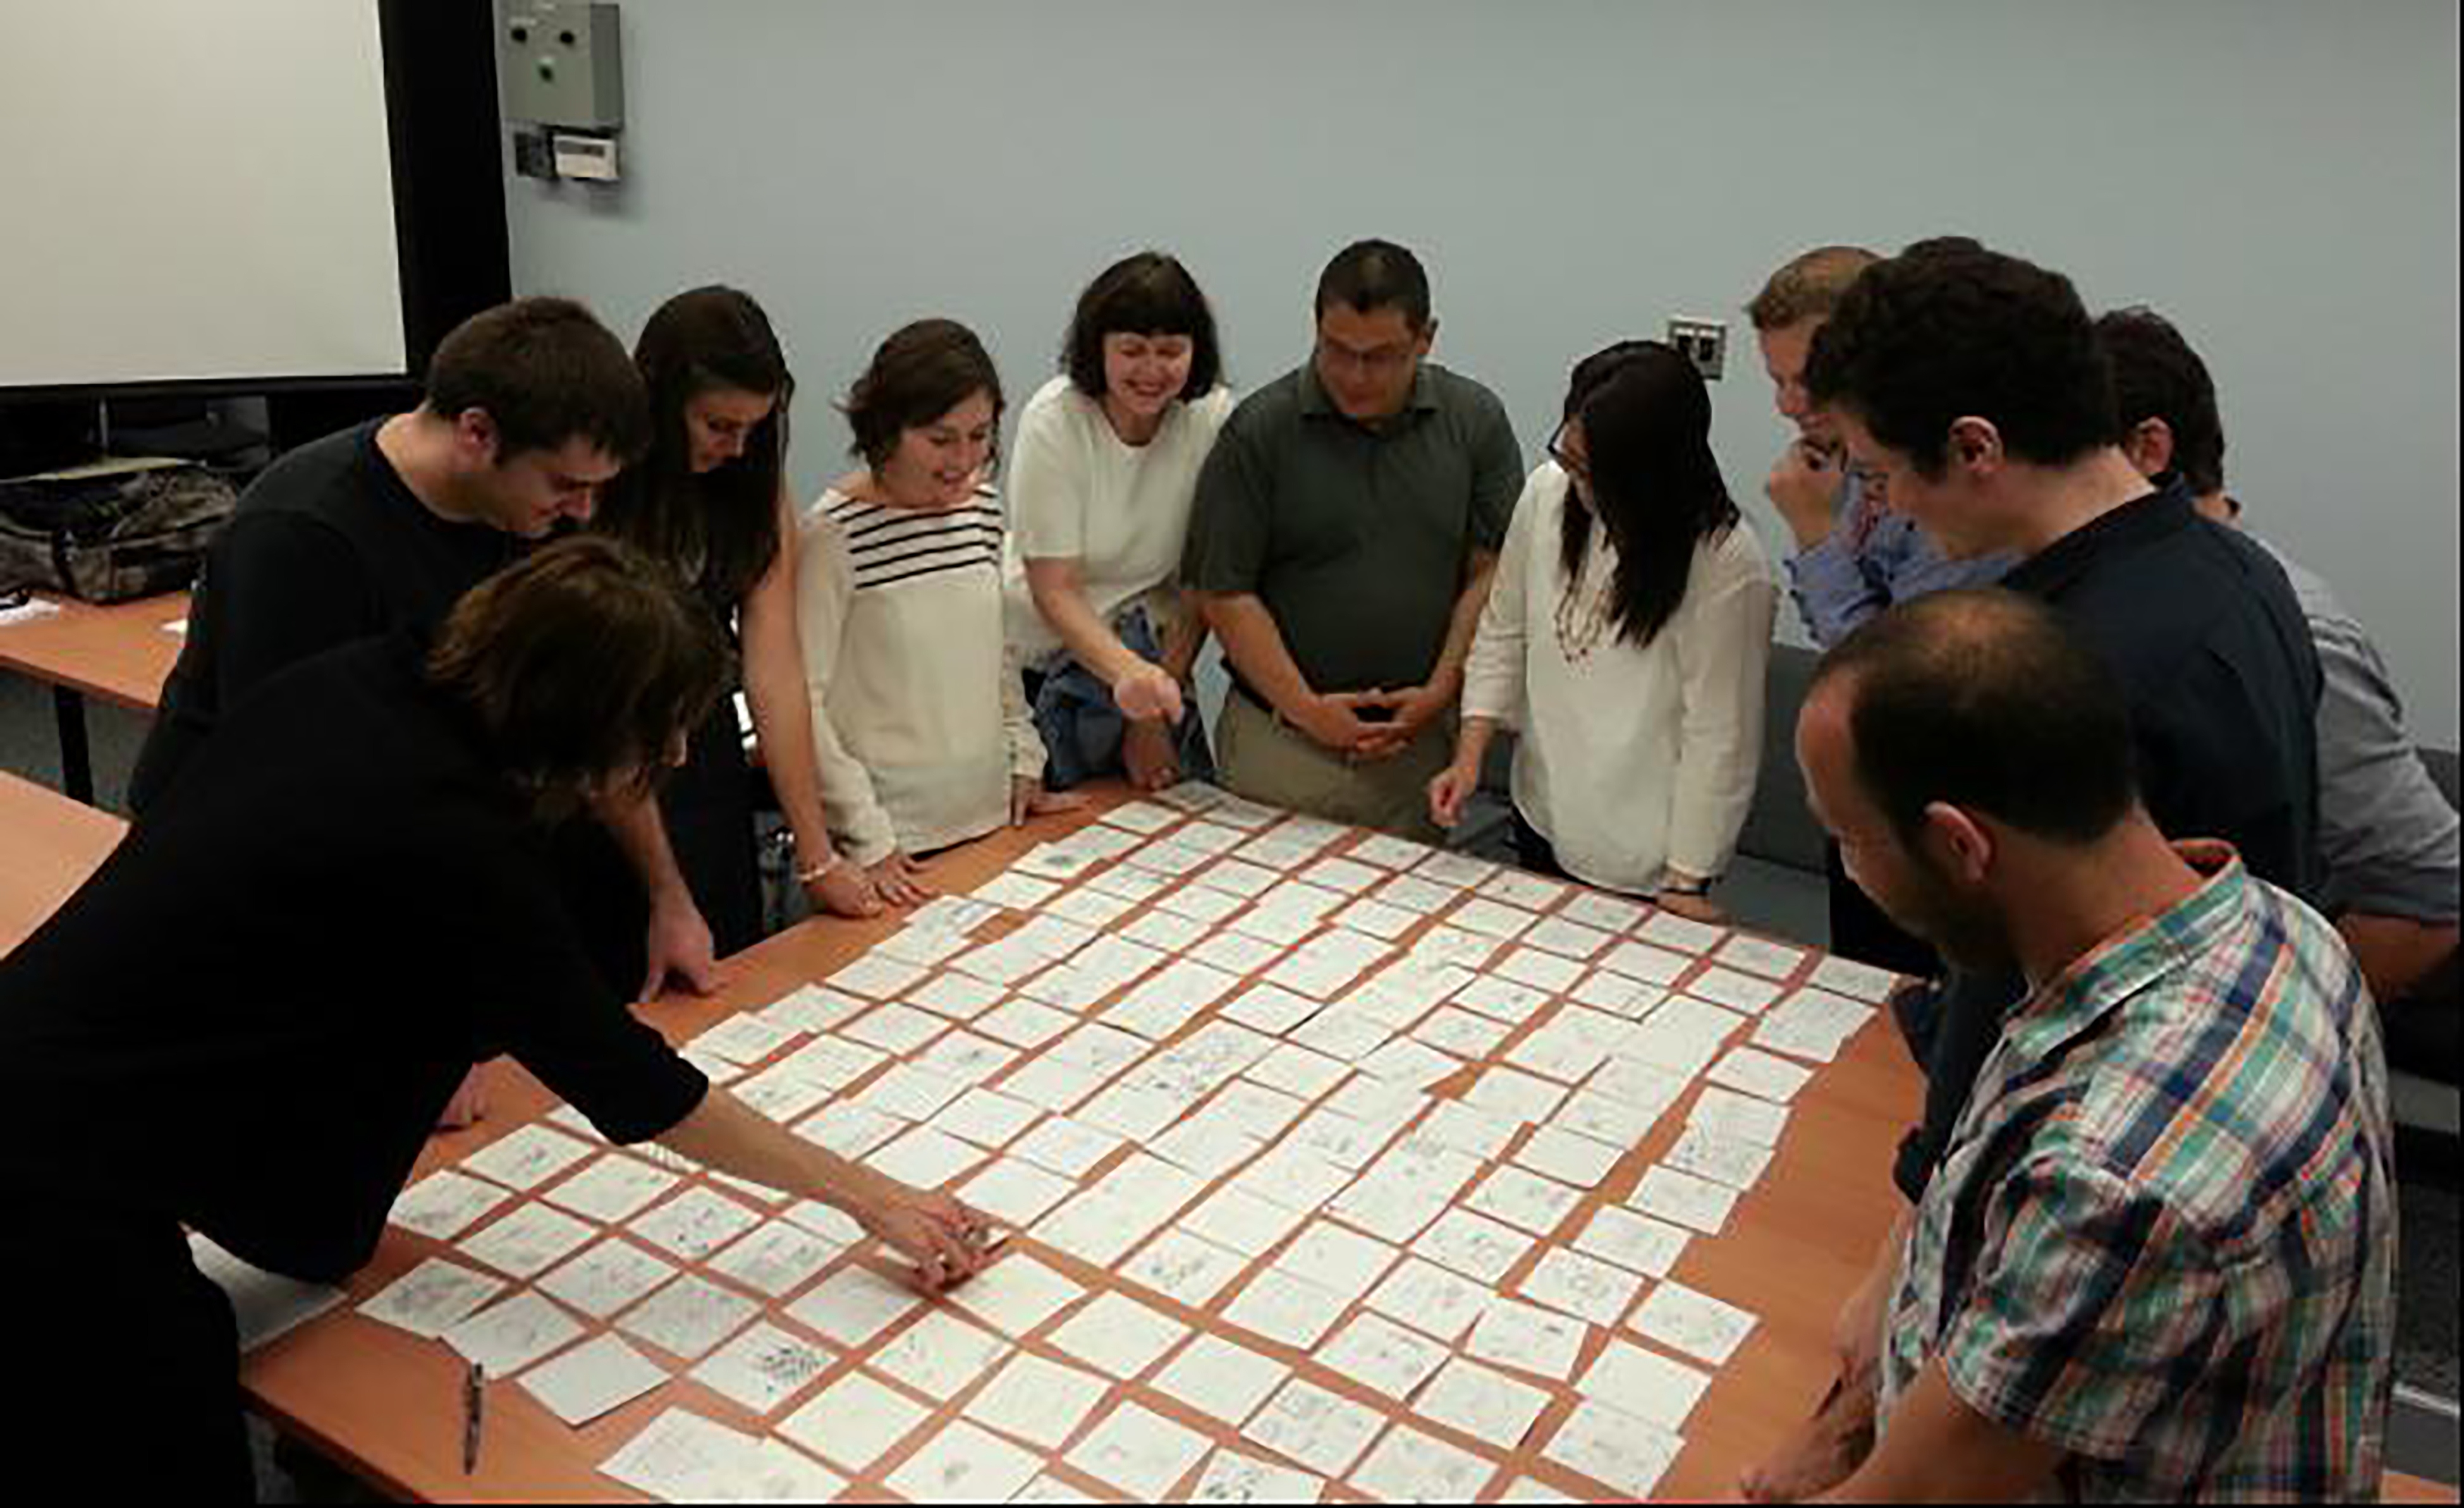
Figure 1.
Doctoral students at the Faculty of Information, University of Toronto examine for the first time their drawings of information collected through the iSquare protocol version of the draw-and-write technique.
In a more advanced pedagogical manifestation, the draw-and-write technique can function as an assignment in which students conduct original visual research within teams, as shown in Fig. 1. In most cases, this will require an ethical protocol, which can be administrated by the instructor in advance. At the beginning of the assignment, students select or are assigned a concept to study and are trained in the iSquare protocol version of the draw-and-write technique. Next, they collect drawings from a target population, organize the shared dataset, perform visual analysis [22, 39], and present results as an essay or artwork [23]. For three consecutive years, the authors of this paper have included the assignment, called the Visual Research Project (VRP), in introductory courses of a Master of Information program. The concepts drawn in the VRP have been “information”, “Internet”, and “librarian”. A detailed handout for the VRP assignment as well as instructions, scripts, and templates for the iSquare protocol (http://www.isquares.info/education.html.) are here shared to facilitate uptake of the draw-and-write technique and the (i)Square Dancing component.
5.(i)Square dancing
The VRP assignment gives students hands-on experience with the complete empirical research cycle. After students learn to gather drawings, the most intimidating step for many is visual data analysis as students in the social sciences typically do not know what it means to analyze visual data. (i)Square Dancing was invented and refined by the authors to ease trepidatious learners into that very process. The exercise is dynamic because the students and visual data are sometimes in motion. Because participants work together in teams, it is collaborative. The process is dialogic and unfolds through a spoken script with discussion questions. (i)Square Dancing is multidisciplinary and epistemologically agnostic by design; ideas from visual studies, drawing studies, cognitive linguistics, and education, among other fields, are represented. Rather than performing as a singular and comprehensive means to analyze draw-and-write data, the process resembles a tasting menu in which a variety of conceptual instruments are tested in bite-sized and easily digestible portions.
Practically speaking, (i)Square Dancing lasts between 30–90 minutes of class time, depending on the instructor’s pacing, and covers five broad stages of analysis through twenty activities, shown in Table 1. The leader, presumably the course instructor, can pick and choose the activities from Table 1 that align with their grade level, course, and discipline (activities that suit experienced student-researchers or doctoral students are indicated with
In advance, students should be assembled into teams of 8–12 people; one large table is needed per group; a visual dataset of drawings (ideally between 30–150 drawings per team) must be on hand. The (i)Square Dancing script begins below.
Table 1
(i)Square Dancing is organized as five sequential stages of visual analysis (left column) and twenty associated classroom activities (right column), which are denoted as a-t in the alphabet
| Stages of visual analysis | Activities |
|---|---|
| Getting started (Operational tasks that are necessary to get the collaborative visual analysis process underway.) |
|
| Just for fun (Easy, enjoyable activities that help participants become familiar and personally engaged with the visual data.) |
|
| The basics (Orienting activities that introduce basic principles of visual analysis and provide insight into drawings.) |
|
| Analytical strategies (Different ways to generate explanation, understanding, or interpretation of the corpus.) |
|
| Critical reflections on the method (Important methodological considerations about the draw-and-write technique and awareness of the effect of the researcher on the analytical process.) |
|
The five aspects are ordered as they typically unfold in the research process.
6.The iSquare dancing script
6.1Getting started: Introductions and naming a team
“Today we will do a visual analysis exercise. The goal is to help you become familiar with your visual data and to experience several forms of visual analysis. Please follow my spoken instructions throughout the activity. To begin, come together as a group and stand in a circle around your table and introduce yourselves in a few words. Then, brainstorm and agree to a team name that is inspired by your research project; it can be serious or more playful. When you are ready, please tell me your group name.”11
6.2Getting started: Setting up the visual data
“Working as a team, arrange your drawings in rows at the center of the table with the pictures on top and facing upwards from a few different viewing points (so that some are upright from the perspective of different positions around the table). The array of drawings in front of you will be referred to as the corpus, visual dataset, or simply the data. Throughout this activity, we will be focusing our attention on the drawings and not the textual statements on the reverse side.”22
6.3Just for fun: Discovering a favorite
“Here we go! Gather in a circle around your table about an arm’s length apart from each other. Slowly, take one step to the left so that your entire group moves together in a clockwise direction. Continue stepping to the left until everyone in the group has travelled full circle. While doing so gaze across the display of drawings until you have found a favorite. Now stop and point to your favorite. Did everyone select a different favorite or have some drawings appealed to more than one person on your team? Take a moment to tell each other why you selected your favorite.”
6.4Just for fun: “I spy …”
“Next we will play a version of the game ‘I spy …’, which is a fun way to become more familiar with your visual data. Select a person in your group to be the spy. The spy should scan the data and choose a drawn object that appears somewhere (and ideally only once) in the corpus. The spy should say, ‘I spy … [that object]’. Other team members should then attempt to find the object among the drawings by looking very carefully. The first to find the object is the ‘winner’ and becomes the next spy. Continue for three iterations of the game.”
6.5The basics: Graphic space [10]
“Precise terminology is available for talking about the drawings arrayed in front of you. Following the visual theorist, Yuri Engelhardt, we can call the front side of the 4” by 4” pieces of white cardstock the graphic space where the drawings reside. Do you think the drawings would be different if a smaller or larger graphic space had been provided?”33
6.6The basics: Composite graphic objects, sub-objects, and elementary graphic objects [10]
“Now focus your attention upon one of the more complicated drawings in your dataset featuring many elements that constitute the whole; according to Engelhardt, these are composite graphic objects. A composite graphic object is made up of several graphic sub-objects, which are the individual, smaller graphical forms. The composite graphic objects contrast with far simpler, elementary graphic objects in which the graphic space contains only one entity. In some of the activities to come, you will be asked to focus on composite or elementary graphic objects, as well as graphic sub-objects. Let’s practice these terms now: point to a drawing that is a composite graphic object; assemble several of these squares together on the table. Which one has the most graphic sub-objects? Now point to a drawing of an elementary graphic object; assemble these together on the table, as well. What words would you use to describe the squares that are composite graphic objects?44What words would you use to describe the elementary graphic objects?”55
6.7The basics: Three sites of analysis [39]
“Visual analysis can occur at three different sites of an image. Put differently, there are interesting stories that a researcher can tell at three points in the lifespan of the dataset. To help orient our visual analysis today, let us describe these three sites. First, there is the site of production, which was the 10-minute period in which the drawings were made by informants. Second, there is the site of the image itself, which is captured materially in the graphic space of the white squares. The third is the site of reception, where drawings are viewed by an audience, which is happening right now as we are the audience. In today’s activity, our attention will be focused upon the second site of analysis – the image itself. Before we continue in that direction, discuss among yourselves: What are some of the questions or issues at the site of production?66 Many sites of reception are possible for this dataset; can you name options?”77
6.8The basics: The epistemological spectrum [37]
“All images, including the drawings you are looking at right now, are complex representations of the world and their nature as resources for knowledge varies along an epistemological continuum [37]. On this continuum, one end is a positivist reading of an image and the other end is an interpretivist view. At the positivist pole, the drawings can be seen objectively as facts to be named and counted. They have an internal narrative; that is, a story to tell that is self-referential and does not extend beyond the graphic space. This view would hold that the images on the table are visual definitions or synonyms for the concept studied. On the interpretivist end of the spectrum, the drawings are cast as reflections of visual culture at the moment of their creation and use. This view directs attention beyond the drawings themselves to their social construction. In fact, this perspective may place more analytical attention on the data gathering process that generated the drawings or the social context that surrounds them. Next, look at any single drawing. What does it mean to you? In what ways is it interesting to you? Discuss within your group whether you have taken a positivist or interpretivist perspective on the visual data. Is it possible to embrace elements from both ends of the spectrum at the same time?”88
6.9The basics: Writing versus drawing
“As you know, this research method takes the novel approach of asking people to draw a concept. Yet it often happens that participants place words on the drawing surface. Words may caption or explain a graphic object (as shown in Fig. 2, on the right) or words may replace graphic objects entirely (as shown in Fig. 2, on the left). Interestingly, in one typology of graphic representations, words are considered to be graphic objects [10]; that is, they are drawings that employ letters. Look across your own dataset for squares that contain words on the front side. What percentage of the corpus, in your estimation, contains words?99 How are the words used? Why do you think participants incorporated words into their drawings?”1010
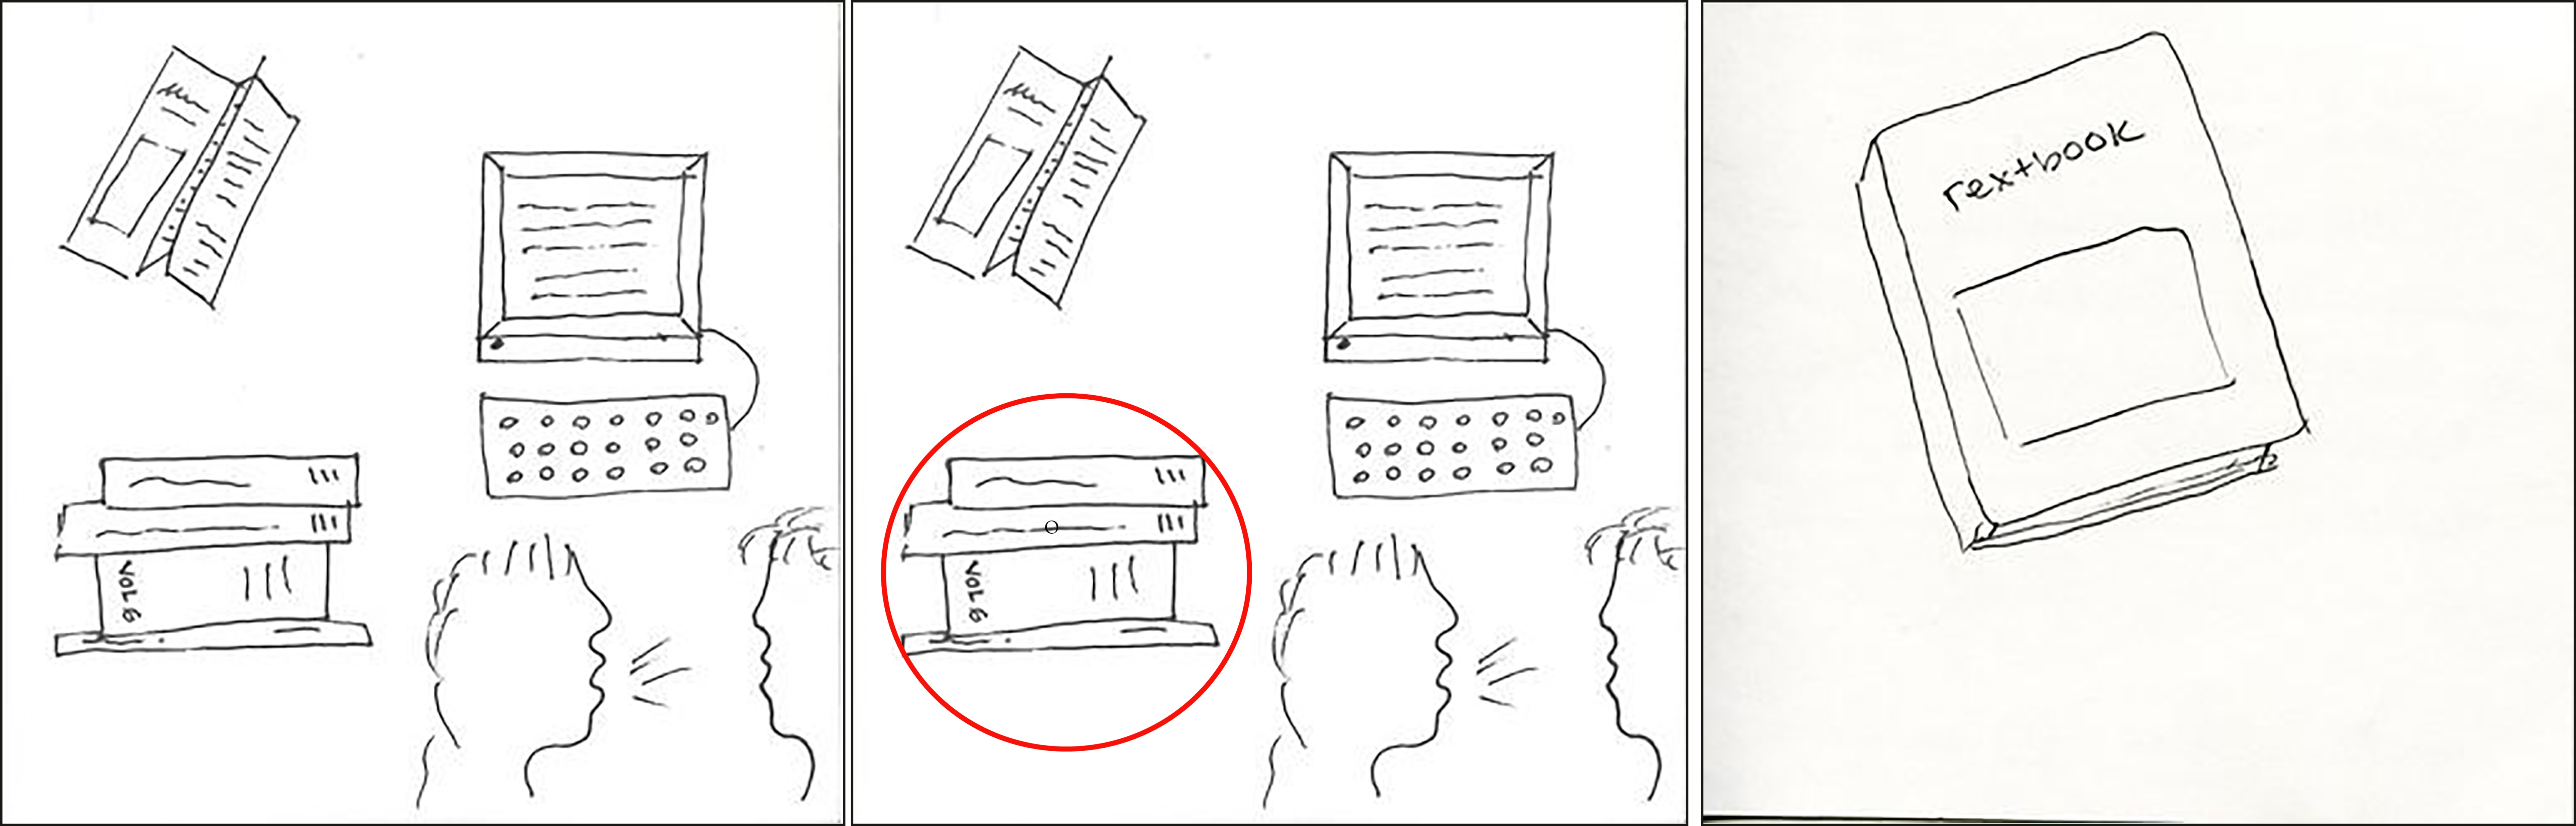
Figure 2.
A composite graphic object (left); a graphic sub-object (circled, middle); an elementary graphic object (right).
6.10The basics: Iconoclastic drawing [45]
“There has been excellent research into children’s drawings over the past 100 years. Though the drawings on the table were created by adults, theories of children’s drawing can inform our analysis process. The iconoclastic view of drawing partly explains the style and content of a child’s drawing. It holds that children are not inclined to create realistic drawings that bear a close formal resemblance to the world. Rather, they reflect iconic visual motifs within popular visual culture of their time. For example, when drawing a mouse, children would not render a field mouse in its native habitat, but rather Mickey Mouse as seen in a cartoon. Can you detect naturalistic or iconoclastic qualities in the drawings on your table? Which images are realistic? What iconic references appear?”
6.11The basics: Retrograde drawing [45]
“It has been documented that children draw old-fashioned or retrograde versions of things. For example, if asked to draw a car, the graphic object would resemble an automobile design from a few decades ago. Similarly, a television might be rendered in the shape of a box and not a contemporary flat screen version. Though the drawings in front of you are by adults, they might exhibit this property. Do you notice any graphic objects or sub-objects that are expressed retrograde? Why might children and adults draw this way?1111 How should this tendency factor into your interpretation of the data?”1212
6.12Analytical strategies: Deductive analysis [35]
“Next we will view the visual data through two contrasting modes of reasoning: deductive and inductive analysis. Deductive analysis begins with a theory and then seeks specific instances of that theory within data; it is sometimes referred to as theory-driven or a top-down approach. To conduct deductive analysis, we must first commit to a theory that is relevant to the concept we are studying with the draw-and-write technique. What theories might apply? [Here the instructor should supply a theory if students are relatively new to the field; or select one theory to work with if students name several.] Let’s do deductive analysis with [name of theory], which posits that [the basic tenets of the theory]. Keeping [the theory] in mind, look carefully at your visual data for one minute. Can you find reflections of this theory in the drawings? [See Fig. 3 for an example of deductive visual analysis on iSquares in the field of information science.] What might it mean if there are many expressions of concepts associated with the theory in the corpus?1313 What if you find no expressions of the theory in the visual data whatsoever?”1414
Figure 3.
Deductive analysis has been applied in the iSquare Research Program, a draw-and-write study of information from the field of information science. In this example, Buckland’s [6] framework for information was used as a lens to examine the visual data. All of Buckland’s three types of information were found in the visual data: information-as-knowledge (left), information-as-process (middle), and information-as-thing (right). The iSquare study also challenged and extended Buckland’s work as conceptions of information appeared in the visual data that did not fit within his framework.
![Deductive analysis has been applied in the iSquare Research Program, a draw-and-write study of information from the field of information science. In this example, Buckland’s [6] framework for information was used as a lens to examine the visual data. All of Buckland’s three types of information were found in the visual data: information-as-knowledge (left), information-as-process (middle), and information-as-thing (right). The iSquare study also challenged and extended Buckland’s work as conceptions of information appeared in the visual data that did not fit within his framework.](https://ip.ios.semcs.net:443/media/efi/2018/34-1/efi-34-1-efi189004/efi-34-efi189004-g003.jpg)
6.13Analytical strategies: Inductive analysis [35]
“A contrasting mode of reasoning to deduction is inductive analysis, also referred to as inductive thematic analysis or grounded theory analysis [7, 9, 15]. Whereas deduction is from the top down, inductive is from the bottom up (with the “bottom” being the dataset). Inductive analysis proceeds by looking at the data without reference to a pre-existing theory in order to identify organically or naturally appearing concepts expressed within the corpus. Put differently, analysts aim to let the data speak to them. Coding is the term for recognizing and naming a concept or visual motif in the data [7]. To implement an inductive approach right now, attempt to banish preconceived notions and look at your drawings thoughtfully and afresh. Are you struck by any visual motifs that are appear vividly or frequently? If so, invent a memorable code to represent that idea. Spend a few minutes with your team, conducting inductive analysis by letting the data speak to you. A next step (which we do not have time for right now) would be to explicate and organize the codes into themes, a conceptual framework, or a grounded theory. What codes were generated by your group? Did you assign codes to composite graphic objects as a whole, elementary graphic objects, or graphic sub-objects?”1515
6.14Analytical strategies: Pictorial metaphors [11]
“You may have already noticed that some drawings in the corpus are metaphors. Metaphors are usually associated with text, but they can also be expressed in images, which are called pictorial metaphors. Whatever the format, metaphors work by linking two conceptual domains, a target domain and a source domain [28]. The target domain is abstract, unknown, and difficult to envisage; in our study, [the concept you asked informants to draw] is the target domain. The source domain tends to be more concrete and lends familiar qualities to the more elusive target domain. It is expressed as a drawing. In the iSquare study of information, for example, information was the target domain and many source domains appeared as drawings. One common source domain was the lightbulb; it extended the idea of ‘illumination’ to information as shown in Fig. 3 [25]. What pictorial metaphors appear in your corpus? What qualities do the source domains lend to the more elusive concept of the target domain (which is the concept being studied through the draw-and-write technique)?”
Figure 4.
Many pictorial metaphors appeared in the iSquare study of information. One of the most common source domains was the light bulb. Other popular source domains were: earth, web, tree, light bulb, box, cloud, and fishing/mining [25]. Examples of the pictorial metaphor of light bulb are shown above.
![Many pictorial metaphors appeared in the iSquare study of information. One of the most common source domains was the light bulb. Other popular source domains were: earth, web, tree, light bulb, box, cloud, and fishing/mining [25]. Examples of the pictorial metaphor of light bulb are shown above.](https://ip.ios.semcs.net:443/media/efi/2018/34-1/efi-34-1-efi189004/efi-34-efi189004-g004.jpg)
6.15Analytical strategies: Storytelling [27]
“It has been claimed [42] claims that visual approaches can make communicating research more holistic and layered as images evoke stories. Do you think this is true for our project? Could these drawings be placed into an illustrative sequence or visual narrative that brings a new perspective to [topic]? Spend a moment looking at the corpus with its story-telling potential in mind. When you are ready, arrange the image(s) that constitute your tale into order and tell that story to your peers.”
6.16Analytical strategies: Your turn
“Innumerable analytical strategies are available beyond those practiced thus far. One handbook of visual methodologies names compositional interpretation, semiology, psychoanalysis, discourse analysis, and content analysis as analytical approaches [39], among many others. Informed by your academic background, prior research experience, or simply your imagination, can you propose other techniques to examine and interrogate this corpus? If so, please share the rudiments with your team and then give it a try.”
6.17Critical reflections on the method: Defiant responses [2, 31, 38]
“A known problem in graphical elicitation is that some informants may not like to draw and resist the activity in blatant or subversive ways. This may arise at the site of creation if invited informants opt out of the activity. Unless this is recorded in fieldnotes, such resistance leaves no trace in the dataset. Sometimes, resistant informants may agree to participate in the drawing activity yet channel their defiance into the drawing itself. Gaze across your corpus with this issue in mind. Is there any evidence of defiance?”1616
6.18Critical reflections on the method: Validity? [44]
“The draw-and-write technique has been critiqued in terms of its validity; that is, whether the drawings truly represent the phenomenon being studied. It may be that informants draw what is easy to draw, rather than their true visual conception of the phenomenon under study. Look at your dataset. Are there any frequently occurring graphic objects that may be present because they are easy to draw.1717 “What are the implications of this tendency on your research project?”
“A related matter is that many people have a favorite object or style of drawing, probably learned in childhood, that they often reproduce when they draw. Any set of drawings gathered through the draw-and-write technique could contain many tried-and-true graphic objects that are created in this habitual mode. Examine your squares. Do any seem well-drawn but appear to have no obvious connection to the phenomenon being studied? Discuss these instances in your group. Could they be favorite and unreflective ways of drawing? How can such instances be identified and mitigated?”1818
6.19Critical reflections on the method: Reflexivity [3]
“Reflexivity is the process of self-reflection to consciously acknowledge and examine the assumptions that a researcher brings to the research process. It rests upon the idea that none of us are detached, and objective observers and our preconceptions should be recognized. Today, reflexivity is considered a necessary element of good research. Hence, let us pause right now to consider: Do you harbor any assumptions or biases about [topic] that may impact your role as an analyst in this project? Similarly, do you have any feelings about the draw-and-write technique or the population that made the drawings? If so, share them with your team now. Then, together discuss how such viewpoints may have shaped the construction of this dataset and its interpretation. What can be done to acknowledge such preconceptions and their impacts?”1919
6.20Critical reflections on the method: The value of visual research [42]
“Visual research projects, like this one, are alternatives or complements to research designs that exclusively employ words and/or numbers. Why use visual methods rather than more standard social scientific research approaches? One champion of visual methodologies has articulated ten benefits of using images during the research process. Next, I will read these argument(s) slowly. As you listen, consider which rings most true for the study at hand.” [The instructor may choose one or several of these, depending on time and interest.]
10.
1. Images can be used to capture the ineffable, the hard-to-put into words.
2. Images can make us pay attention to things in a new way.
3. Images are likely to be memorable.
4. Images can be used to communicate more holistically, incorporating multiple layers and evoking stories or questions.
5. Images can enhance empathetic understanding and generalizability.
6. Through metaphor and symbol, artistic images can carry theory elegantly and eloquently.
7. Images encourage embodied knowledge.
8. Images can be more accessible than most forms of academic discourse.
9. Images can facilitate reflexivity in research design.
10. Images provoke action for social justice.
“In the context of our study, which of these assertions ring true? How do these positive qualities manifest in our study of [topic]? What would you say in response to critical challenge to visual methods from a long-time enthusiast of traditional quantitative methods?”2020
7.Discussion
7.1Evaluation
How do participants respond to iSquare Dancing and is it an effective way to learn the rudiments of visual analysis? Student participants to-date have not been asked their opinions. However, a spectrum of reactions have been observed in class at the group (not individual) level. One highly engaged team followed the prompts in an upbeat, relaxed, and almost boisterous manner, often reaching across that table simultaneously as if playing a game of Twister at a party. In the same session, just across the room, a more reserved group stood quietly around their corpus sharing comments discretely, sometimes finishing each activity early and waiting in silence for the next question. A third group of students were prompted by the iSquare Dancing activity to go off on a critical methodological tangent related to the presentation of racial identity in the drawings. It is not possible for us to explain or control this range of outcomes to the exercise, since group dynamics are complicated. A more objective measure of the merits of this approach may be in the papers students produce to conclude the Visual Research Project. Most reflect competence in data analysis and employ the techniques practiced in the (i)Square Dancing session.
7.2Related ideas
This analytical strategy reflects broad trends within the social sciences today. Given that participants and drawings are in motion throughout, it qualifies as embodied learning [5, 33, 34, 40]. The principles of embodied learning affirm the body as a tool for knowledge construction, validate the social nature of learning, and recognize the importance of emotional involvement. Furthermore, (i)Square Dancing shifts the analytical process of a research project from an individual and mental mode to a social and expressive event. It therefore aligns with the idea of research as a cultural performance. Indeed, the spontaneous presentations during “Select a favorite” and “Storytelling” resemble improvisational theater.
7.3(i)Square Dancing beyond the classroom
Though (i)Square Dancing was conceived for students, seasoned visual researchers might try it to gain new insights on their visual data. By temporarily placing any singular or preferred analytical strategy aside, researchers may be surprised how ideas such as “Iconoclastic drawing” or “Storytelling” disrupt, enlarge, and stimulate their own thinking. Nowadays, research teams can be highly interdisciplinary and enacting (i)Square Dancing together could contribute to shared understanding at the crucial point of data analysis. On such teams, the activity entitled “Analytical strategies: Your turn” creates an opportunity for each participant to share an analytical lens native to their field, thereby building understanding among collaborators and opening up novel views. It is even conceivable that research subjects – the original drawers – can be invited to join the circle, lending a unique perspective and validating or challenging the researchers’ interpretations.2121
8.Conclusion
As visual and creative methods take their place alongside conventional research designs, more and more draw-and-write studies are arising. Given its broad applicability to many research questions and relative simplicity, this method has proven fruitful in the classroom. Using the assignment instructions for a Visual Research Project and the (i)Square Protocol (both available with this article), an instructor can help students implement a draw-and-write study. While the data-gathering stage of such a project is straight-forward, the visual analysis of the resulting corpus of drawings is often challenging. In response, this paper has introduced a dynamic, collaborative, dialogic, step-wise process-coined (i)Square Dancing-to initiate students and other explorers into visual analysis. Working in teams and guided by spoken instructions, students organize and play with their visual data before applying analytical lenses from multiple disciplines-almost like speed-dating ideas. On their feet and in conversation with peers, participants experience new perspectives on the visual domain while having fun. The (i)Square dancing approach is also a product of its time, which celebrates embodied, performative, polysemic means of discovery and knowing.
Notes
1 The leader should keep track of the team names, which can be used throughout the exercise to refer to individual groups as needed. This naming activity is unnecessary if there are only a dozen students or less which form a singular group.
2 The (i)Square Dancing exercise focuses on the visual element of draw-and-write datasets since different analytical techniques are needed for textual data. However, throughout the activities, participants may consult the reverse-side caption to shed light on the drawing as required.
3 This is the first of several open questions in the iSquare Dancing process. Many different answers are possible and the most obvious ones are provided here. It is likely the drawings would shrink or enlarge depending upon the size of the graphic space, since drawers tend to scale their drawing to the size and shape of the drawing surface. The time provided to fill the graphic space would have to change as well. The size of the graphic space and the timing are just two of the constraints that can be manipulated in any draw-and-write research design [41].
4 Often the composite graphic objects are more elaborate; they may be described as busy, complicated, detailed, complex, intricate, extensive, or many-faceted. To borrow from Engelhardt’s [10] classification of graphic representations, composite graphic objects are often grouping diagrams that display a visual list of objects or characteristics.
5 Often the elementary graphic objects appear simpler; they may be described as simple, spare, rudimentary, uncomplicated, symbolic, or straight-forward. To borrow from Engelhardt’s [10] classification of graphic representations, the elementary graphic objects are often pictures or symbols.
6 Any number of methodological questions or problems may be raised at the site of production such as: How might individuals who collected the data influence the process? Did the materials (pen, paper) constrain or enable certain outcomes [41]? What socio-demographic aspects of the informants might shape their responses?
7 The drawings could be presented to an audience in myriad ways such as an exhibition, an online gallery, in a journal article, in a PowerPoint presentation, or as a poster. The iSquare Research Program has also experimented with unconventional and playful forms of dissemination such as calendars, games, stickers, and ornaments.
8 Opinions on this issue may vary. On the one hand, the positivist and interpretivist views are opposites and cannot be simultaneously enacted. On the other hand, any study could present one perspective and then the other as a sequence. This would represent both realities, but not at the same time. See debates on the commensurability of paradigms [14, 16, 30].
9 In one iSquare dataset, more than 50% of the drawings also contained words in the graphic space, which surprised the research team.
10 This suggests that the explanatory power of words runs deep in human consciousness and is experienced as a complement to drawing, rather than an alternative.
11 A possible explanation is that when parents or other elders teach children how to draw they use representations from their own bygone era.
12 Due to retrograde drawing, draw-and-write datasets may over-represent visual motifs from a generation ago. This is important for researchers to realize if they attempt to investigate contemporary visual conceptions of a phenomenon.
13 The presence of many drawings that can be associated with the theory suggests that the theory is validated in the corpus; put differently, the corpus provides a new visual expression of the theory.
14 An absence of drawings that can be associated with the theory suggests that from a visual perspective, the theory is not comprehensive or is not validated in the visual domain. In a positive light, it could be that the corpus contains an extension or complement to the existing theory.
15 In the literature of visual analysis, there appears to be no formula to assign greater or lesser value to visual motifs expressed as graphic sub-objects versus elementary or composite graphic objects. For example, in the iSquare Research Program, the appearance of a book within a detailed drawing of a home office registers the same as a singular book drawn freestanding in the graphic space. The contrast between these two visual expressions of “book” can be seen in the iSquares of Fig. 2, center and right.
16 It may or may not be possible to detect instances of defiance. Examples exist in the iSquare corpus. In one case, an informant wrote “information cannot be drawn” in the graphic space. Elsewhere, informants left the graphic space blank, yet answered the prompts on the back side, including reasons why information does not lend itself to graphical representation.
17 The research team may never know why certain visual motifs appear in the graphic space. The iSquare protocol, as currently formulated, does not provide a means to interrogate this issue. Potentially, to mitigate the problem of drawing easy things, the instruction script could include a statement, “This is not a drawing contest. We encourage you to draw your best genuine understanding of [concept being studied], rather than that which is easiest to draw”. Alternatively, researchers could conduct a short interview after collecting each drawing, thereby having an opportunity to ask the informant, “Why did you draw [x]?”
18 Footnote 19 addresses the related issue of validity.
19 It is generally recognized that all researchers bring preconceptions to their work, thereby shaping research outcomes. One solution is to acknowledge such preconceptions in any writings that disseminate the study so that readers are given an opportunity to weight the potential impact of a researcher’s personal experience and perspective.
20 Any of these assertions can counter a challenge to visual research designs.
21 The involvement of informants as ‘analyzers’ of their own data alongside the researcher is an uncommon feature in the research design of qualitative inquiry. Usually to indicate the trustworthiness of data, “member-checking,” a process whereby informants review their interview transcript(s) and/or interpreted data, is used [29]. This technique, however, has limitations [26, 32] and often fails to acknowledge informants as “agentive, responsible theorists of their own experience” [29, p. 34]. By including informants in (i)Square Dancing, a dynamic and effective co-construction of knowledge can take place.
References
[1] | Backet-Millburn K, McKie L. A critical appraisal of the draw and write technique. Health Education Research (1999) ; 14: (3): 387-398. |
[2] | Barker J, Weller S. Is it fun? Developing child centered research methods. The International Journal of Sociology and Social Policy (2003) ; 23: (1-2): 33-58. |
[3] | Berger R. Now I see it, now I don’t: Researcher’s position and reflexivity in qualitative research. Qualitative Research (2015) ; 15: (2): 219-234. |
[4] | Bowden F, Lockton D, Gheerawo R, Brass C. Drawing Energy: Exploring Perceptions of the Invisible. London: Royal College of Art; (2015) . |
[5] | Bresler L. Knowing Bodies, Moving Minds: Towards Embodied Teaching and Learning. Dordrecht: Springer; (2004) . |
[6] | Buckland MK. Information as thing. Journal of the American Society for Information Science (1991) ; 42: (5): 351-360. |
[7] | Charmaz K. Constructing Grounded Theory: A Practical Guide Through Qualitative Analysis. Thousand Oaks, CA: Sage Publications; (2006) . |
[8] | Cole AL, Knowles JG. Arts-informed research. In: Handbook of the Arts in Qualitative Research: Perspectives, Methodologies, Examples, and Issues. Knowles JG, Cole AL. Eds. Thousand Oaks, CA: Sage Publications; (2008) . p. 55-70. |
[9] | Corbin J, Strauss A. Basics of Qualitative Research. 3rd edition. Thousand Oaks, CA: Sage Publications; (2008) . |
[10] | Engelhardt Y. The language of graphics: A framework for the analysis of syntax and meaning in maps, charts and diagrams. (Unpublished doctoral dissertation). Institute for Logic, Language and Computation, University of Amsterdam, The Netherlands. (2002) . |
[11] | Forceville C. Metaphor in pictures and multimodal representations. In: The Cambridge Handbook of Metaphor and Thought. Gibbs RW, Jr. Ed. Cambridge: Cambridge University Press; (2008) . p. 462-482. |
[12] | Forceville C. Non-verbal and multimodal metaphor in a cognitivist framework: Agendas for research. In: Multimodal Metaphor. Forceville C, Urios-Aparisi E. Eds. The Hague: Mouton De Gruyter; (2009) . p. 19-52. |
[13] | Gauntlett D. Creative Explorations: New Approaches to Identities and Audiences. London: Routledge; (2007) . |
[14] | Given LM. It’s a new year … so let’s stop the paradigm wars. International Journal of Qualitative Methods (2017) ; 16: : 1-2. |
[15] | Glaser BG, Strauss AL. Discovery of Grounded Theory: Strategies for Qualitative Research. Chicago: Aldine; (1967) ; 1999. |
[16] | Guba EG, Lincoln YS. Competing paradigms in qualitative research. In: The Sage Handbook of Qualitative Research. Denzin NK, Lincoln YS. Eds. Thousand Oaks, CA: Sage Publications; (1994) . p. 105-117. |
[17] | Guillemin M. Understanding illness: Using drawings as a research method. Qualitative Health Research (2004) ; 14: : 272-289. |
[18] | Hartel J. An arts-informed study of information using the draw-and-write technique. Journal of the American Society for Information Science and Technology (2014) ; 65: (7): 1349-1367. |
[19] | Hartel J. Drawing information in the classroom. Journal of Education for Library and Information Science Education (2014) ; 55: (1): 83-85. |
[20] | Hartel J. Information behaviour illustrated. Paper presented at the Information Seeking in Context Conference, Leeds, England. (2014) September 2-5. Retrieved from Retrieved from http://InformationR.net/ir/19-4/isic/isic11.html. |
[21] | Hartel J. Visualizing information worldwide. Paper presented at 78th Annual Meeting of the American Society for Information Science and Technology, St. Louis, MO. (2015) November 7-12. |
[22] | Hartel J. Adventures in visual analysis. The Visual Methodologies Journal (2017) ; 5: (1): 80-91. |
[23] | Hartel J, Noone R, Oh C. The creative deliverable. Journal for Education in Library and Information Science (2017) ; 58: (3): 176-183. |
[24] | Hartel J, Noone R, Oh C, Danzanov P, Kelly B. The iSquare protocol: Combining research, art, and pedagogy through the draw-and-write technique. Qualitative Research (2018) ; 4: (18): 433-450. |
[25] | Hartel J, Savolainen R. Pictorial metaphors for information. Journal of Documentation (2016) ; 72: (5): 794-812. |
[26] | Harvey L. Beyond member-checking: A dialogic approach to the research interview. International Journal of Research and Method in Education (2015) ; 38: (1): 23-38. |
[27] | Josselson R. Narrative research: Constructing, deconstructing, and reconstructing story. In: Five Ways of Doing Qualitative Analysis: Phenomenological Psychological, Grounded Theory, Discourse Analysis, Narrative Research, and Intuitive Inquiry. Wertz FJ, Charmaz K, McMullen LM, Josselson R, Anderson R, McSpadden E. Eds. New York: Guilford Press; (2011) . p. 224-242. |
[28] | Lakoff G, Johnson M. Metaphors We Live By. Chicago: University of Chicago Press; (1980) . |
[29] | Lincoln YS, Guba EG. Naturalistic Inquiry. Newbury Park, CA: Sage; (1985) . |
[30] | Lincoln YS, Lynham SA, Guba EG. Paradigmatic controversies, contradictions, and emerging confluences, revisited. In: The Sage Handbook of Qualitative Research. Denzin NK, Lincoln YS. Eds. 4 |
[31] | Mannay D. Visual, Narrative and Creative Research Methods: Application, Reflection and Ethics. Abingdon: Routledge; (2016) . |
[32] | Mero-Jaffe I. ‘Is that what I said’? Interview transcript approval by participants: An aspect of ethics in qualitative research. International Journal of Qualitative Methods (2011) ; 10: (3): 231-247. |
[33] | Nguyen DJ, Larson JB. Don’t forget about the body: Exploring the curricular possibilities of embodied pedagogy. Innovative Higher Education (2015) ; 40: (4): 331-344. |
[34] | O’Loughlin M. Embodiment and Education: Exploring Creatural Existence. Netherlands: Springer; (2006) . |
[35] | O’Reilly K. Key Concepts in Ethnography. London: Sage; (2012) . |
[36] | Pridmore P, Bendelow G. Health images: Exploring children’s beliefs using the draw-and-write technique. Health Education Journal (1995) ; 54: : 473-488. |
[37] | Prosser J, Loxley A. Introducing visual methods. (National Centre for Research Methods Review Paper). (2008) . Retrieved from http://eprints.ncrm.ac.uk/420/1/MethodsReviewPaperNCRM-010.pdf. |
[38] | Richardson M. Embodied intergenerational: Family position, place and masculinity. Gender, Place and Culture (2015) ; 22: (2): 157-171. |
[39] | Rose G. Visual Methodologies: An Introduction to Interpreting Visual Materials. 2nd edition. London: Sage; (2007) . |
[40] | Stolz SA. Embodied learning. Educational Philosophy and Theory (2015) ; 47: (5): 474-487. |
[41] | Varga-Atkins T, O’Brien M. From drawings to diagrams: Maintaining researcher control during graphic elicitation in qualitative interviews. International Journal of Research and Methods in Education (2009) ; 32: : 53-67. |
[42] | Weber S. Using visual images in research. In: Handbook of the Arts in Qualitative Research: Perspectives, Methodologies, Examples, and Issues. Knowles JG, Cole AL. Eds. London: Sage Press; (2008) . p. 41-54. |
[43] | Weber S, Mitchell CA. That’s Funny You Don’t Look Like a Teacher: Interrogating Images and Identity in Popular Culture. Routledge: London; (1995) . |
[44] | Whittemore R, Chase SK, Mandle CL. Validity in qualitative research. Qualitative Health Research (2001) ; 11: (4): 522-537. |
[45] | Wilson B, Wilson M. An iconoclastic view of the imagery sources in the drawings of young people. Art Education (1977) ; 30: (1): 4-11. |


