
Novel blood typing method by discrimination of hemagglutination and rouleaux using an erythrocyte aggregometer
Abstract
BACKGROUND:
In pretransfusion blood typing, pretreatments such as centrifugation and suspension of red blood cells (RBCs) and mixing them with sufficient amounts of reagents are required, but these steps are time-consuming and costly.
OBJECTIVE:
Aiming to develop a new blood typing method that requires no dilution and only a small amount of reagent, we attempted to determine blood type using syllectometry, an easy-to-use and rapid optical method for measuring the RBC aggregation that occurs when blood flow is abruptly stopped in a flow channel.
METHODS:
Samples of whole blood from 20 healthy participants were mixed with antibody reagents for blood typing at mixing ratios of 2.5% to 10% and measured with a syllectometry device.
RESULTS:
Amplitude (AMP), one of the aggregation parameters, showed significant differences between agglutination and non-agglutination samples at mixing ratios from 2.5% to 10%. Although there were significant individual differences in aggregation parameters, calculation of AMP relative to that of blood before reagent mixing reduced the individual differences and enabled determination of blood type in all participants.
CONCLUSIONS:
This new method enables blood typing with a small amount of reagent, without the time-consuming and labor-intensive pretreatments such as centrifugation and suspension of RBCs.
1Introduction
When major bleeding occurs due to surgery or severe trauma, blood transfusion is essential for maintaining tissue oxygenation and achieving hemostasis [1]. For blood transfusion, a quick, accurate, and simple method for determining the patient’s blood type is desirable. The ABO blood group system, discovered by Landsteiner [2], is the most widely used blood group system in clinical practice. Blood is classified into type A, B, AB, or O according to the presence of A or B antigens on the red blood cell (RBC) membrane and A or B antibodies in the plasma.
Clinically, in forward ABO typing, the patient’s RBCs are mixed with reagents containing type A or B antibodies, and the RBC agglutination produced by the antigen–antibody reaction is detected using various methods. The simplest method is slide testing, in which RBCs and anti-A or anti-B antibody reagents are mixed on a slide and RBC agglutination is visually confirmed, but its sensitivity is not high [3]. The test tube method is a common alternative that is more sensitive than the slide method but requires the centrifugation and dilution of blood cells, which is time-consuming and labor-intensive [4]. Automated technologies such as microcolumn gel [5] and microplate [6] methods are becoming more prevalent in laboratories. In addition, many new measurement methods have been reported, including a waveguide-mode sensor [7], microfluidics [8, 9], and surface plasmon resonance (SPR) [10]. However, many of the above methods use assays that detect agglutination, making it necessary to avoid incorrect detection of rouleaux (RBC aggregation) [11] caused by the interaction of RBCs with plasma proteins such as fibrinogen and immunoglobulins [12]. RBC aggregation occurs even in samples from healthy individuals and is elevated in inflammatory diseases [13], though not in saline without macromolecules [14]. Therefore, the test tube method and many of the methods described above require dilution of blood with saline or centrifugation to eliminate false agglutination (i.e., aggregation). However, these steps are time-consuming and labor-intensive. In addition, the use of commercial antibody reagents at mixing ratios equal to or higher than the blood volume [7–10] is required for RBC aggregates to grow to a visible size.
In this study, we propose a quantitative method for measuring RBC aggregation, which has traditionally been excluded from blood typing. A rapid and easy method for measuring RBC aggregation is syllectometry. This method optically measures RBC aggregates that form when a shear flow acting to prevent RBC aggregation is abruptly stopped [15]. Syllectometry can quickly and easily measure RBC aggregability using aggregation parameters calculated from a syllectogram, which is the waveform reflecting the change in transmitted light intensity through the blood over time as the aggregate size increases [16]. Because this method can detect changes in the interactions among erythrocytes with high sensitivity, we expect that the blood type can be determined with a small amount of antibody reagent without the need for centrifugation or suspension of RBCs. In this study, we investigated the feasibility of blood typing with syllectometry using samples of whole blood mixed with small amounts of antibody reagent, in which agglutination is difficult to detect with thenaked eye.
2Materials and methods
2.1Sample preparation
Venous blood was collected from 20 healthy volunteers (5 each of type A, B, O, and AB) using a 21-G needle (Terumo Corp., Tokyo), and the collected blood was immediately anticoagulated with K2-EDTA. The hematocrit of the collected blood ranged from 36.8% to 40%. The hematocrit was not adjusted, and the blood cells were not washed; instead, they were used directly in the experiment. To determine the blood type, portions of each sample were subjected to forward typing using anti-A and anti-B antibody reagents (Ortho Clinical Diagnostics, Raritan, NJ) and reverse typing using type A1 and type B erythrocytes (Ortho Clinical Diagnostics) in accordance with the manufacturer’s instructions. Samples that showed agglutination when the blood was combined with antibody reagent were defined as positive, while samples with no agglutination were defined as negative.
Then, for measurement by a syllectometry device, sample vials were prepared in duplicate by mixing anti-A or anti-B antibody reagents at each of four concentrations (2.5%, 5.0%, 7.5%, and 10% [v/v]) with 400μL of collected native whole blood for each participant. For the controls, blood samples prepared in the same way without mixing of reagents were measured for each participant. The experiments were approved by the ethics committee of Shibaura Institute of Technology and were conducted in accordance with the Declaration of Helsinki. Written informed consent was obtained from the volunteers.
2.2RBC aggregation measurements
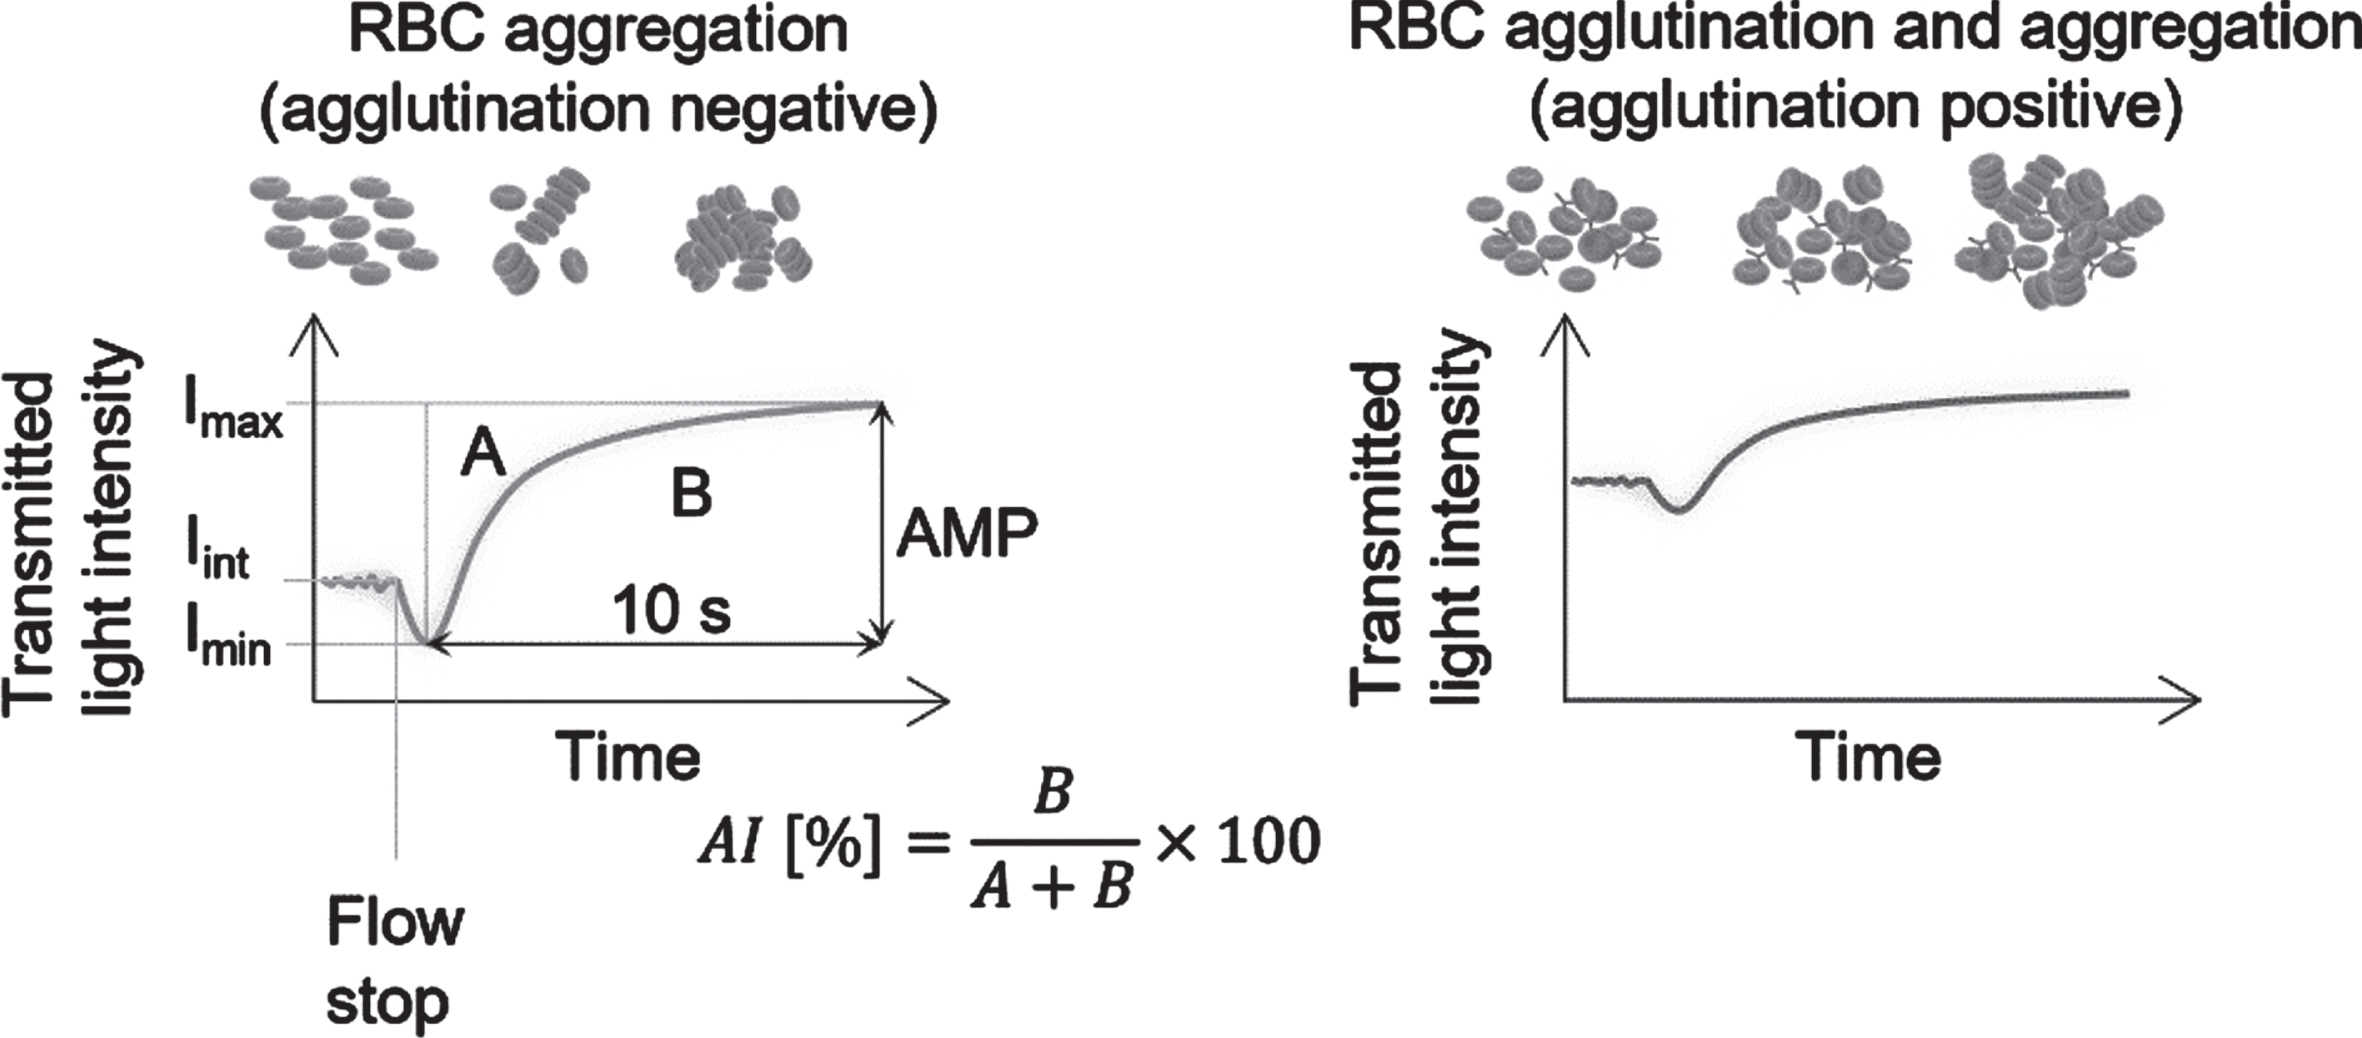
A previously reported device (MEK-1305; Nihon Kohden Corporation, Tokyo, Japan) was used to measure the syllectogram [17]. To dissociate aggregated RBCs, 60μL of blood was flowed at a shear rate of 335 s–1 through a glass cell (cross-sectional inner dimension, 0.8×0.8 mm) at 37°C, and then the flow was abruptly stopped. The light transmitted in the 10 s after the blood stopped was measured to obtain the aggregation parameters amplitude (AMP), aggregation index (AI), minimum transmitted light intensity (Imin), and maximum transmitted light intensity transmitted light intensity (Imax), as shown in Fig. 1. When the flow is stopped, erythrocytes first lose their alignment along the flow direction and become randomly oriented, resulting in a decrease in light transmittance. Then, they form rouleaux and the light transmittance increases as the aggregates grow over time. The initial intensity of light transmittance before flow cessation (Iint) was expected to be higher and AMP was expected to be smaller with hemagglutination (positive) compared with non-hemagglutination (negative) because agglutination would already be present at the beginning of the measurement. The blood was mixed with antibody reagents immediately before aspiration into the device. The first syllectogram measurement was performed 1 min after mixing, and the second was performed 3 min after mixing. These measurements were performed in the same way for each of the two replicate vials under each condition.
Fig. 1
Image of a syllectogram of agglutination-negative and -positive samples. The time at which the transmitted light intensity reaches the minimum value (Imin) after the flow was abruptly stopped was defined as the starting time. Maximum transmitted light intensity (Imax) was recorded at the end of the analysis time. Amplitude (AMP) is the difference between Imin and Imax. The aggregation index (AI) is ratio of area A to the total area of A and B. Area A is defined as the enclosed area between the syllectogram and Imin. Area B is defined as the area between the syllectogram and Imax.
2.3Observation of agglutination
To observe agglutination, 50μL of the sample used for the syllectogram measurement under each reagent mixing condition was dropped onto a glass slide and observed with the naked eye. Each sample was diluted 200-fold with saline or 150-fold with autologous plasma and observed under a microscope (IX71; Olympus Corporation, Tokyo, Japan) at room temperature (25°C).
3Results
3.1Observation of agglutination and aggregation
Figure 2A shows microscope images of samples diluted with saline solution and photographs of a drop of undiluted sample under each mixing condition. Agglutination was detected under the microscope only under the reagent mixture conditions in which agglutination occurred, and the degree of agglutination increased approximately in line with the reagent mixing ratio. In the drop of undiluted sample (insets in Fig. 2A), changes caused by agglutination could not be observed by the naked eye for any of the sample conditions. Thus, at the mixing ratios in this experiment, agglutination was so small that it could not be detected visually. In samples diluted with autologous plasma, agglutination and aggregation occurred, as shown in Fig. 2B.
Fig. 2
Microscope images of a representative sample mixed with antibody reagent. (A) Microscope images of samples diluted with saline at antibody reagent volume ratios of 2.5%, 5.0%, 7.5%, and 10% (scale bar: 20μm). The inset at the lower right of each panel shows a representative drop of sample before dilution with saline (scale bar: 5 mm). (B) Microscope images of type A blood diluted with autologous plasma at antibody reagent volume ratios of 2.5% and 10% (scale bar: 20μm).
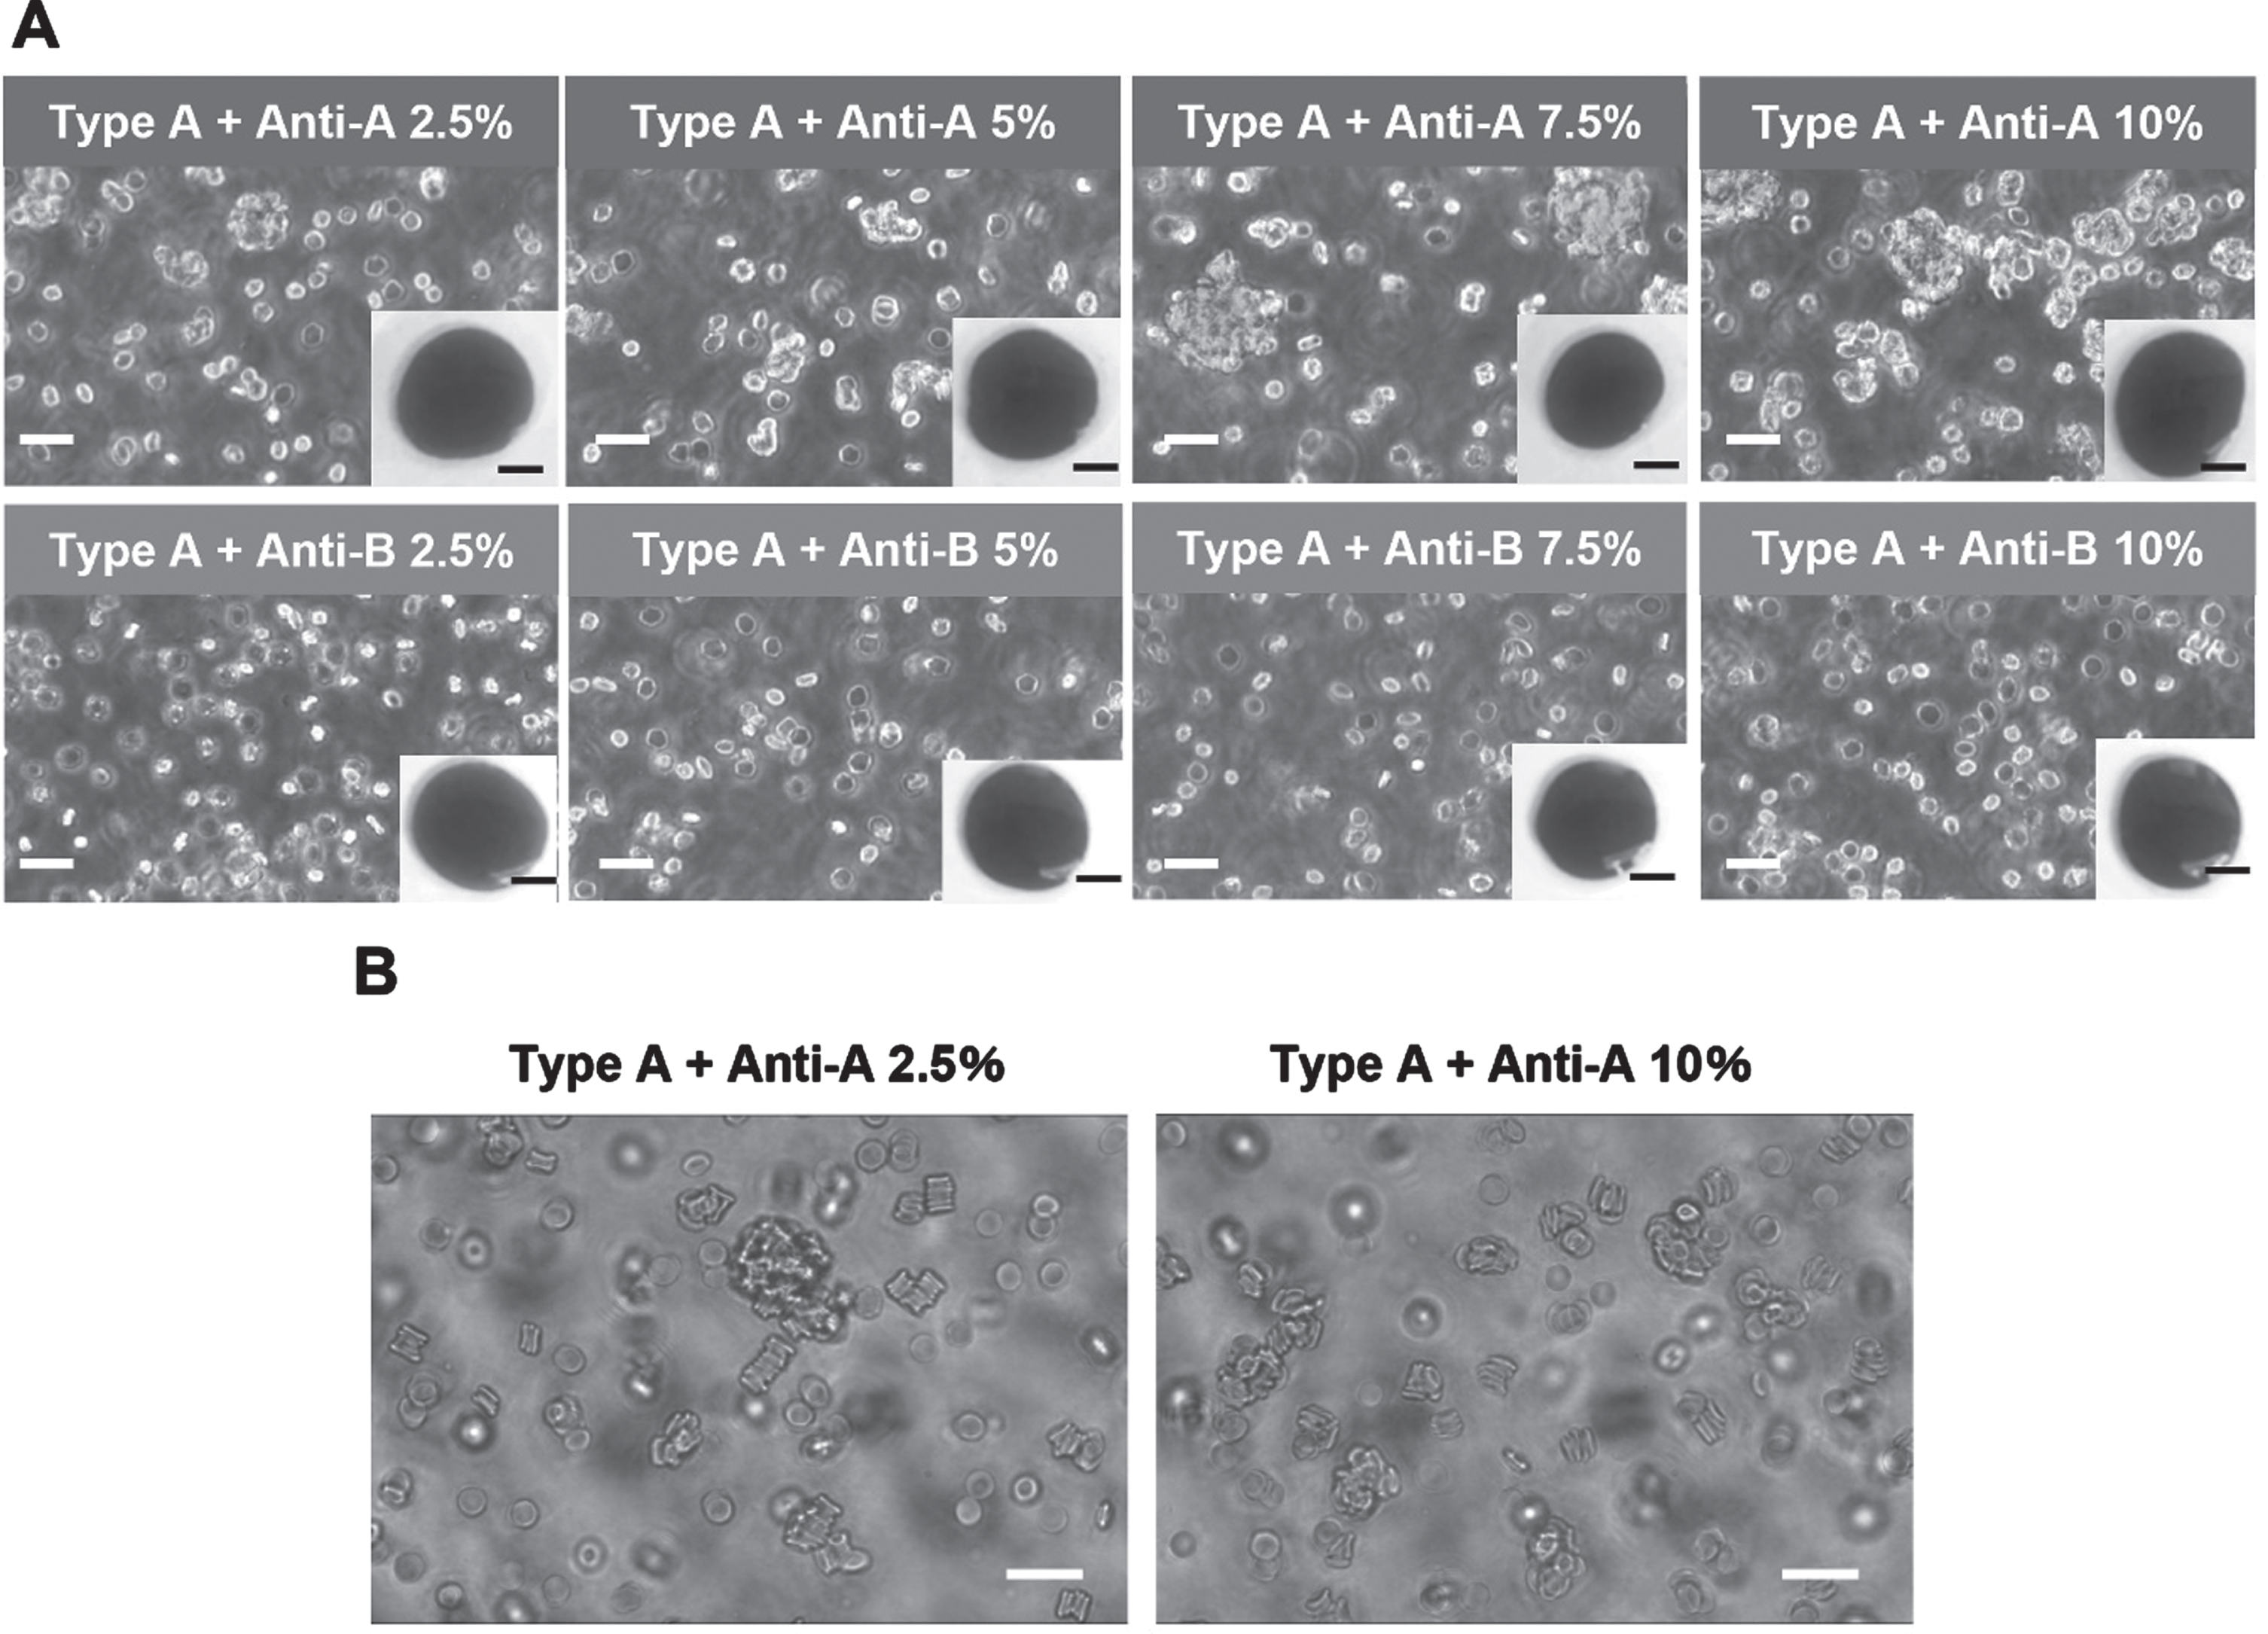
At a reagent mixing ratio of 2.5%, there was marked rouleaux formation, in which erythrocytes are linearly stacked as well as irregularly agglutinated. In comparison, at a reagent mixing ratio of 10%, there was slightly less rouleaux formation and more agglutination.
3.2Syllectograms and aggregation parameters
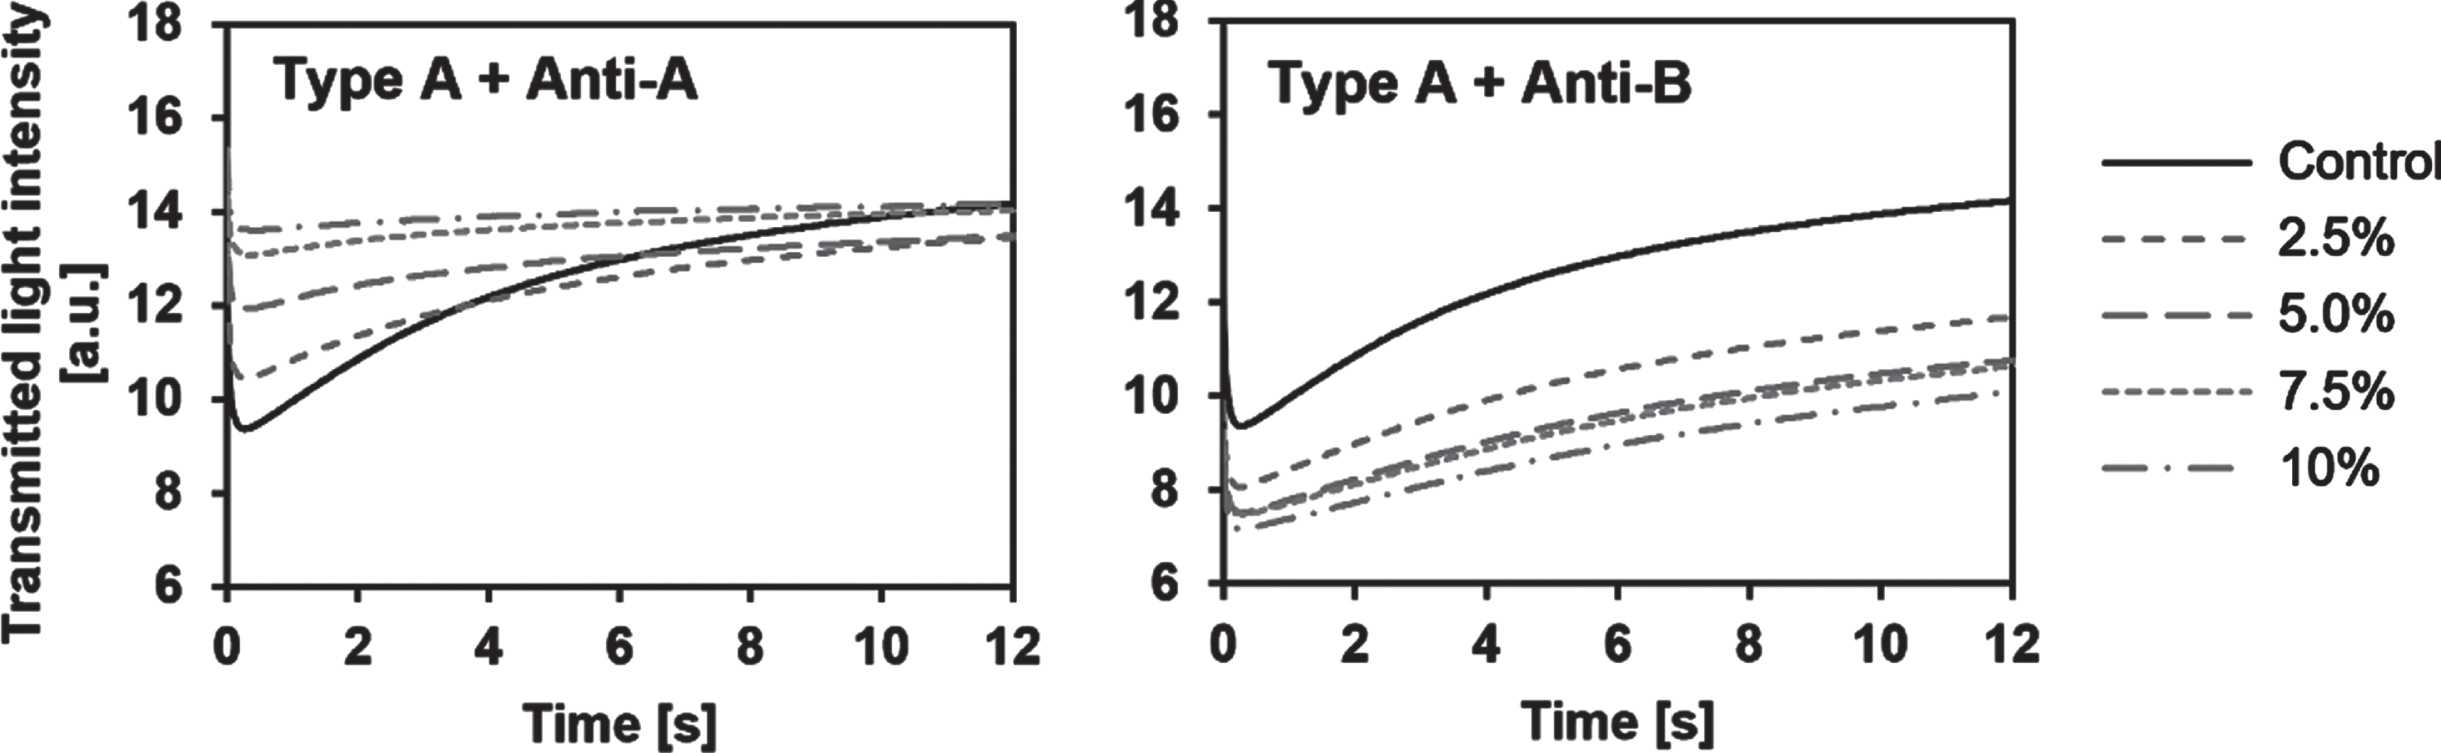
Representative syllectograms for each mixing ratio are shown in Fig. 3. At all mixing ratios, there was an increase in transmitted light intensity caused by rouleaux formation over time, but there was a marked difference in the syllectogram between positive and negative agglutination. Under the positive conditions, Imin increased and AMP decreased with an increasing mixing ratio. In contrast, Imin decreased with an increasing mixing ratio in the negative condition, and AMP was smaller than in the positive condition.
Fig. 3
Syllectogram from a representative measurement of agglutination-positive and -negative samples (blood type A with the addition of anti-A or anti-B antibody reagent at mixing rations of 0 (control), 2.5%, 5.0%, 7.5%, and 10).
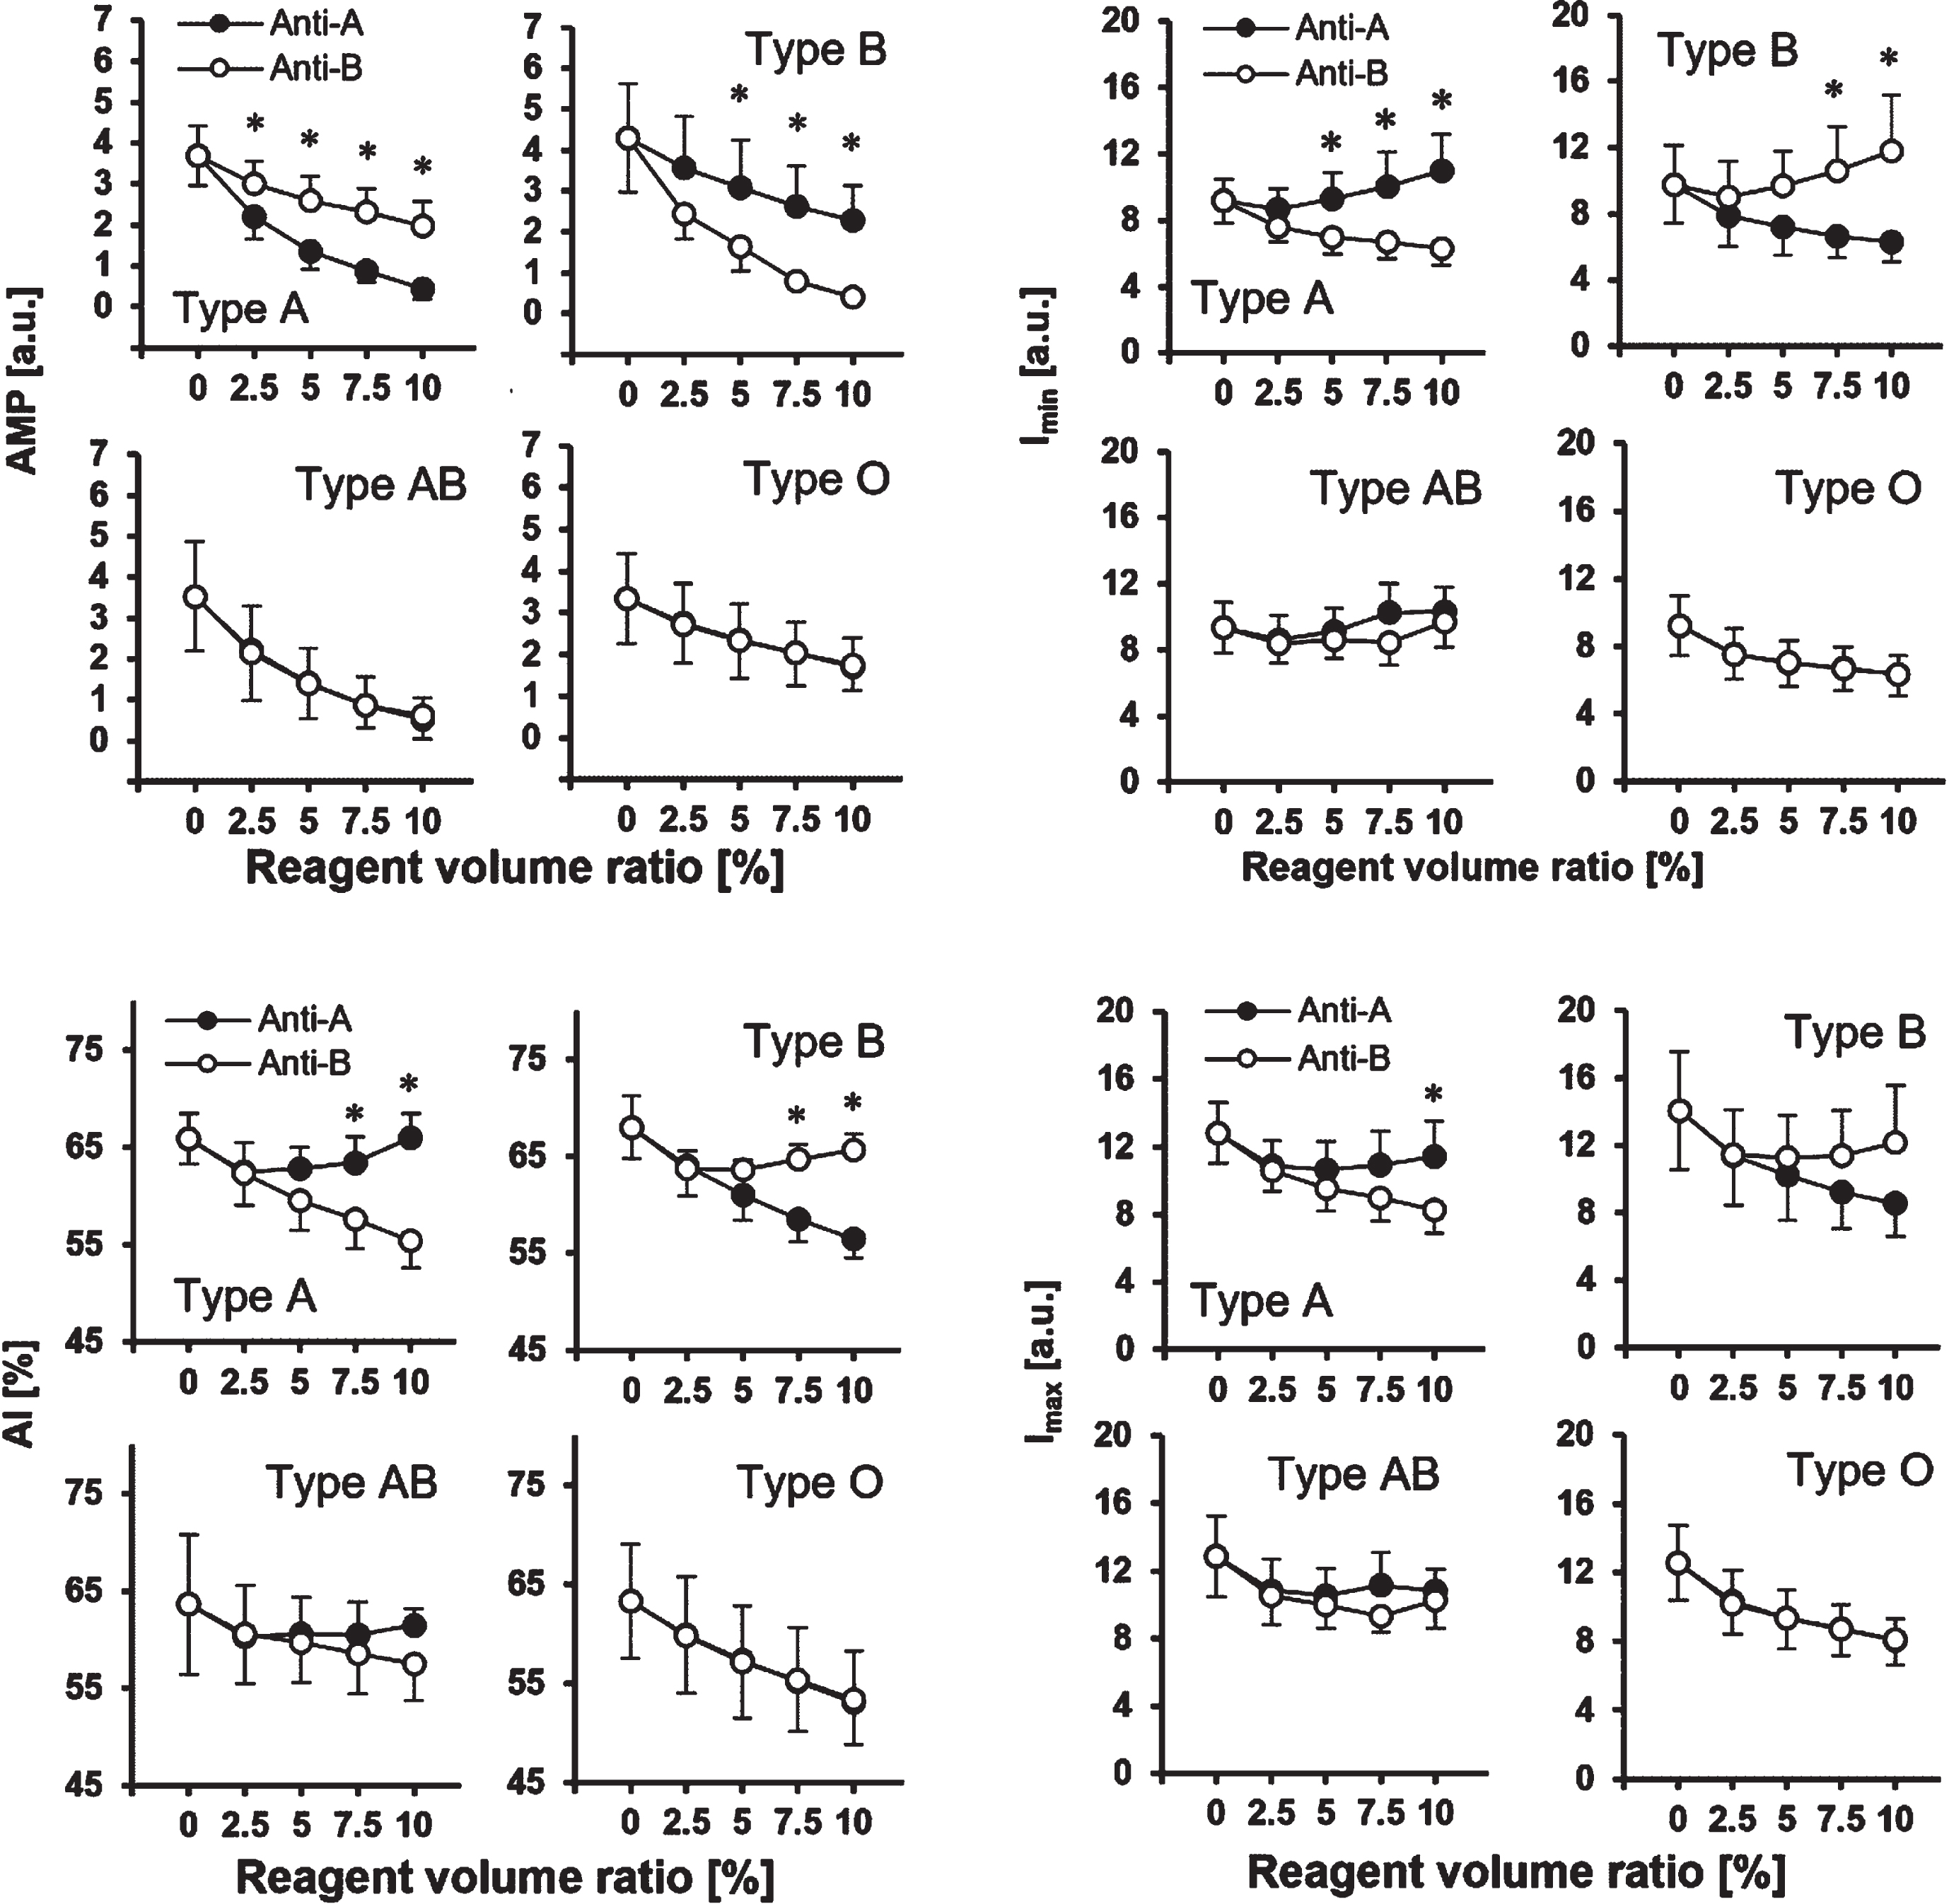
Next, the aggregation parameters AMP, AI, Imin, and Imax obtained through analysis of the syllectograms at each reagent mixing ratio and each blood type are shown in Fig. 4. Under the negative conditions, all aggregation parameters decreased with an increasing reagent mixing ratio, and there were no differences among the reagents for each blood type. The mean value of AMP, which indicates changes in aggregation, was significantly lower under the positive conditions than under the negative conditions at most mixing ratios for types A and B (p < 0.05), and the difference became larger as the reagent mixing ratio was increased. The initial transmitted light intensity without aggregation, Imin, tended to increase with an increasing reagent mixing ratio under positive conditions and was greater under positive conditions than under negative conditions at mixing ratios of 5% or higher (p < 0.05). The changes in AI and Imax with an increasing reagent mixing ratio were small for the positive samples, which showed significantly greater values than the negative samples at mixing ratios of 7.5% and 10% (p < 0.05). Thus, among all of the aggregation parameters, AMP was the most sensitive for detecting agglutination, even at small mixing ratios of the reagents. For types O and AB, no differences were observed in any of the aggregation parameters between samples mixed with anti-A and anti-B reagents.
Fig. 4
Relationship between the antibody reagent volume ratio and the aggregation parameters for each blood type. Error bars indicate SD (n = 5). *p < 0.05 (Welch’s t-test).
3.3Comparison of AMP between positive and negative samples
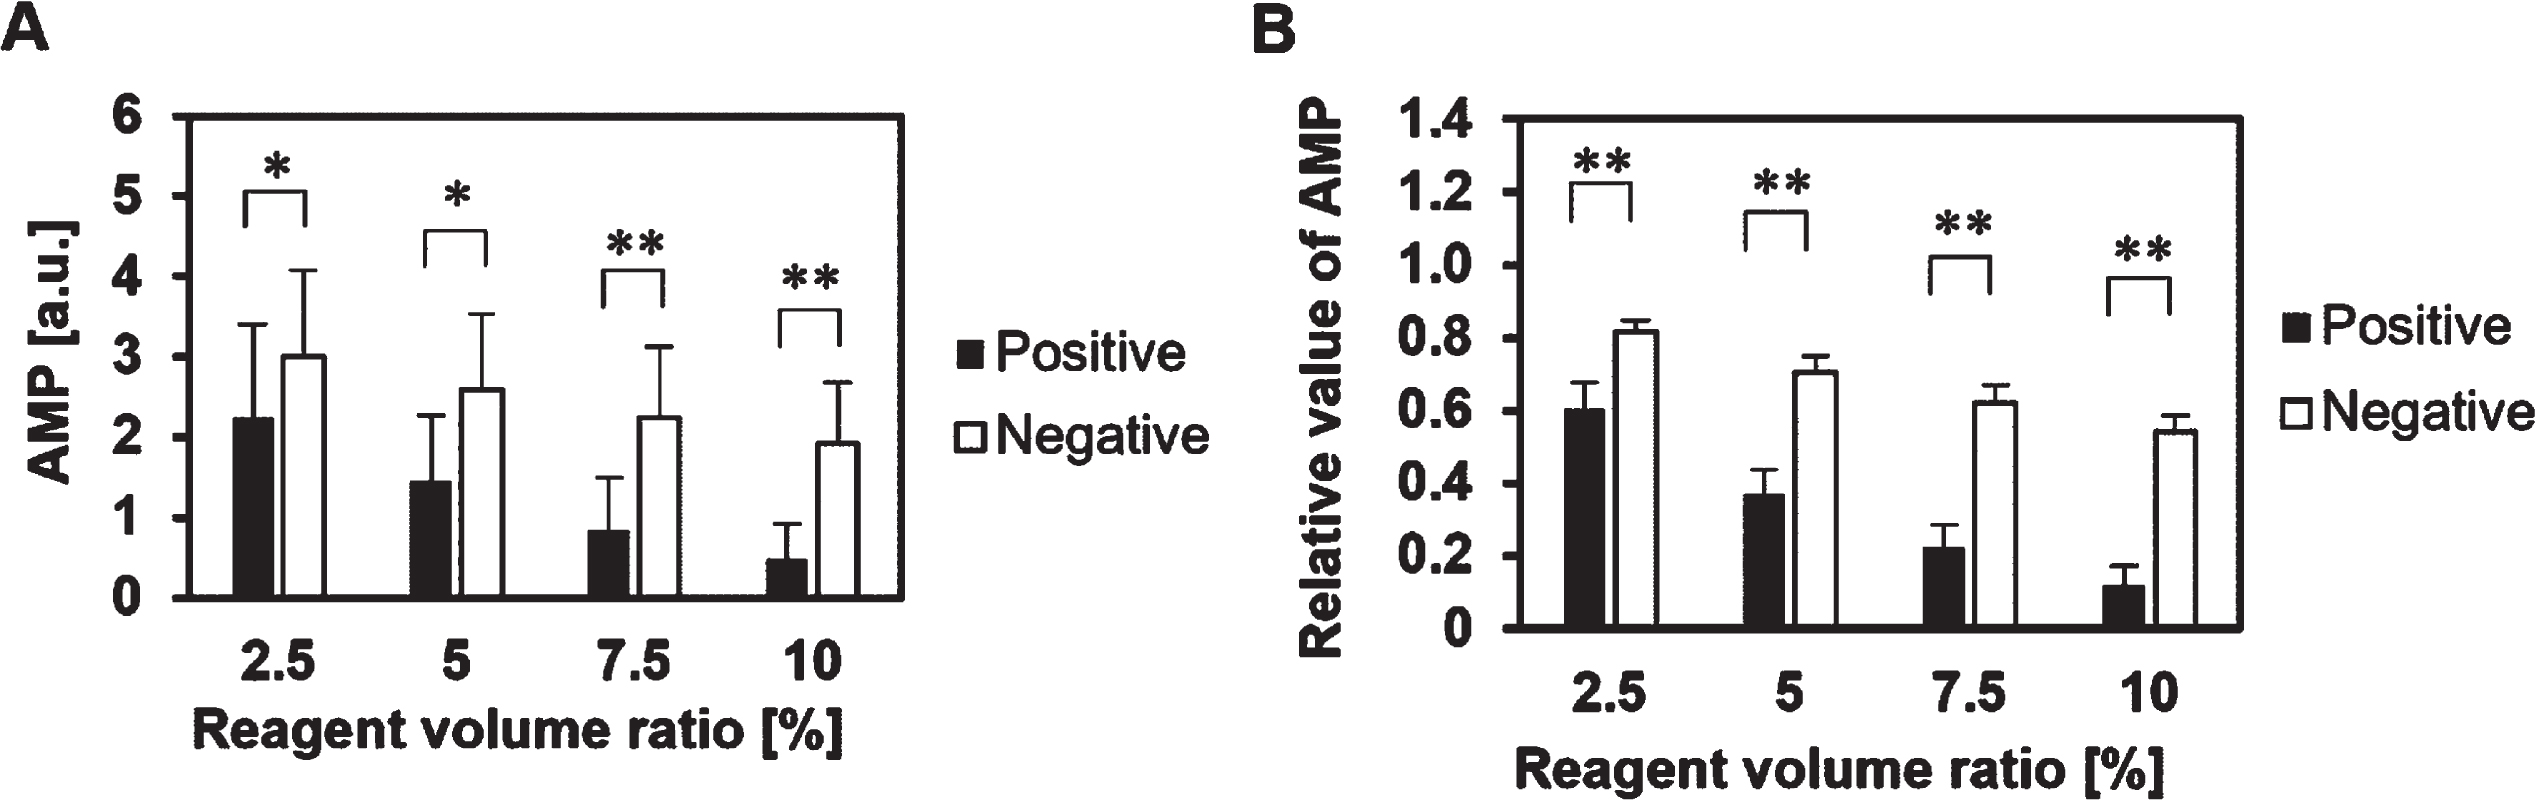
For use in blood typing, it is necessary to determine the difference between positive and negative results when all blood types and reagents are included. A comparison of the mean of AMP under all positive conditions (Type A + anti-A, Type B + anti-B, Type AB + anti-A and Type AB + anti-B) and that under all negative conditions (Type A + anti-B, Type B + anti-A, Type O + anti-A, Type O + anti-B) at each mixing ratio is shown in Fig. 5A. Significant differences in AMP were obtained between the positive and negative samples, but the variability from individual differences was relatively large. To cancel out individual differences in AMP and improve the accuracy of blood group determination, AMP relative to that of blood before regent mixing (control was obtained for each blood group. As shown in Fig. 5B, the relative AMP values obtained varied only slightly due to individual differences and, even at the lowest reagent mixing ratio of 2.5%, positive and negative results could be clearly distinguished. The average values of the positive and negative samples at each mixing ratio were used as the threshold for detecting agglutination, and the resulting blood groups were consistent with those determined by the test tube method.
Fig. 5
Comparison of the mean of the aggregation parameter AMP between the positive and negative conditions. (A) AMP. Error bars indicate SD (n = 20). *p < 0.05, **p < 0.01 (Welch’s t-test). (B) AMP relative to that of blood before reagent mixing. Error bars indicate SD (n = 20). **p < 0.01 (Welch’s t-test).
3.4Reproducibility of the duplicate measurement
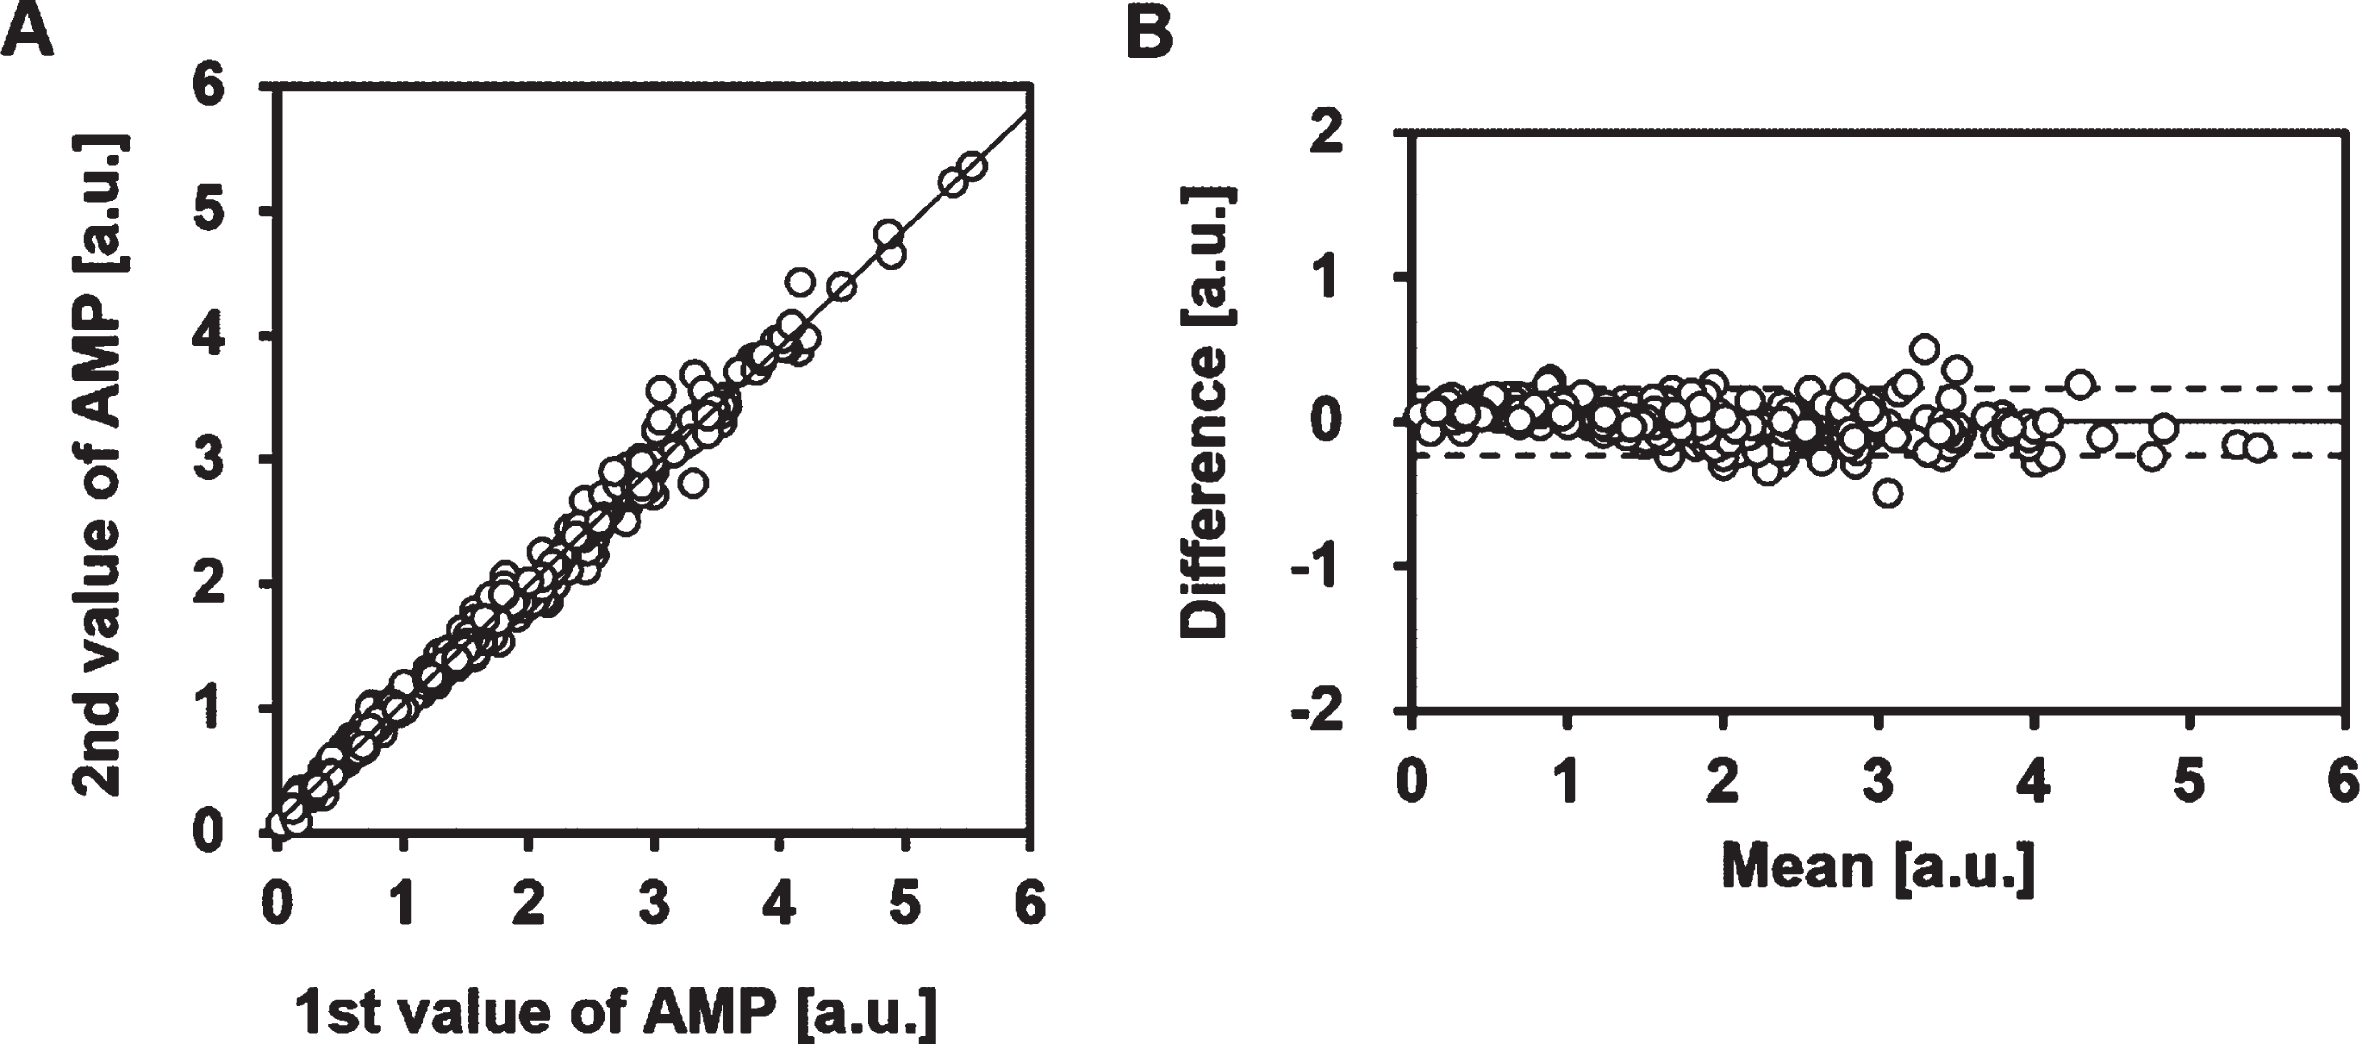
The reproducibility of the duplicate measurements of AMP in this method was good (Fig. 6), with no significant difference between the mean values of the first and second measurements (1.85±1.10 vs. 1.84±1.06, correlation coefficient r = 0.995 [p < 0.01]). The lack of a difference between the duplicate measurements indicates that there is no effect of time after reagent mixing under the present conditions.
Fig. 6
Reproducibility of the AMP value. (A) Relationship between the first and second measurements for AMP. Correlation coefficient for AMP, r = 0.995 (p < 0.01, n = 320). The solid line represents the regression line. The first measurement was performed 1 min after mixing, and the second measurement was performed 3 min after mixing. (B) Bland-Altman plot for the first and second measurements of AMP. The solid line represents the bias. The dotted line indicates 1.96 SD.
4Discussion
In this study, we proposed a new blood typing method using syllectometry, a technique for measuring RBC aggregation. Our approach does not require centrifugation and suspension of RBCs to detect agglutination and requires a much lower reagent mixing ratio than conventional methods. We successfully detected the RBC agglutination coexisting with RBC aggregation, which could not be accomplished with the naked eye or conventional methods.
To discuss the results of this experiment, we first need to consider the effects of the added reagents, excluding RBC agglutination, on the syllectogram—in other words, the effects under negative sample conditions. First, we considered the effect of dilution caused by mixing of the sample with reagents. A decrease in hematocrit results in a decrease in AI [17, 18], and AMP peaks around a hematocrit of 40% [19]. However, the reduction in hematocrit in this experiment was less than 10% relative to controls (hematocrit ranged from 36.8% to 49%), and the effect of AI and AMP is estimated to be a few percentage points in that range [19]. Thus, the main reasons for the decreases in AI and AMP in the negative sample were factors other than hematocrit. The antibody reagents contain albumin, which has been reported to interfere with erythrocyte aggregation [20]; thus, albumin in the reagent may be a factor in decreases in AMP, AI, and Imax in the negative sample. Although Imin, the minimum transmitted light intensity, should increase with a decreasing hematocrit [17], Imin decreased in our experiment (Fig. 4). We examined the absorbance properties of the reagent to determine the cause of this discrepancy but found no absorption near the LED wavelength. In addition, there were no significant changes in erythrocyte morphology, as confirmed by microscope images (Fig. 2), or in the mean corpuscular volume obtained by a hematology analyzer. Based on these results and because Imin increases as erythrocyte aggregability increases [17], the decrease in Imin in the negative sample may be due to a reduction in erythrocyte aggregability caused by albumin.
The shear rate in this system (335 s–1) was at an intermediate level between the shear rate required for the dissociation of erythrocyte aggregation (200 s–1) [21] and that required for the dissociation of antigen–antibody binding (600 s–1) [22]. Thus, in the positive case, the transmitted light intensity should increase relative to the control because the RBC aggregates were dissociated at the start of the syllectogram measurement, but agglutination remained. The result with the positive samples showed that Imin increased as the mixing ratio was increased from 2.5% to 10% but was lower at a mixing ratio of 2.5% compared with the control. This decrease in Imin between the control and 2.5% is presumably due to reagent components other than blood group antibodies. In contrast, AI and Imax in the positive sample did not change much as the mixing ratio was increased. This result may be because the RBC agglutination already present at the start of the syllectogram may have reduced the number of single erythrocytes available for rouleaux formation, resulting in a slower increase in aggregate size and no significant increase in transmitted light intensity.
In this study, there was a clear difference in the relative value of AMP between positive and negative samples, even at a reagent mixing ratio of 2.5%. According the manufacturer’s instructions for the clinical blood typing reagent used in this study, a mixing ratio of 50% should be used in the slide and tube methods. The lowest mixing ratio used in this study was 10μL added per 400μL whole blood, which was 1/20th of the recommended amount. Nevertheless, it was still possible to detect agglutination with our method, even though it could not be detected with the naked eye. In previous work [23], commercially available antibody reagents were used at mixing ratios of several tens of percent or more and, compared with those methods, our method is highly sensitive and able to detect agglutination even at low reagent concentrations. It should be noted that this technique is different from absorbance measurement [24], which is a static measurement technique in a chamber. As shown in Fig. 3, when only a small amount of antibody reagent is mixed with whole blood, a shear flow to dissociate the rouleaux is required to detect minute agglutinations because the transmitted light intensity increases with time due to rouleaux formation. Therefore, static absorbance measurement [24] and other static measurement techniques should not be able to detect minute agglutinations in whole blood caused by small amounts of antibody reagents. However, although erythrocyte aggregability does not differ by blood type [25], it depends on plasma fibrinogen concentration [18] and varies not only between individuals, but also according to their physical condition. Therefore, in our method, it is necessary to use the value of the aggregation parameter relative to the control, and the detection accuracy may decrease in samples with low aggregation. If the relative values were not used, then it would be necessary to unify hematocrit levels and use buffers of macromolecules such as dextran instead of plasma in order to eliminate the influence of individual differences in hematocrit and plasma proteins on the results. However, this technology provides a new blood typing method that differs from previously reported methods and has the advantage of not requiring time-consuming pretreatments such as centrifugation and preparation of dilute RBC suspensions. Furthermore, forward ABO typing can be performed with a measurement time of only 10 s and with an antibody reagent mixing ratio of 1/5th to 1/20th of the usual amount, which may help to shorten and simplify the testing process and reduce costs.
Acknowledgments
The authors thank Dr. Teruhiko Negishi (Negishi Internal Medicine and Neurology Clinic, Saitama, Japan) for his help in blood collection. This research received no specific grant from any funding agency in the public, commercial, or not-for-profit sectors.
References
[1] | Sharma S , Sharma P , Tyler LN . Transfusion of blood and blood products: Indications and complications. Am Fam Physician. (2011) ;83: (6):719–24. |
[2] | Landsteiner K . Zur Kenntnis der antifermentativen, lytischen und agglutinierenden Wirkungen des Blutserums und der Lymphe. Zentralbl Bakteriol. (1900) ;27: :357–62. |
[3] | Li HY , Guo K . Blood group testing. Vol. 9, Frontiers in medicine. Lausanne, Switzerland: Frontiers Media S.A.; (2022) . |
[4] | Mujahid A , Dickert FL . Blood group typing: From classical strategies to the application of synthetic antibodies generated by molecular imprinting. Sensors (Basel). (2015) ;16: (1):51. |
[5] | Lapierre Y , Rigal D , Adam J , Josef D , Meyer F , Greber S , et al. The gel test: A new way to detect red cell antigen-antibody reactions. Transfusion. (1990) ;30: (2):109–13. |
[6] | Xu W , Wan F , Lou Y , Jin J , Mao W . Evaluation of an automated microplate technique in the Galileo system for ABO and Rh(D) blood grouping. Clin Lab. (2014) ;60: (2):241–4. |
[7] | Ashiba H , Fujimaki M , Awazu K , Fu M , Ohki Y , Tanaka T ,et al. Hemagglutination detection for blood typing based on waveguide-mode sensors. Sens Biosensing Res 3: :(2015) ;59–64. |
[8] | Yamamoto K , Sakurai R , Motosuke M . Fully-automatic blood-typing chip exploiting bubbles for quick dilution and detection. Biomicrofluidics. (2020) ;14: (2):024111. |
[9] | Chang YJ , Fan YH , Chen SC , Lee KH , Lou LY . An automatic lab-on-disc system for blood typing. SLAS Technol. (2018) ;23: (2):172–8. |
[10] | Houngkamhang N , Vongsakulyanon A , Peungthum P , Sudprasert K , Kitpoka P , Kunakorn M , et al. ABO blood-typing using an antibody array technique based on surface plasmon resonance imaging. Sensors (Basel). (2013) ;13: (9):11913–22. |
[11] | Bäumler H . Basic phenomena of red blood cell rouleaux formation. Biorheology. (1999) ;36: (5-6):439–42. |
[12] | Yudin J , Heddle NM . A 13-question approach to resolving serological discrepancies in the transfusion medicine laboratory. Lab Med. (2014) ;45: :193–206. |
[13] | Ami RB , Barshtein G , Zeltser D , Goldberg Y , Shapira I , Roth A , et al. Parameters of red blood cell aggregation as correlates of the inflammatory state. Am J Physiol Heart Circ Physiol. (2001) ;280: (5):H1982–8. |
[14] | Waider KL . Rouleaux and saline replacement. Immunohematology. (2018) ;34: (3):91–2. |
[15] | Zijlstra WG . Syllectometry, a new method for studying rouleaux formation of red blood cells. Acta Physiol Pharmacol Neerl. (1958) ;7: :153–4. |
[16] | Baskurt OK , Meiselman HJ , Kayar E . Measurement of red blood cell aggregation in a “plate-plate” shearing system by analysis of light transmission. Clin Hemorheol Microcirc. (1998) ;19: (4):307–14. |
[17] | Higuchi M , Watanabe N . A rapid and accurate method for estimating the erythrocyte sedimentation rate using a hematocrit-corrected optical aggregation index. PLoS One. (2022) ;17: (7):e02770977. |
[18] | Korotaeva TV , Firsov NN , Bjelle A , Vishlova MA . Erythrocytes aggregation in healthy donors at native and standard hematocrit: The influence of sex, age, immunoglobulins and fibrinogen concentrations. Standardization of parameters. Clin Hemorheol Microcirc. (2007) ;36: (4):335–43. |
[19] | Shin S , Yang Y , Suh JS . Measurement of erythrocyte aggregation in a microchip stirring system by light transmission. Clin Hemorheol Microcirc. (2009) ;41: (3):197–207. |
[20] | Reinhart WH , Nagy C . Albumin affects erythrocyte aggregation and sedimentation. Eur J Clin Invest. (1995) ;25: (7):523–8. |
[21] | Friebel M , Helfmann J , Müller G , Meinke M . Influence of shear rate on the optical properties of human blood in the spectral range 250 to 1100nm. J Biomed Opt. (2007) ;12: (5):054005. |
[22] | Rasia RJ , Rasia-Vaiverde JR , Stoltz JF . Weak “A” blood subgroup discrimination by a rheo-optical method: A new application of laser backscattering. Opt Eng. (1996) ;35: (1). |
[23] | Pimenta S , Nobrega JM , Duarte FM , Minas G , Soares FO . Automatic electronic system to human blood typing. Procedia Eng. (2012) ;47: :647–50. |
[24] | Ramasubramanian M , Anthony S , Lambert J . Simplified spectraphotometric method for the detection of red blood cell agglutination. Appl Opt. (2008) ;47: (22):4094–105. |
[25] | Vayá A , Martínez Triguero M , Ricart A , Plumé G , Solves P , Corella D , et al. Erythrocyte aggregability and AB0 blood groups. Clin Hemorheol Microcirc. (2009) ;41: (1):67–72. |


