
Skin microcirculation reactivity to local thermal hyperaemia in patients with COVID-19 — A pilot observational study
Abstract
BACKGROUND:
Endothelial dysfunction and microvascular disturbances are suggested to play a key role in higher morbidity and worse prognosis in patients with COVID-19 and cardiometabolic diseases.
OBJECTIVE:
Study was aimed to establish relationships between the skin microcirculation parameters and various clinical and laboratory indicators.
METHODS:
The study included 18 patients with moderate disease according to WHO criteria. Skin microcirculation measurements were performed by laser Doppler flowmetry using a heating test on the hairy skin of the right forearm.
RESULTS:
Baseline perfusion only correlated with C-reactive protein (Rs = 0.5, p = 0.034). Microcirculation indices characterising the development of hyperaemia during the first minute of heating (LTH1 and AUC60) showed significant correlations (Rs from 0.48 to 0.67, p < 0.05) with indices of general blood analysis and blood coagulation (fibrinogen, D-dimer, haemoglobin, erythrocyte count and haematocrit). Indexes characterising the dynamics of hyperaemia development over longer time intervals showed correlation with the glomerular filtration rate (Rs = 0.6, p = 0.009).
CONCLUSION:
Known COVID-19 risk factors (haemorheological parameters, age) are correlated with the microvascular reactivity to heating in patients with COVID 19. We suggest that, prospectively, the method of laser Doppler flowmetry could be used for non-invasive instrumental assessment of microcirculatory disorders in patients with COVID-19.
1Introduction
Despite the large number of studies on COVID-19, we do not have exhaustive data on the pathogenesis of this disease [1]. It is known that several diseases and conditions (old age, obesity, cardiovascular diseases, diabetes mellitus, chronic lung diseases) are associated with a more severe course and/or poor prognosis of COVID-19 [2–4]. E. Tibirica and A. De Lorenzo suggest that endothelial dysfunction plays a key role in higher morbidity and worse prognosis in patients with COVID-19 and cardiometabolic diseases [5].
SARS-CoV-2 is known to infect cells in the body via the transmembrane angiotensin-converting enzyme-2 (ACE-2) receptor, which is expressed in several tissue and organ cell types, including endothelial cells [5, 6]. It is currently unknown whether vascular abnormalities in COVID-19 are associated with endothelial cell invasion by the virus [1]. In certain cases, histological studies of tissues of COVID-19 patients show direct viral invasion of endothelial cells and development of diffuse endotheliitis [6] and endothelial disfunction [7, 8]. COVID-19-associated endotheliitis may be the cause of systemic microcirculatory dysfunction in various vascular beds. Varga Z. et al. suggest that this hypothesis may form the basis for a selection of therapies that promote endothelial stabilization in patients with COVID-19, which may be particularly important in patients with pre-existing endothelial dysfunction (e.g., patients who smoke, individuals with hypertension, diabetes, obesity and established cardiovascular disease) [6]. Hypercoagulation with microvascular thrombosis and increased cytokines (cytokine storm) also suggest microcirculatory dysfunction in patients with COVID-19 [9].
Available knowledge about the pathogenesis of COVID-19 suggests that evaluation of microcirculation in patients with coronavirus infection may be informative [5, 9, 10]. In his review, Martini R. suggests that monitoring the microcirculatory status in critical COVID-19 patients may be useful for more competent patient management and could potentially help save many lives [9]. Dynamic assessment of microcirculation is most convenient when performed with the help of non-invasive technologies that allow the assessment of blood flow in skin vessels. Examples of methods allowing non-invasive assessment of skin microcirculation include laser Doppler flowmetry (LDF), laser speckle-contrast imaging (LSCI), novel method of incoherent optical fluctuation flowmetry (IOFF), capillaroscopy, etc. [9–13].
The current study aimed to establish relationships between the parameters of skin microcirculation registered with LDF and various clinical and laboratory parameters of patients in patients with COVID-19.
2Materials and methods
2.1Patients
A cross-sectional observational study was conducted. Patients with moderate disease according to WHO criteria were included in the study [14]. All patients were diagnosed with “Coronavirus infection caused by COVID-19 (confirmed). Community-acquired bilateral pneumonia” based on PCR swab results. A total of 18 patients with new coronavirus infection, 8 women (44.4%) and 10 men (55.6%) aged 36 to 80, were included in the study. The mean patient age was 56.8±10.4 years.
All patients signed an informed consent to participate in the study. The study protocol corresponded to the principles outlined in the Declaration of Helsinki and was approved at the meeting of the Independent Ethics Committee of the Moscow Regional Clinical Research Institute (No. 4 of May 13, 2020).
2.2Instrumental and laboratory examination
On admission, patients were clinically examined with complaint analysis, medical history data, and objective methods of examination.
The state of lung tissue and prevalence of inflammatory changes were assessed by CT scan. The study was performed on a Phillips “Brilliance CT 64 slice”. The volume of the pulmonary tissue involved in the pathological process was calculated, and according to the following data the degree of severity was assessed: CT-0 - no signs of viral pneumonia; CT-1 - mild form of pneumonia with areas of ground-glass opacity (GGO), severity of pathological changes less than 25%; CT-2 - moderate pneumonia, 25–50% of lungs were affected; CT-3 - moderate pneumonia, 50–75% of lungs were affected; CT-4 - severe form of pneumonia, >75% of lungs were affected. Evaluation and interpretation of the data were performed by the specialists of the radiological department of the N.I. Pirogov National Medical Center.
SpO2 was measured using a PM-60 (Shenzhen Mindray Bio-Medical Electronics Co., LTD.) pulse oximeter at least twice a day during the entire period of the patients’ stay in the department.
All patients underwent: a general blood count (haematology analyser XS-1000i, Sysmex, Japan); coagulogram (haemostasis testing system CA-600, Sysmex, Japan); blood chemistry (automatic biochemical analyser Olympus AU400, Beckman Coulter Inc., USA); inflammatory markers (C-RP, procalcitonin test); measurements of blood oxygen status (ABL800 FLEX Radiometer).
2.3Measurement of skin blood microcirculation
The study of skin blood microcirculation was performed using LAKK-02 and LAKK-TEST systems (SPE LASMA, Russian Federation).
At the time of measurement, the patient was in the sitting position. The patient’s right arm was placed horizontally on the table. Measurement of skin blood microcirculation was performed on the dorsal surface of the forearm, 4 cm proximal to the wrist joint. The heating element of the module “LAKK-TEST” and the sensor of the device “LAKK-02” were fixed to the skin using adhesive tape. Measurements were taken after a 10-minute adaptation of the patient to the temperature conditions of the room. The temperature of the heating element was set at 32.2 °C, after which the baseline perfusion level was recorded for 2 minutes. Local heating of the skin to 42.1–42.2 °C was then performed at a rate of ∼1.5 °C/s and recording was continued for 5 minutes.
Post-registration data processing was performed in Excel 2019 (Microsoft corp., USA). Perfusion level (in perfusion units - PU) recorded at a frequency of 20 Hz was exported to Excel and the following set of indices characterising the state of skin microcirculation was calculated:
• Baseline perfusion level (BP), the average value of perfusion before heating was turned on;
• Local thermal hyperaemia (LTH1,2,3,4,5) - the average value of perfusion during 1, 2, 3, 4 and 5 minutes of heating, respectively;
• Slope of the section of the microcirculatory curve (Slope60,120,180,240,300) - the tangent of the slope of the regression straight line, plotted to the section of the perfusion curve from the moment of heating to 60, 120, 180, 240 and 300 seconds of heating multiplied by 10;
• Area under the microcirculatory curve (AUC60,120,180,240,300) - area under the section of the microcirculatory curve to the baseline of perfusion during the first 60, 120, 180, 240 and 300 seconds of heating.
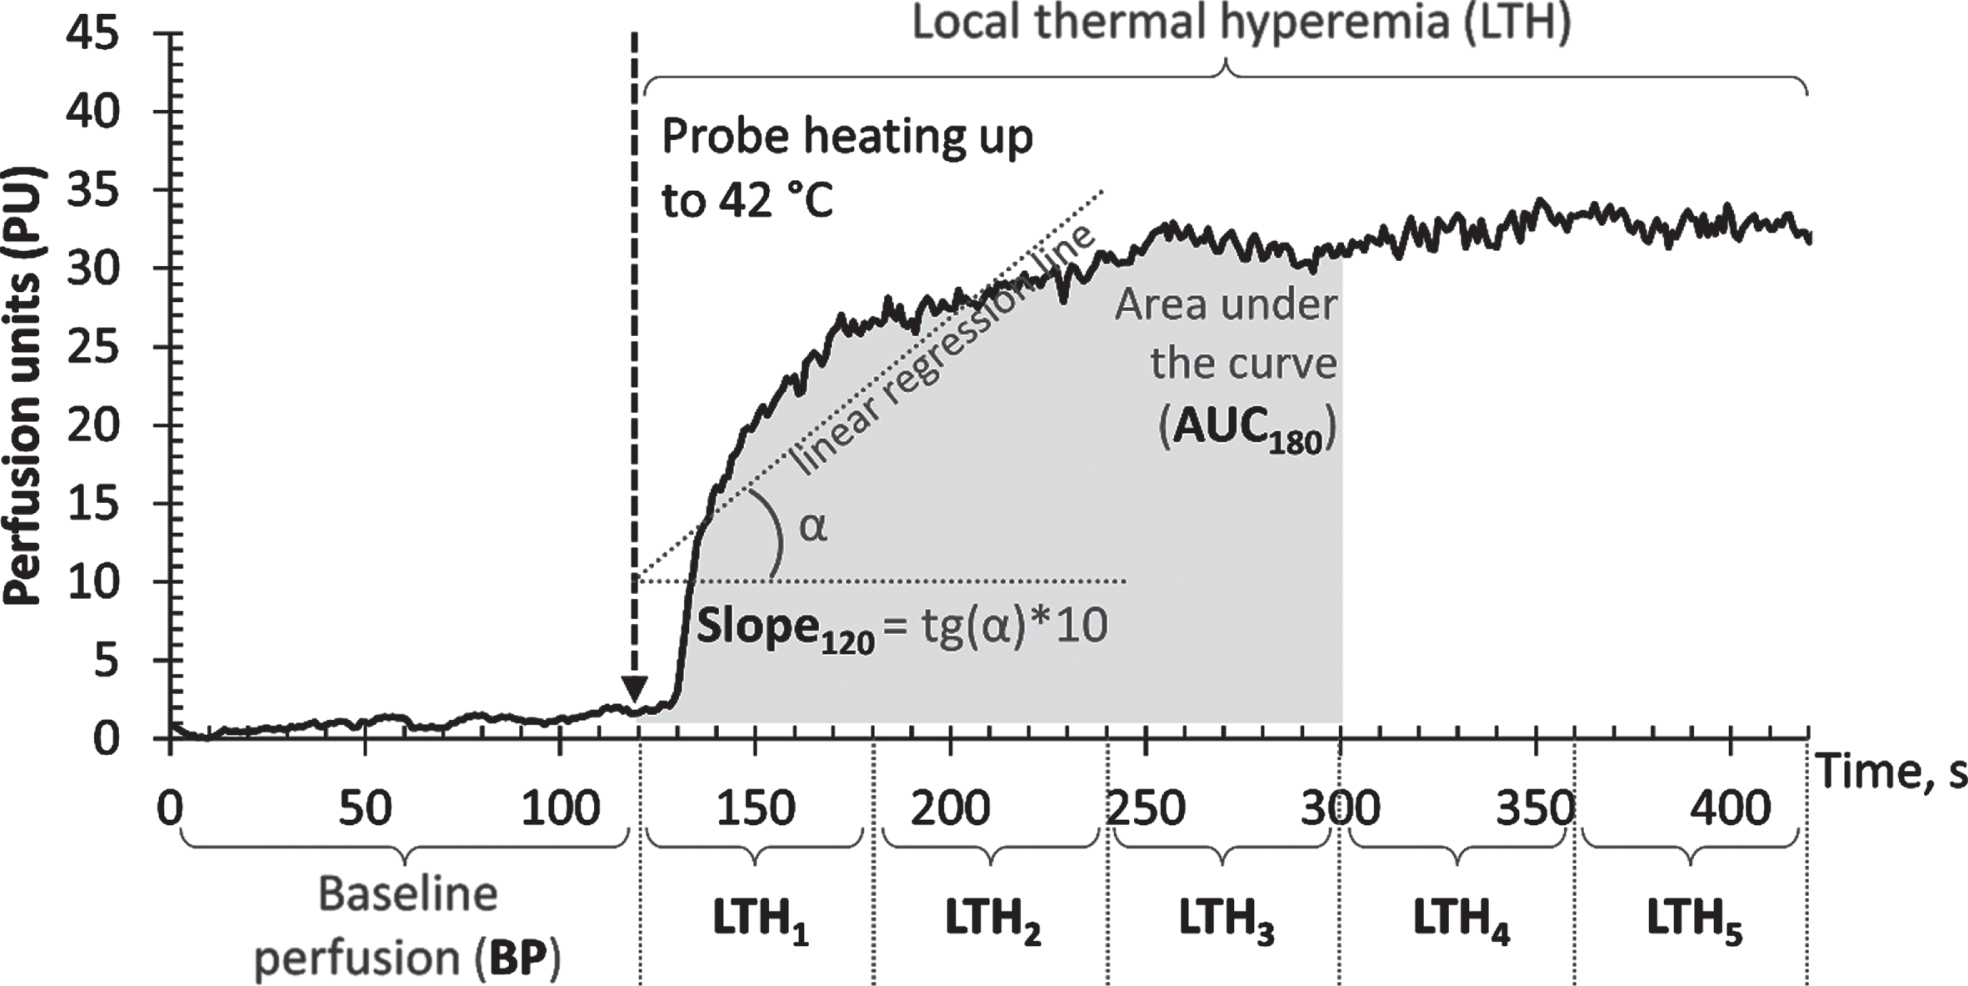
An example of the microcirculatory curve with the designation of the calculated parameters is shown in Fig. 1.
Fig. 1
Example of a microcirculatory curve with the designation of calculated parameters: baseline perfusion (BP), local thermal hyperaemia (LTH1,2,3,4,5), slope of the section of the microcirculatory curve (Slope60,120,180,240,300), area under the section of the microcirculatory curve (AUC60,120,180,240,300).
2.4Statistical analysis
Statistical analysis was performed using IBM SPSS Statistics v25 (IBM Corp., USA). Arithmetic mean values and standard deviations (M±SD) were calculated for normally distributed quantitative variables; medians and quartiles (Me [LQ; UQ]) were calculated for variables with a distribution other than normal. Hypotheses about the normality of the distributions of quantitative variables were tested using the Shapiro-Wilk test. Relative and absolute frequencies were calculated for qualitative variables. The quantitative variables in the two groups were compared using the Mann-Whitney test. The Spearman correlation coefficient was calculated to analyse the relationship between the two quantitative variables.
The statistical significance level (α) was accepted as 0.05, while the null hypotheses were rejected at p < α.
The statistical power analysis was performed with the program G*Power 3.1.9.6 (Universität Düsseldorf) [15]. At a significance level (α) of 0.05 and with a statistical power (1-β) of 0.8 the sample size of 18 patients was sufficient to detect an effect size (ρ) of 0.57 or higher.
3Results
The characteristics of the patients included in the study are shown in Table 1. Among 18 patients, 2 patients (11.1%) had normal body weight (BMI < 25), 7 patients (38.9%) had excess body weight (25≤BMI < 30), and 9 patients (50%) were obese (BMI > 30). Arterial hypertension was detected in 8 (44.4%) patients, type 2 diabetes mellitus in 5 (27.8%) patients.
Table 1
Characteristics of patients included in the study
| Parameters | Patients with COVID-19 n = 18 | |
| Age (years), M±SD | 56.8±10.4 | |
| Sex (Male / Female), n (%) | 10 (55.6%) / 8 (44.4%) | |
| BMI (kg/m2), M±SD | 31.4±6.1 | |
| Systolic Blood Pressure (mm Hg), M±SD | 131.9±25.6 | |
| Diastolic Blood Pressure (mm Hg), M±SD | 85.8±15.5 | |
| Heart rate (heats/min), M±SD | 73±15 | |
| SpO2 (%), M±SD | 95.9±1.5 | |
| Body temperature on the day of measurement (°C), Me [LQ; UQ] | 36.8 [36.5; 37] | |
| Percentage of lung involvement (%), M±SD | Left lung | 42.5 [30; 50] |
| Right lung | 40 [25; 55] | |
| Severity of lung damage (CT staging), n (%) | 1 | 2 (11.1%) |
| 2 | 9 (50%) | |
| 3 | 7 (38.9%) | |
| Comorbidity | Arterial hypertension, n (%) | 8 (44.4%) |
| Diabetes mellitus, n (%) | 5 (27.8%) | |
All patients had moderate disease according to WHO criteria. A body temperature above 37°C on the day of measurement was detected in only 2 (11.1%) patients.
The results of the laboratory examination of the patients are presented in Table 2. Fibrinogen levels were higher than the reference values in 17 (94.4%) patients. C-RP and ferritin levels were elevated in 16 (88.9%) patients. Lymphocyte and EPI levels were decreased in 14 (77.8%) patients. D-dimer was elevated in 12 (66.7%) patients.
Table 2
Results of laboratory examination of patients with COVID-19
| Parameters | Laboratory Reference Ranges | Patients with COVID-19, n = 18 |
| Procalcitonin, ng/ml, Me [LQ; UQ] | 0–0.046 | 0.04 [0.033; 0.063] |
| C-RP, mg/l, Me [LQ; UQ] | 0–5.0 | 10 [7.2; 16.6] |
| aPTT, s, Me [LQ; UQ] | 24–35 | 33.4 [30.8; 34.9] |
| Prothrombin time, s, M±SD | 9.8–18 | 14.5±1.3 |
| Prothrombin % by Quik, M±SD | 70–130 | 85±12.1 |
| Fibrinogen, g/l, M±SD | 2–4 | 6.2±1.18 |
| D-dimer, μg/mL, Me [LQ; UQ] | 0–0.5 | 0.59 [0.42; 0.83] |
| Haemoglobin, g/l, M±SD | 120–140 | 129.7±19.7 |
| Red blood cells, 106/μl, M±SD | 3.9–4.7 | 4.4±0.6 |
| Mean erythrocyte volume, fl, Me [LQ; UQ] | 80–100 | 90.3 [87.6; 94] |
| Haematocrit, %, Me [LQ; UQ] | 36–42 | 41.1 [37.5; 42.8] |
| Platelets, 109/l, M±SD | 150–400 | 291.5±151.4 |
| White blood cells, 109/l, M±SD | 4.0–9.0 | 6.67±2.44 |
| Lymphocytes, 109/l, Me [LQ; UQ] | 19–37 | 2.24 [1.45; 3.06] |
| Creatinine, μmol/l, Me [LQ; UQ] | 53–97 | 81.5 [74.6; 90.2] |
| GFR (EPI), ml/min/1.73 m2, M±SD | >90 | 78.49±21.16 |
| Total bilirubin, μmol/L, M±SD | 5–21 | 10.26±3.42 |
| Ferritin, μg/L, Me [LQ; UQ] | 10–120 | 483.4 [184.3; 641.9] |
The results of the microcirculation study by laser Doppler flowmetry are presented in Table 3. A correlation analysis was performed between microcirculation indices and age, physical examination, and laboratory findings in patients with COVID-19. The correlation matrix is presented in Table 4.
Table 3
Results of microcirculation assessment of patients with COVID-19
| Parameter | Patients with COVID-19 n = 18 |
| BP (PU), Me [LQ; UQ] | 3.01 [2.47; 5.04] |
| LTH1 (PU), M±SD | 14.65±4.47 |
| LTH2 (PU), M±SD | 23.29±6.77 |
| LTH3 (PU), M±SD | 25.36±6.5 |
| LTH4 (PU), M±SD | 25.36±5.97 |
| LTH5 (PU), M±SD | 25.87±7.04 |
| AUC60 (PU*s), M±SD | 671±253 |
| AUC120 (PU*s), M±SD | 1846±640 |
| AUC180 (PU*s), M±SD | 3144±1010 |
| AUC240 (PU*s), M±SD | 4442±1363 |
| AUC300 (PU*s), M±SD | 5772±1778 |
| Slope60 (PU/s), M±SD | 3.28±1.27 |
| Slope120 (PU/s), M±SD | 1.52±0.58 |
| Slope180 (PU/s), M±SD | 0.93±0.35 |
| Slope240 (PU/s), M±SD | 0.59±0.26 |
| Slope300 (PU/s), M±SD | 0.42±0.19 |
Table 4
Spearman rank correlation coefficients (with significance level) between clinical and demographic characteristics of patients and indices of skin microcirculation. “–” is marked for p > 0.05
| BP | LTH1 | LTH2 | LTH3 | LTH4 | LTH5 | AUC60 | AUC120 | AUC180 | AUC240 | AUC300 | Slope60 | Slope120 | Slope180 | Slope300 | |
| Age (years) | – | – | –0.570 p = 0.014 | –0.571 p = 0.013 | –0.547 p = 0.019 | –0.624 p = 0.006 | – | –0.555 p = 0.017 | –0.611 p = 0.007 | –0.564 p = 0.015 | –0.591 p = 0.01 | –0.503 p = 0.033 | –0.737 p < 0.001 | –0.556 p = 0.017 | – |
| SpO2 (%) | – | – | – | – | – | 0.512 p = 0.043 | – | – | – | – | – | – | – | – | – |
| C-RP (mg/l) | 0.501 p = 0.034 | – | – | – | – | – | – | – | – | – | – | – | – | – | – |
| aPTT (s) | – | – | 0.511 p = 0.03 | – | – | – | – | 0.491 p = 0.038 | 0.519 p = 0.027 | 0.474 p = 0.047 | – | – | 0.537 p = 0.022 | – | – |
| Fibrinogen (g/l) | – | – | – | – | – | – | 0.560 p = 0.016 | 0.503 p = 0.034 | 0.472 p = 0.048 | – | – | 0.42 p = 0.083 | – | – | – |
| D-dimer (μg/ml) | – | 0.504 p = 0.033 | – | – | – | – | 0.482 p = 0.043 | – | – | – | – | 0.517 p = 0.028 | – | – | – |
| Haemoglobin (g/l) | – | –0.670 p = 0.002 | – | – | – | – | –0.515 p = 0.029 | –0.493 p = 0.038 | – | – | – | –0.502 p = 0.034 | – | – | – |
| Red blood cells (106/μl) | – | –0.550 p = 0.018 | – | – | – | – | – | – | – | – | – | – | – | – | – |
| Haematocrit (%) | – | –0.542 p = 0.02 | – | – | – | – | – | – | – | – | – | – | – | – | – |
| Lymphocytes (109/L) | – | – | – | – | – | – | – | – | – | – | – | – | – | – | 0.485 p = 0.041 |
| Creatinine (μmol/l) | – | – | – | –0.517 p = 0.028 | – | – | – | – | – | – | – | – | – | –0.542 p = 0.02 | – |
| GFR (EPI) (ml/min/1.73 m2) | – | – | – | 0.494 p = 0.037 | – | – | – | – | – | – | – | – | 0.529 p = 0.024 | 0.600 p = 0.009 | – |
Table 4 lists only the parameters with which statistically significant correlations were found. No statistically significant correlations were found with BMI (kg/m2), body t° on the day of measurement (°C), SBP (mmHg), DBP (mmHg), HR (contractions per 1 min), respiratory rate (1/min), procalcitonin (ng/ml), prothrombin time (sec), mean erythrocyte volume (fl), hematocrit (%), platelet count (109/l), white blood cell count (109/l), lymphocyte count (109/l), bilirubin (μmol/l), glucose (μmol/l), ferritin (μg/l) levels.
Only one indicator, C-RP level, was found to correlate with baseline perfusion levels. The remaining correlations were found among the indices characterising the reactivity of the microcirculatory bed to heating.
The age of the patients correlated with the highest number of microcirculatory indices characterising microcirculatory reactivity. The strongest correlation was found with the Slope120 parameter (Rs = –0.737, p < 0.001) characterising the rate of perfusion gain during the first two minutes of heating (Fig. 2A). All correlations detected were negative —patients with COVID-19 showed a decrease in microcirculatory reactivity with increasing age.
Fig. 2
Correlations between skin microvascular reactivity indices and clinical and demographic characteristics of patients. A - Slope120 and age of patients, B - LTH1 and haemoglobin (g/l), C –AUC60 and Fibrinogen (g/l), D - Slope180 and GFR (ml/min/1.73m2).
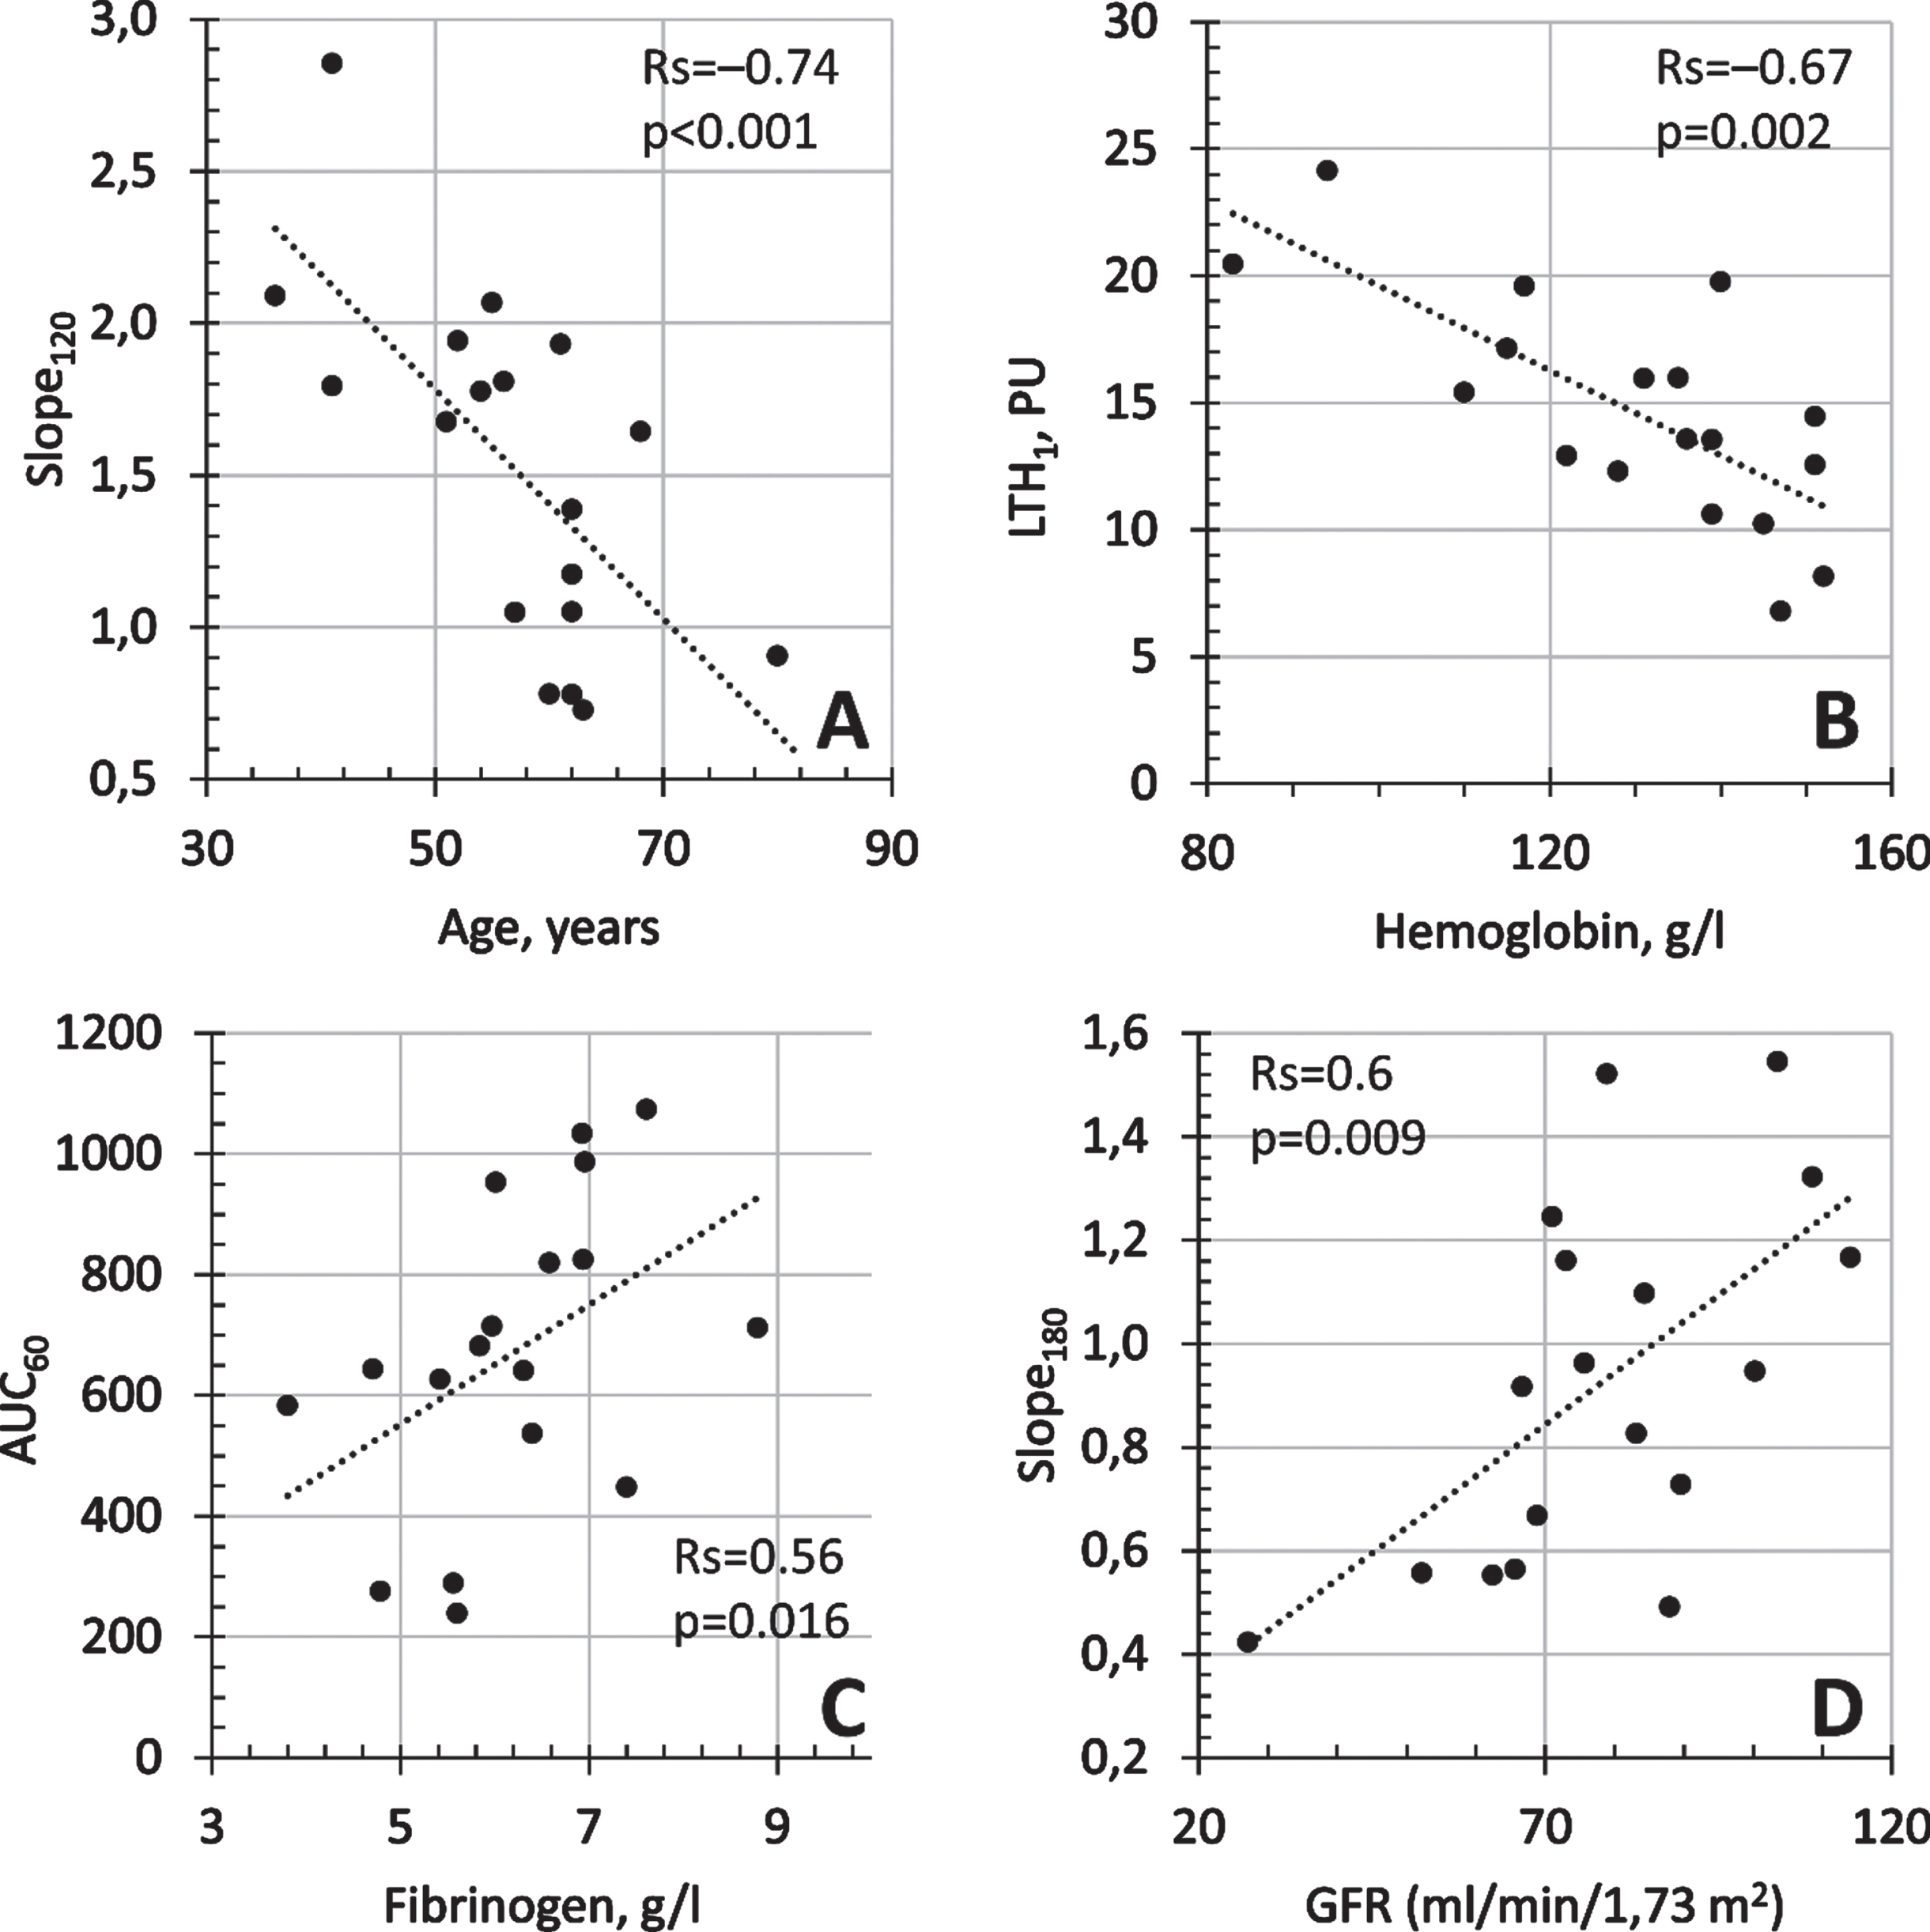
Among the laboratory parameters, the highest number of correlations was found for the aPTT index, which characterises the performance of the general cascade of the human coagulation system and is a sensitive indicator of blood coagulation. aPTT was moderately correlated with reactivity indices —an increase in aPTT was associated with an increase in reactivity indices. D-dimer and fibrinogen were also moderately correlated with measures such as LTH1, AUC60, Slope60.
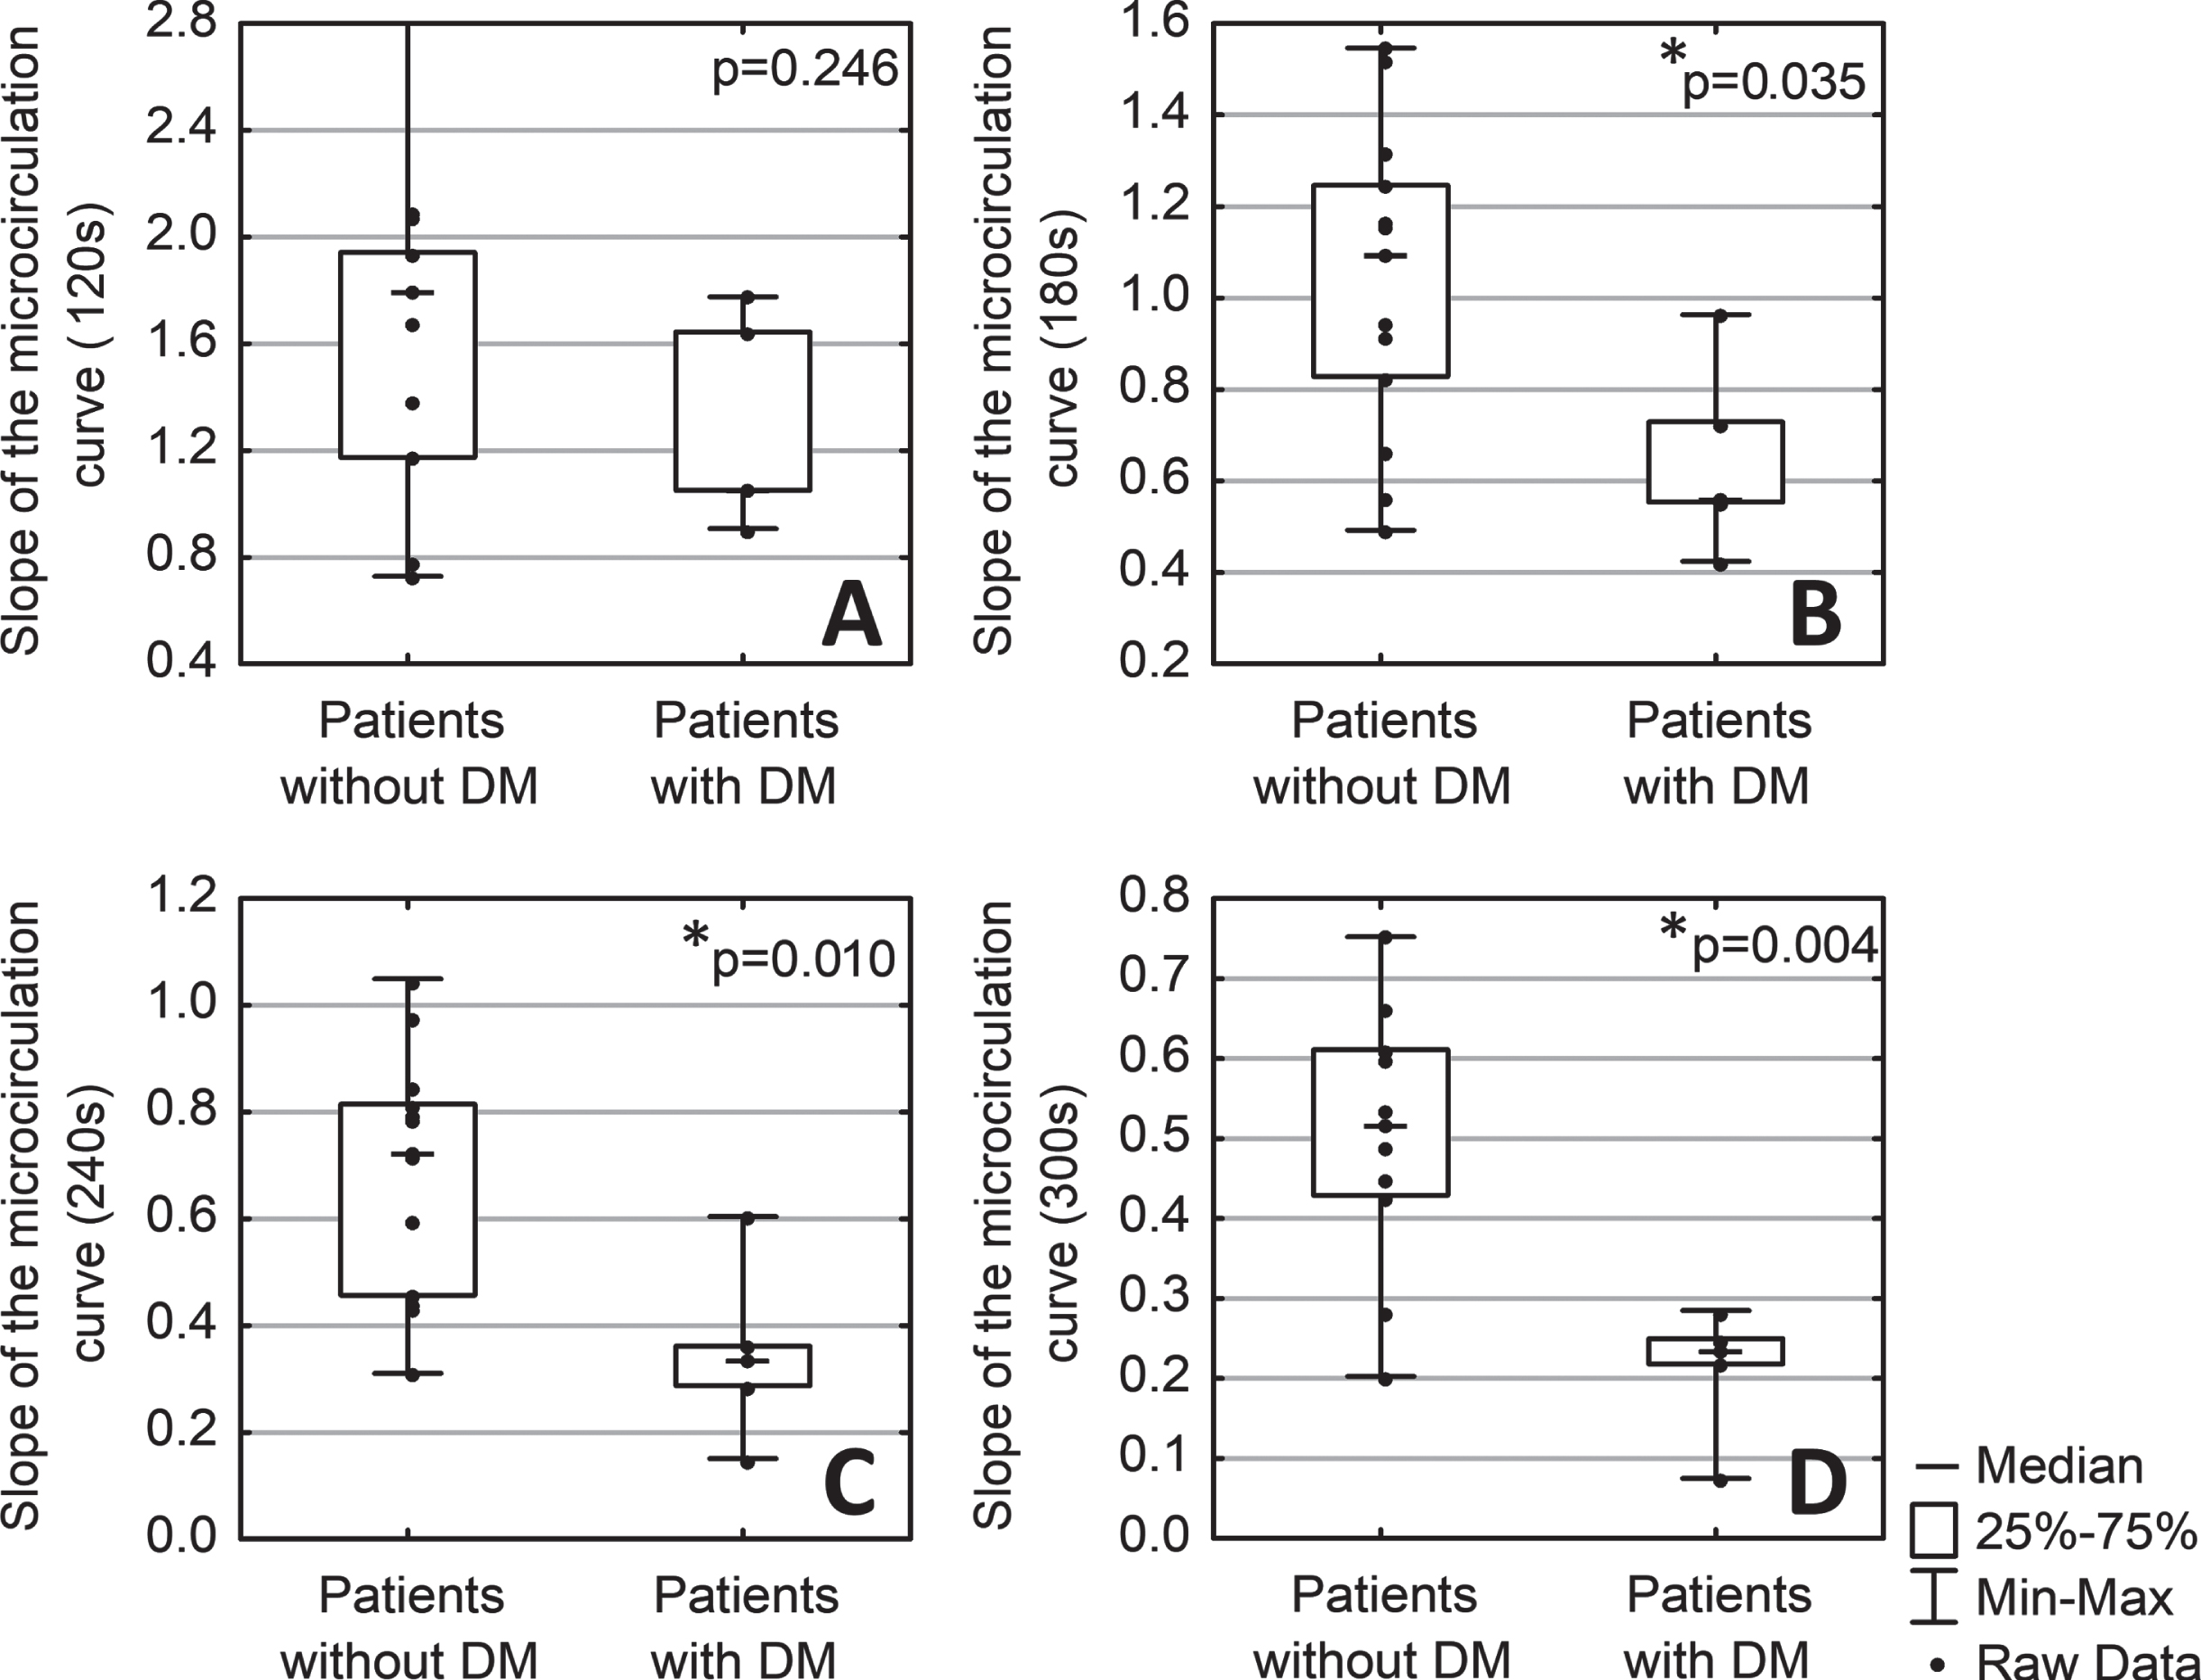
There was also a statistically significant effect of DM on the slope indices characterising the rate of hyperaemic response on the section of the microcirculatory curve. Slope180, Slope240, Slope300 were statistically significantly lower in patients with diabetes than in patients without diabetes (Fig. 3B, 3 C, 3D).
Fig. 3
Comparison of the slope of microcirculatory curve sections over 120 (A), 180 (B), 240 (C), and 300 (D) seconds of heating in patients with (n = 5) and without diabetes mellitus (DM) (n = 13). * - p < 0,05 (Mann-Whitney test).
No statistically significant connections of microcirculation indices with sex or presence of arterial hypertension were found.
4Discussion/Conclusion
The scientific literature has repeatedly suggested that assessment of skin microcirculation, in particular endothelial dysfunction, may be informative in patients with COVID-19 [16]. In this study, we conducted a non-invasive study of the parameters of skin microcirculation using a heat test in patients with the coronavirus infection COVID-19. During the heat test, local thermal hyperaemia developed due to neuroregulatory (axon-reflex) and endothelial mechanisms [17]. A decrease in the severity of this hyperaemia may indicate the presence of microcirculatory disorders [18]. It has also been shown that microcirculatory reactivity reduces in patients with moderate and severe COVID-19 [19]. The rheological properties of blood can also affect the intensity of the hyperaemic reaction [20].
The analysis of the data revealed several correlations between cutaneous microcirculation indices and clinical and laboratory examination parameters. For example, a strong correlation has been shown between age and microvascular reactivity. Age is a known risk factor for adverse outcomes in COVID-19 disease [4]. This finding leads to the hypothesis (to be confirmed by further research) that age-mediated reductions in microcirculatory reactivity in patients with COVID-19 may be one of the factors causing an increased risk of a poor prognosis of the disease.
Another known risk factor for a negative COVID-19 outcome is DM [21]. In the current study, it has been shown that diabetic patients show a decrease in microcirculation reactivity, which characterises the rate of perfusion gain. The LTH parameters reflect the average perfusion level for each of the 5 minutes of heating, while the AUC and Slope values rather demonstrate the cumulative effect of vasodilation. During the first minutes of heating, vasodilation is caused by neurogenic mechanism (axon reflex), followed by endothelial-induced vasodilation [22]. Reduced reactivity is not observed during the first minutes of hyperaemia, but at later periods where the contribution of endothelial mechanisms of vasodilation mediated by nitric oxide release is increased [22].
The number of correlations were found with laboratory parameters characterising the performance of the clotting system. aPTT, fibrinogen, D-dimer, and haemoglobin levels correlated with reactivity indices. It is known that microcirculation can be affected by the composition of the circulating blood [23]. Most of these correlations were manifested in the first minute of heating, and with the further development of vasodilation, their strength decreased. This may suggest that the influence of the rheological properties of blood on the development of a hyperaemic reaction is maximal at the initial stage of a hyperaemic reaction.
The level of baseline perfusion is moderately correlated with the level of C-reactive protein, which characterises the development of a systemic inflammatory response.
The conducted research has several limitations. Small sample size does not allow the identification of correlations of weak intensity —at a power level of 80%, a sample of 18 observations only allows the identification of correlations of moderate strength. Another limitation is the nature of the group of patients, as the study mainly included patients with a moderate course of disease. Examination of patients in serious condition was impossible due to technical limitations.
The study was conducted in the “red zone”, so the recruitment of the age-matched control group was also limited. According to the literature, some of the correlations we found in the group of patients with COVID-19 are also found in patients without the disease, such as age-related decrease in microcirculatory reactivity [24, 25]. The association between age and baseline perfusion, as reported by several studies [26, 27], may not have been found in our work because of the power of the study.
On the other hand, our study found unusual correlations of vascular reactivity parameters with fibrinogen and aPTT. According to the literature, high levels of fibrinogen may be associated with the development of endothelial dysfunction [28]. In our study, we observe a positive correlation with microvascular reactivity for both fibrinogen and aPTT. This correlation is detectable in the first minutes of hyperemia and is not detectable at 4–5 minutes, when the endothelial contribution increases. This may be because all patients received anticoagulant therapy to prevent the thrombosis that develops with COVID-19 [29, 30].
5Conclusion
Age, diabetes mellitus, obesity, and haemorheological disorders are known to be risk factors for poor outcomes in patients with COVID-19. In the present study, within a group of patients with moderate COVID-19 disease, most of these factors were shown to correlate with decreased reactivity of cutaneous microvasculature. We suggest that assessment of microcirculation reactivity in patients with COVID-19 may potentially be used as an additional, instrumental, non-invasive way of assessing the risk of developing a negative outcome for the disease, and its prevention.
Statement of ethics
All patients signed an informed consent to participate in the study. The study protocol corresponded to the principles outlined in the Declaration of Helsinki and was approved at the meeting of the Independent Ethics Committee of the Moscow Regional Clinical Research Institute (No. 4 of May 13, 2020).
Conflict of interest
The authors have no conflicts of interest to declare.
Author contributions
Glazkov A.A., Glazkova P.A., Kulikov D.A. took parts in the study design, manuscript writing, and data analysis. Ulbashev D.S., Borshchev G.G., Pulin A.A. performed the examination of patients, data collection and analysis, article editing and translation. All authors approved the final version of the manuscript.
References
[1] | Nicosia RF , Ligresti G , Caporarello N , Akilesh S , Ribatti D . COVID-19 Vasculopathy: Mounting Evidence for an Indirect Mechanism of Endothelial Injury. Am J Pathol. (2021) ;191: (8):1374–84. DOI: 10.1016/j.ajpath.2021.05.007. |
[2] | Shi Q , Zhang X , Jiang F , Zhang X , Hu N , Bimu C , et al . Clinical Characteristics and Risk Factors for Mortality of COVID-19 Patients With Diabetes in Wuhan, China: A Two-Center, Retrospective Study. Diabetes Care. (2020) ;43: (7):1382–91. DOI: 10.2337/dc20-0598. |
[3] | Al-Sabah S , Al-Haddad M , Al-Youha S , Jamal M , Almazeedi S . COVID- Impact of obesity and diabetes on disease severity. Clin Obes. (2020) ;10: (6):e12414. DOI: 10.1111/cob.12414. |
[4] | Li Y , Ashcroft T , Chung A , Dighero I , Dozier M , Horne M , et al. Risk factors for poor outcomes in hospitalised COVID-19 patients: A systematic review and meta-analysis. J Glob Health. (2021) ;11: :10001. DOI: 10.7189/jogh.11.10001. |
[5] | Tibirica E , De Lorenzo A . Importance of the evaluation of systemic microvascular flow and reactivity in critically ill patients with coronavirus disease —COVID-19. Microvasc Res. (2020) ;131: :104028. DOI: 10.1016/j.mvr.2020.104028. |
[6] | Varga Z , Flammer AJ , Steiger P , Haberecker M , Andermatt R , Zinkernagel AS , et al. Endothelial cell infection and endotheliitis in COVID-19. Lancet. (2020) ;395: (10234):1417–8. DOI: 10.1016/S0140-6736(20)30937-5. |
[7] | Jung F , Krüger-Genge A , Franke RP , Hufert F , Küpper J-H . COVID-19 and the endothelium. Clin Hemorheol Microcirc. (2020) ;75: (1):7–11. DOI: 10.3233/CH-209007. |
[8] | Jin Y , Ji W , Yang H , Chen S , Zhang W , Duan G . Endothelial activation and dysfunction in COVID- from basic mechanisms to potential therapeutic approaches. Signal Transduction and Targeted Therapy. (2020) ;5: (1):1–13. DOI: 10.1038/s41392-020-00454-7. |
[9] | Martini R . The compelling arguments for the need of microvascular investigation in COVID-19 critical patients. Clin Hemorheol Microcirc. (2020) ;75: (1):27–34. DOI: 10.3233/CH-200895. |
[10] | Gebicki J , Katarzynska J , Marcinek A . Can the microcirculatory response to hypoxia be a prognostic factor for Covid-19? Respir Physiol Neurobiol. 78. (1034) ;280: :103478. DOI: 10.1016/j.res2020.103478. |
[11] | Cracowski J-L , Roustit M . Current Methods to Assess Human Cutaneous Blood Flow: An Updated Focus on Laser-Based-Techniques. Microcirculation. (2016) ;23: (5):337–44. DOI: 10.1111/micc.12257. |
[12] | Ocampo-Garza SS , Villarreal-Alarcón MA , Villarreal-Treviño AV , Ocampo-Candiani J . Capillaroscopy: A Valuable Diagnostic Tool. Actas Dermosifiliogr. (2019) ;110: (5):347–52. DOI: 10.1016/j.ad.2018.10.018. |
[13] | Lapitan D , Rogatkin D . Optical incoherent technique for noninvasive assessment of blood flow in tissues: Theoretical model and experimental study. J Biophotonics. (2021) ;14: (5):e202000459. DOI: 10.1002/jbio.202000459. |
[14] | World Health Organization. COVID-19 Clinical management: living guidance [Internet]. WHO. 2021 [cited 2021 May 29].;1-81. |
[15] | Erdfelder E , FAul F , Buchner A , Lang AG . Statistical power analyses using G*Power 3. Tests for correlation and regression analyses. Behav Res Methods. (2009) ;41: (4):1149–60. DOI: 10.3758/BRM.41.4.1149. |
[16] | Evans PC , Ed Rainger G , Mason JC , Guzik TJ , Osto E , Stamataki Z , et al. Endothelial dysfunction in COVID- A position paper of the ESC Working Group for Atherosclerosis and Vascular Biology, and the ESC Council of Basic Cardiovascular Science. Cardiovasc Res. (2020) ;116: (14):2177–84. DOI: 10.1093/cvr/cvaa230. |
[17] | Roustit M , Cracowski JL . Non-invasive Assessment of Skin Microvascular Function in Humans: An Insight Into Methods. Microcirculation. (2012) ;19: (1):47–64. DOI: 10.1111/j.1549-8719.2011.00129.x. |
[18] | Kulikov D , Glazkov A , Dreval A , Kovaleva Y , Rogatkin D , Kulikov A , et al. Approaches to improve the predictive value of laser Doppler flowmetry in detection of microcirculation disorders in diabetes mellitus. Clin Hemorheol Microcirc. (2018) ;70: (2):173–9. DOI: 10.3233/CH-170294. |
[19] | Sabioni L , De Lorenzo A , Lamas C , Muccillo F , Castro-Faria-Neto HC , Estato V , et al. Systemic microvascular endothelial dysfunction and disease severity in COVID-19 patients: Evaluation by laser Doppler perfusion monitoring and cytokine/chemokine analysis. Microvasc Res. (2021) ;134: :104119.. DOI: 10.1016/J.MVR.2020.104119. |
[20] | Hamlin SK , Benedik PS . Basic Concepts of Hemorheology in Microvascular Hemodynamics. Crit Care Nurs Clin North Am. (2014) ;26: (3):337–44. DOI: 10.1016/J.CCELL.2014.04.005. |
[21] | Chen Y , Yang D , Cheng B , Chen J , Peng A , Yang C , et al. Clinical Characteristics and Outcomes of Patients With Diabetes and COVID-19 in Association With Glucose-Lowering Medication. Diabetes Care. (2020) ;43: (7):1399–407. DOI: 10.2337/dc20-0660. |
[22] | Minson CT . Thermal provocation to evaluate microvascular reactivity in human skin. J Appl Physiol. (2010) ;109: (4):1239–46. DOI: 10.1152/japplphysiol.00414.2010. |
[23] | Jung C , Kelm M . Evaluation of the microcirculation in critically ill patients. Clin Hemorheol Microcirc. (2015) ;61: :213–24. DOI: 10.3233/CH-151994. |
[24] | Muller-Delp JM Aging-induced adaptations of microvascular reactivity. Microcirculation. (2006) ;13: (4):301–14. DOI: 10.1080/10739680600619023. |
[25] | Bentov I , Reed MJ . The effect of aging on the cutaneous microvasculature. Microvascular Research. (2015) ;100: :25–31. DOI: 10.1016/j.mvr.2015.04.004. |
[26] | Jung F . From hemorheology to microcirculation and regenerative medicine: Fahraeus Lecture. Clin Hemorheol Microcirc. (2010) ;45: (2-4):79–99. DOI: 10.3233/CH-2010-1312. |
[27] | Forstmeier V , Sorg H , Kabbani M , Herold C , Altintas MA , Krämer R . Evaluation of Cutaneous Microcirculation at the Dorsum of the Hand within Different Age Groups - Implications for Wound Healing in Hand Surgery?. Handchir Mikrochir Plast Chir. (2015) ;47: (6):384–8. DOI: 10.1055/s-0035-1555868. |
[28] | Lominadze D , Dean WL , Tyagi SC , Roberts AM . Mechanisms of fibrinogen-induced microvascular dysfunction during cardiovascular disease. Acta Physiologica. (1201) ;98: (1):01–13. DOI: 10.1111/j.1748-1716.2009.02037.x. |
[29] | Ellison-Hughes GM , Ross MD . Vascular Manifestations of COVID-19 –Thromboembolism and Microvascular Dysfunction. Front. Cardiovasc. Med. (2020) ;7: :598400. DOI: 10.3389/fcvm.2020.598400,. |
[30] | Jung EM , Stroszczinski C , Jung F . Contrast enhanced ultrasonography (CEUS) to detect abdominal microcirculatory disorders in severe cases of COVID-19 infection: First experience. Clin Hemorheol Microcirc. (2020) ;74: (4), 353–61. |


