
Critical shear stress of red blood cells as a novel integrated biomarker for screening chronic kidney diseases in cases of type 2 diabetes
Abstract
BACKGROUND:
The glomerular filtration rate (GFR) and albumin-to-creatinine ratio (ACR) have been widely used to identify and manage diabetic kidney disease (DKD). However, classifications based on these two indices do not always concur in terms of DKD diagnosis; for example, cases of high ACR with normal GFR or normal ACR with low GFR may occur. A recent study suggested that critical shear stress (CSS), a hemorheological parameter to represent aggregating force of red blood cells (RBCs), is a potential screening index for DKD. In the present study, we investigated the diagnostic potential of CSS for DKD according to the KDIGO 2012 Guideline.
METHODS:
A total of 378 patients with type 2 diabetes who visited Yeungnam University Hospital between 2014 and 2017 were included. CSS was measured using a transient microfluidic hemorheometer, Rheoscan-D300® (Rheomeditech, Seoul, Republic of Korea) with whole blood. Patients who were DKD negative (green zone) were compared with patients who were DKD positive (red zone) as Model 1 and patients at risk for (orange zone) and red zones as Model 2, respectively.
RESULTS:
After exclusion criteria such as eGFR < 30 mL/min/1.73 m2, alcoholism, and macrovascular complications were applied, the sensitivity and specificity were 100% and 77.8% for Model 1 and 75.0% and 72.0% for Model 2, respectively. The diagnostic accuracy measures of the CSS for Model 1 were found to be highly accurate or have the potential to alter clinical decisions. Similarly, the diagnostic accuracy measures of CSS for Model 2 were found to provide useful information, despite them expanding to the orange and red zones.
CONCLUSION:
DKD was successfully identified using a novel integrated hemorheological index of CSS that satisfied both ACR and GFR criteria. Therefore, CSS may be useful for the additive diagnosis of DKD with GFR and uACR.
1Introduction
Chronic kidney disease (CKD) in diabetic patients is the most common diabetic complication worldwide and occurs in approximately 40 % of patients with diabetes [1]. Diabetic kidney disease (DKD) has become the most common cause of end-stage renal disease (ESRD) and renal replacement treatment (RRT) due to the increased incidence of diabetes [2]. Thus, early screening and appropriate management of modifiable risk factors are the best strategies to prevent ESRD. To date, urine albumin to creatinine ratio (uACR) and estimated glomerular filtration rate (eGFR), which are markers of renal damage and renal dysfunction, respectively [3, 4], remain the recommended screening tests for CKD in patients with diabetes.
These two tests are now widely accepted as standard, but some patients get discrepant results between tests. Thus, combining changes in eGFR and urine microalbuminuria is recommended when conducting screening tests for CKD with a high diagnostic capability [5]. However, a discrepancy between microalbuminuria and eGFR still exists, which results in a ‘gray zone’ that makes it difficult to diagnose CKD [6, 7].
The ‘gray zone’ problem was somewhat solved when the 2012 Kidney Disease: Improving Global Outcomes (KDIGO) Clinical Practice Guideline for the Evaluation and Management of CKD was compiled [8]. This guideline classifies CKD using both GFR dimensions, which has been widely used to manage and treat people with CKD [9]. A categorical meta-analysis confirmed that relative risks, including cardiovascular mortality, kidney failure, acute kidney injury, and progressive CKD, were highly increased with the two-dimensional classification of CKD [9]. Even after adopting the KDIGO guidelines for more than two decades, many practical difficulties in identifying CKD remain. This is mainly due to the asymptomatic nature in its early stages, and early detection frequently fails. Good primary care judgment is essential when decisions regarding referrals to obtain the opinion from a specialist in nephrology are made [10]. However, comprehensively analyzing renal function and injury at primary care clinics with full information on eGFR, uACR, and other abnormalities such as urine sedimentation, tubular disorders, and histological abnormalities would be difficult. Therefore, there is an urgent need for a simple and integrated biomarker that can be used to detect CKD.
Researchers have suggested that hemorheological changes are also involved in the development of diabetic complications [11, 12]. Chronic inflammation, oxidative stress, and advanced glycation end products are known to alter erythrocyte morphology and reduce deformability [13, 14] and aggregation characteristics [15]. These hemorheological parameters, however, were not so successful to be used as diagnostic indexes for screening diabetic complications [16]. We introduced critical shear stress (CSS) as a novel hemodynamic parameter representing the minimum force to break up aggregated red blood cells, which had been difficult to measure [17, 18]. Unlike the traditional parameters of the RBC aggregation parameter, CSS is hematocrit-independent and has dimensional units of shear stress. In our previous reports [19, 20], critical shear stress (CSS) was closely associated with DKD diagnosed using the either urinary albumin-creatinine ratio (uACR) or eGFR. However, little is known regarding the screening performance of CSS when diagnosing CKD in patients with diabetes with respect to the two-dimensional categories of the KDIGO guidelines. To address this, we investigated the diagnostic power of CSS and the optimal cut-off value of CSS for DKD diagnosis in patients with type 2 diabetes.
2Materials and methods
2.1Study population and exclusion criteria
This study enrolled patients with type 2 diabetes mellitus who visited Yeungnam University Hospital (Daegu, Korea) between 2014 and 2017. The present study was conducted with the approval of the Institutional Review Board of Yeungnam University Hospital, and informed consent was obtained from all patients. The data were collected at the first visit. To exclude factors that could confound kidney function markers without kidney damage, such as aging, liver disease, infection, or factors that may affect statistical variance during analysis, the first exclusion criteria were as follow: 1) over 85 years of age (n = 2); 2) acute inflammation or infection (white blood cell count≥20,000/μL or high-sensitivity C-reactive protein level≥10 mg/dL, n = 8); 3) anemia (hemoglobin [Hb]≤8 g/dL, n = 1); 4) impaired liver function (aspartate aminotransferase≥100 or alanine aminotransferase≥100, n = 16); 5) hypertriglyceridemia (triglyceride≥1000 mg/dL, n = 2); and 6) patients without blood urea nitrogen (BUN) or creatinine (n = 6) results. These exclusion criteria are widely used when CKD is studied. A total of 378 participants were selected through the primary exclusion criteria, as shown in Fig. 2(a).
Fig. 2
(a) Patient selection with exclusion criteria for optimal outcomes; (b)Comparison models used to assess the diagnostic accuracy of CSS for CKD; (a) Model I comparing the green and red zone, (b) Model II comparing the green and combination of orange and red zones.
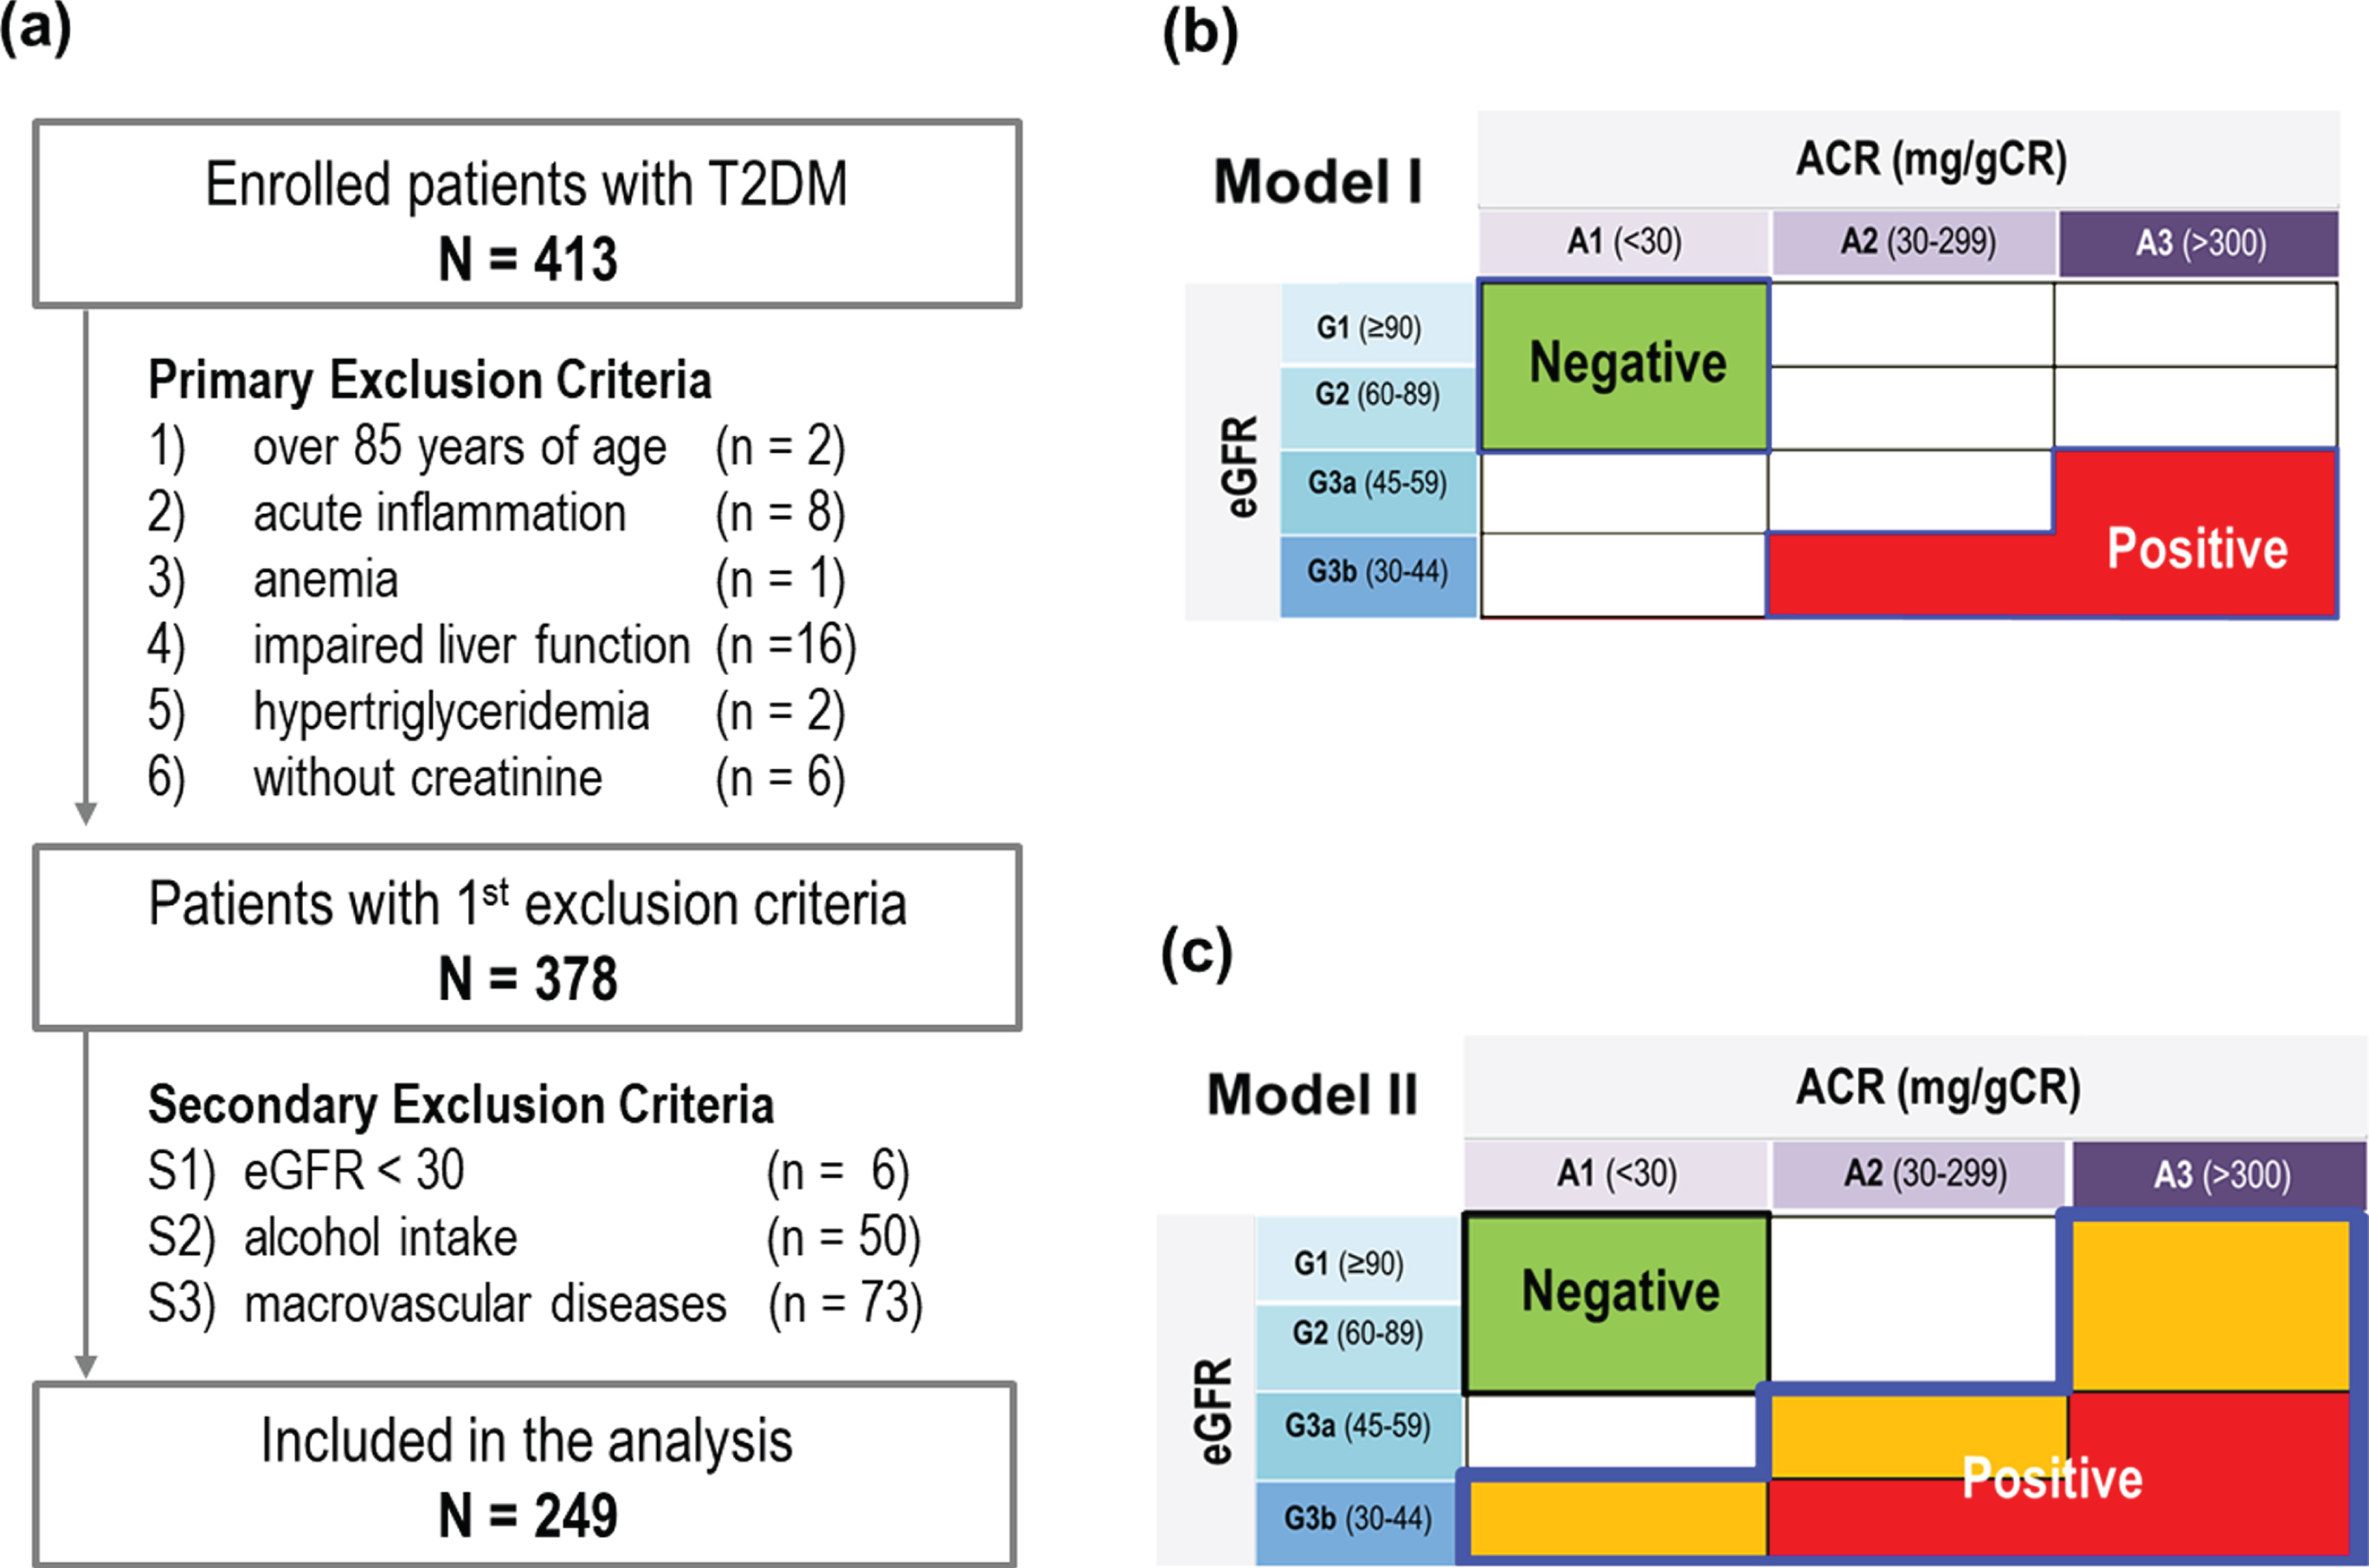
Fig. 1
Classification of CKD using (a) GFR and (b) albuminuria, (c) Classification of CKD using GFR and ACR categories: KDIGO guidelines with a categorical risk analysis (cited from Ref. [9]).
![Classification of CKD using (a) GFR and (b) albuminuria, (c) Classification of CKD using GFR and ACR categories: KDIGO guidelines with a categorical risk analysis (cited from Ref. [9]).](https://ip.ios.semcs.net:443/media/ch/2022/81-4/ch-81-4-ch211326/ch-81-ch211326-g001.jpg)
The results of our previous studies [16, 17] revealed that some factors significantly affected the hemorheological index; therefore, these factors should be carefully examined in the present study. For instances, CSS increased gradually as the GFR decreased to 30, but decreased again at GFR below 30 [16]. Also, CSS was correlated to some extent with macrovascular diseases such as coronary artery disease [21, 22]. In addition, alcohol intake within 24 hours has been routinely applied as an exclusion criterion for general blood tests. Considering the local culture of episodic heavy drinking, local blood tests strongly recommend abstaining from alcohol consumption for up to a week [23, 24]. Therefore, we established the secondary exclusion criteria as follow: S1) eGFR < 30 mL/min/1.73 m2 (n = 6), S2) alcohol intake within a week (n = 50), and S3) macrovascular diseases (n = 73). By applying the second exclusion criterion, the number of analyzed participants gradually decreased, as shown in Fig. 2(a). After adopting S1–S3, the number of patients in the green, yellow, orange, and red zones were 153 (61.4%), 62 (24.39%), 25 (10.0%), and 9 (3.6%), respectively.
2.2Diabetic complication
All participants were examined for microvascular complications. Diabetic retinopathy was identified using fundus photography. To diagnose DKD, the participants were tested for the presence of albuminuria and reduction in GFR. Albuminuria was assessed using uACR≥30 mg/g as a reference, and the reduction in GFR was calculated using the MDRD (Modification of Diet in Renal Disease) formula. Diabetic polyneuropathy was diagnosed using a 10 g monofilament test or Michigan Neuropathy Scoring statement questionnaire. We investigated the CAD and CVA histories of the participants to evaluate macrovascular compliance.
2.3CSS measurement
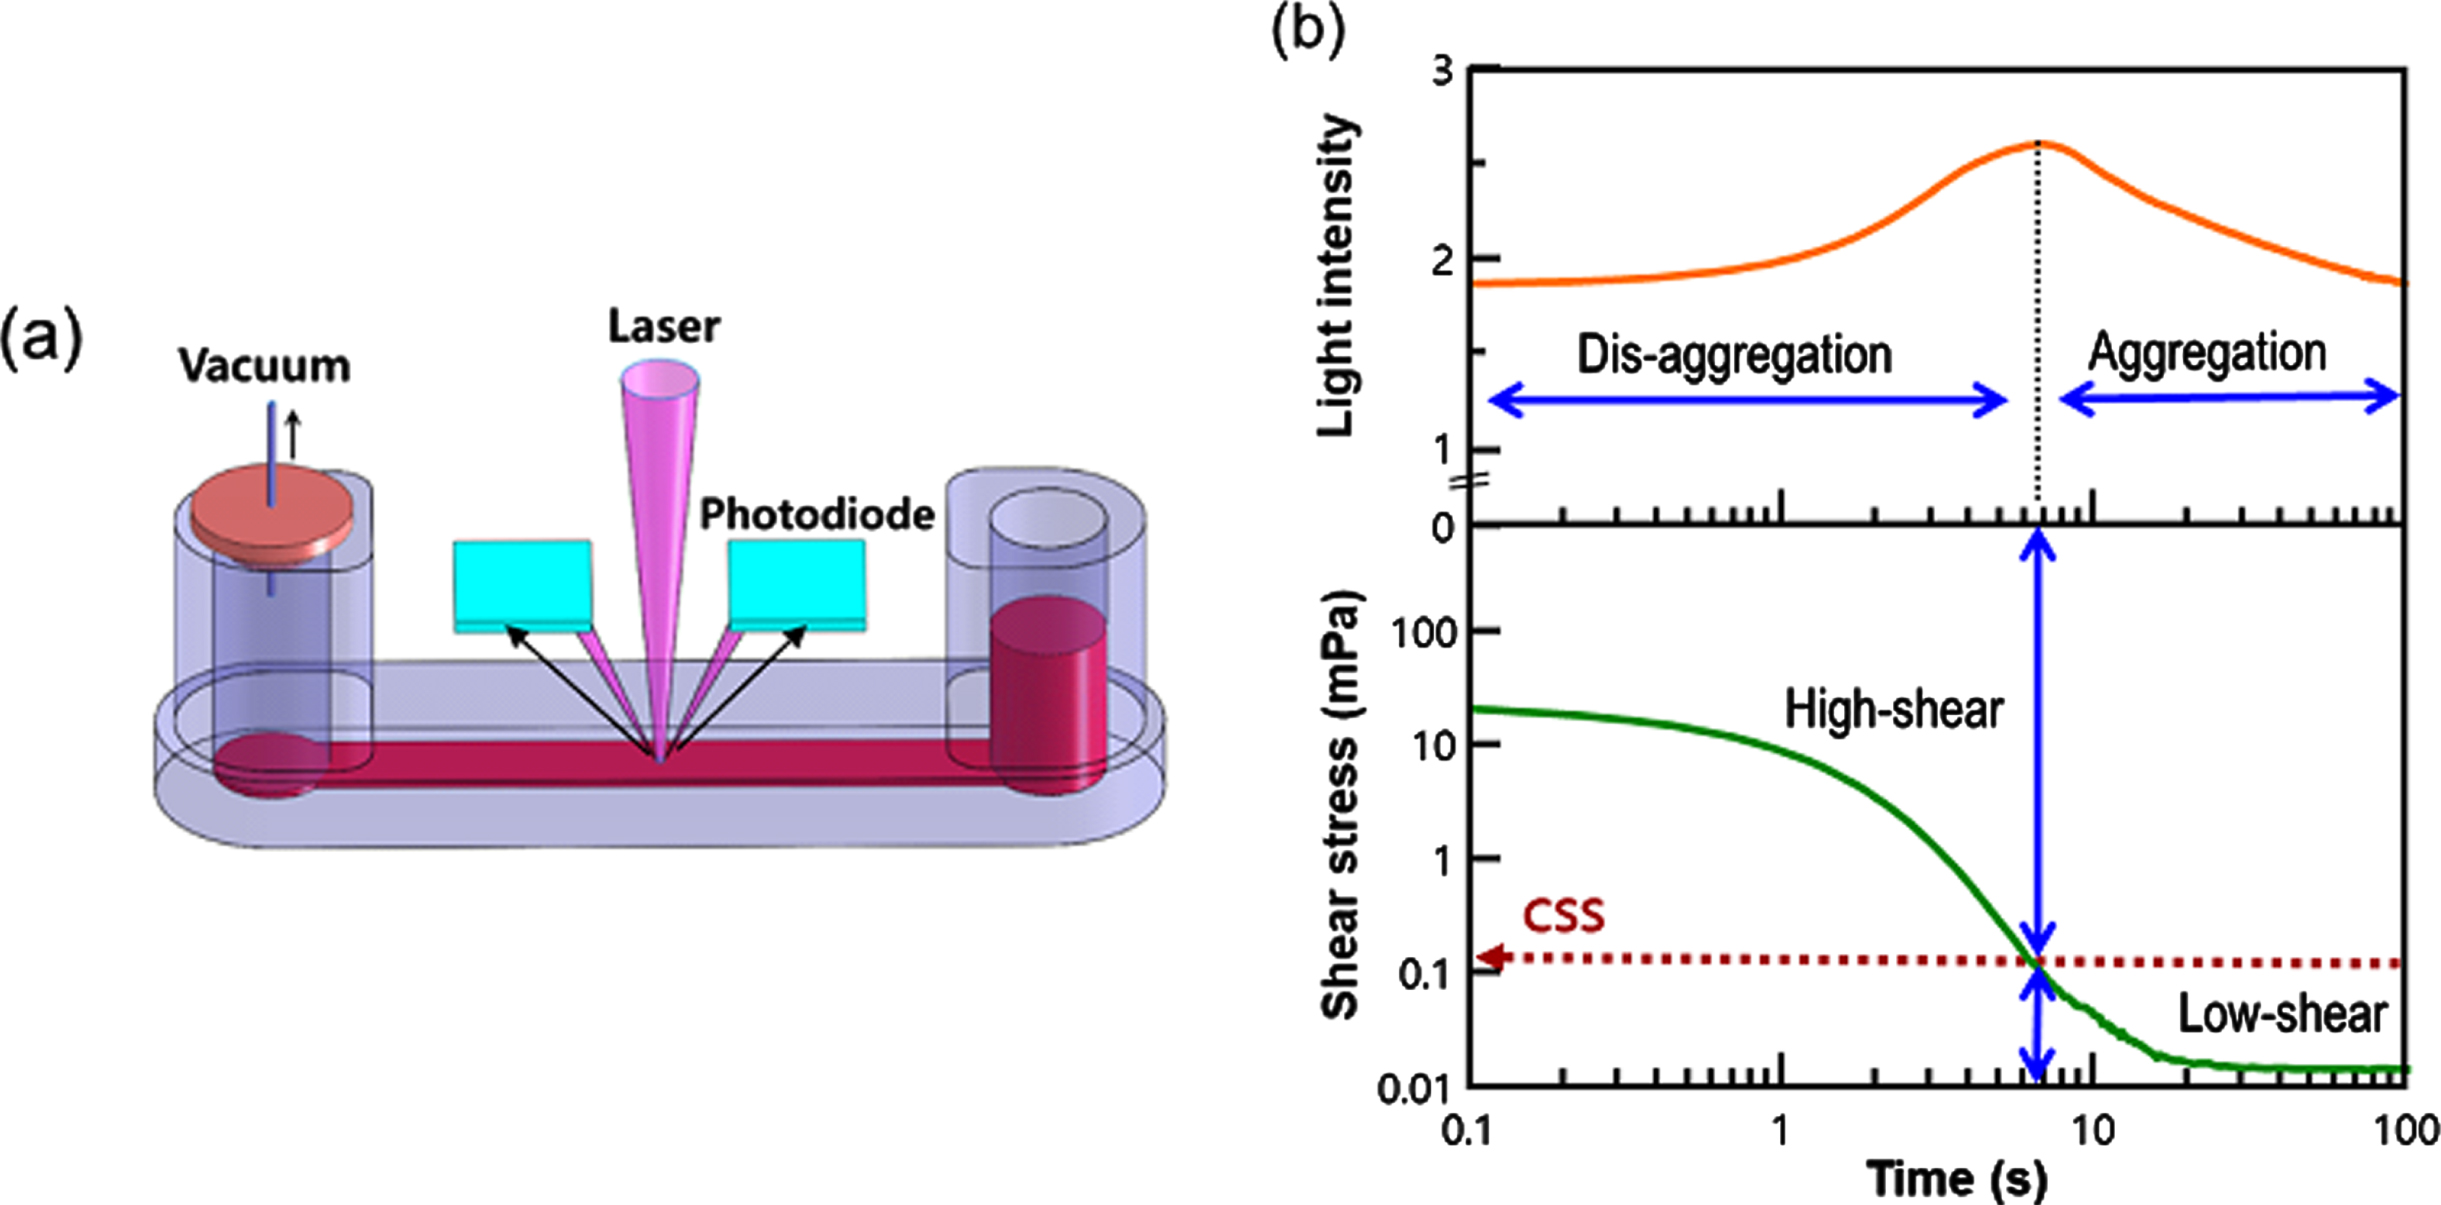
CSS was measured in whole blood without adjusting the hematocrit using a transient microfluidic hemorheometer (RheoScan-D300, Rheomeditech Inc., Seoul, Korea), as shown in Fig. 3. The blood sample (500μL) was placed in a reservoir chamber and exposed to a pressure differential that decreased continuously. When the pressure differential was gradually decreasing, the RBC aggregates were initially dispersed by high shear forces, and the corresponding backscattered light (BSL) intensity was increased. However, when the differential pressure was further decreased, the shear stress applied to the red blood cells also decreased, causing the red blood cells to re-aggregate and the BSL strength decreased. BSL intensity and pressure data were measured every 0.1 seconds and a test was completed within 20 seconds. The time and shear stress corresponding to maximal BSL were deemed the critical time and CSS. Further detailed information can be found in our previous reports [17, 18].
Fig. 3
Measurement of CSS in a microfluidic rheometry (a) Disposable microfluidic cartridge holding 500 uL of whole blood, (b) Simultaneous measurements of shear stress and backscattering intensity with respect to time.
2.4Assessment of diagnostic accuracy
In the present study, we used receiver operating characteristic (ROC) analysis and calculated the area under the curve (AUC) to evaluate the diagnostic power of CSS. We selected the optimal cut-off points using the Yuden index method or approach known as the point closest to the (0,1) corner of the ROC plane (Dist01) [26]. The former defines the optimal cut-off point as the point maximizing the Youden function (sensitivity + specificity –1), and the latter defines the optimal cut-off point as the point that minimizes the Euclidean distance between the ROC curve and the point in question. The following measures were used to evaluate diagnostic accuracy at CSS values corresponding to the optimal cut-off point [27, 28]: 1) sensitivity+specificity; 2) positive likelihood ratio (LR+) = sensitivity / (1-specificity); 3) negative likelihood ratio (LR–) = (1–sensitivity) / specificity; 4) diagnostic odds ratio (DOR) = LR+/LR–.
2.5Comparison models
In this study, we developed two comparison models (Models I and II) to determine the diagnostic accuracy of CSS for CKD, as shown in Fig. 2. Model I compares patients who are DKD negative (green zone) and positive (red zone). The green zone was defined as eGFR≥60 mL/min/1.73 m2 and uACR < 30 mg/g in all models, whereas the red zone was defined as GFR < 45 and ACR≥30 or GFR < 60 and ACR≥300 in the Model 1. In Model 2, the green zone was compared with the expanded DKD positive group, which included the orange and red zones.
3Results
The baseline characteristics of the patients are presented in Table 1. The mean age was 58.46±11.57 years, and the mean duration of diabetes was 9.13 years. The average HbA1c was 8.3±2.1%, and the eGFR was 78.4±21.7 mL/min/1.73 m2. The mean CSS was 315 mPa, and EI@3 Pa was 30.7%. In addition, the percentage of registered participants classified using the eGFR and μACR categories was analyzed.
Table 1
Baseline characteristics of the participants
| Variable | Mean±SD |
| Sex (n = M (%)) | 259 (60.1 %) |
| Age (years) | 58.5±11.6 |
| BMI (kg/m2) | 24.9±7.0 |
| DM duration (years) | 9.1±7.8 |
| Hypertension (%) | 58.7 |
| Systolic Blood Pressure (mmHg) | 131.7±16.3 |
| Diastolic Blood Pressure (mmHg) | 77.8±11.0 |
| Hemoglobin A1c (%) | 8.3±2.1 |
| Fasting blood glucose (mg/dL) | 168.4±55.3 |
| Fasting blood insulin (μU/mL) | 12.2±16.3 |
| Fasting blood C-peptide (ng/mL) | 3.2±2.6 |
| HOMA-IR | 4.6±3.6 |
| HOMA-B | 48.2±39.2 |
| Hemoglobin (g/dL) | 14.0±1.8 |
| Total protein (g/dL) | 9.0±34.8 |
| Albumin (g/dL) | 4.5±0.6 |
| AST (IU/L) | 29.7±21.9 |
| ALT (IU/L) | 33.4±45.9 |
| GGT ((IU/L) | 47.4±85.0 |
| Total cholesterol (mg/dL) | 179. 8±47.0 |
| Triglyceride (mg/dL) | 174.4±116.9 |
| High density lipoprotein (mg/dL) | 50.3±14.7 |
| Low density lipoprotein (mg/dL) | 94.9±40.8 |
| hsCRP (mg/dL) | 2.8±40.2 |
| BUN (mg/dL) | 16.7±6.6 |
| Creatinine (mg/dL) | 1.1±0.3 |
| eGFR (mL/min/1.73 m2) | 78.4±21.7 |
| Urine albumin creatinine ratio | 178.4±659.4 |
| CSS (mPa) | 315.0±167.5 |
| EI@3Pa (%) | 30.7±1.9 |
*mean ± standard deviation
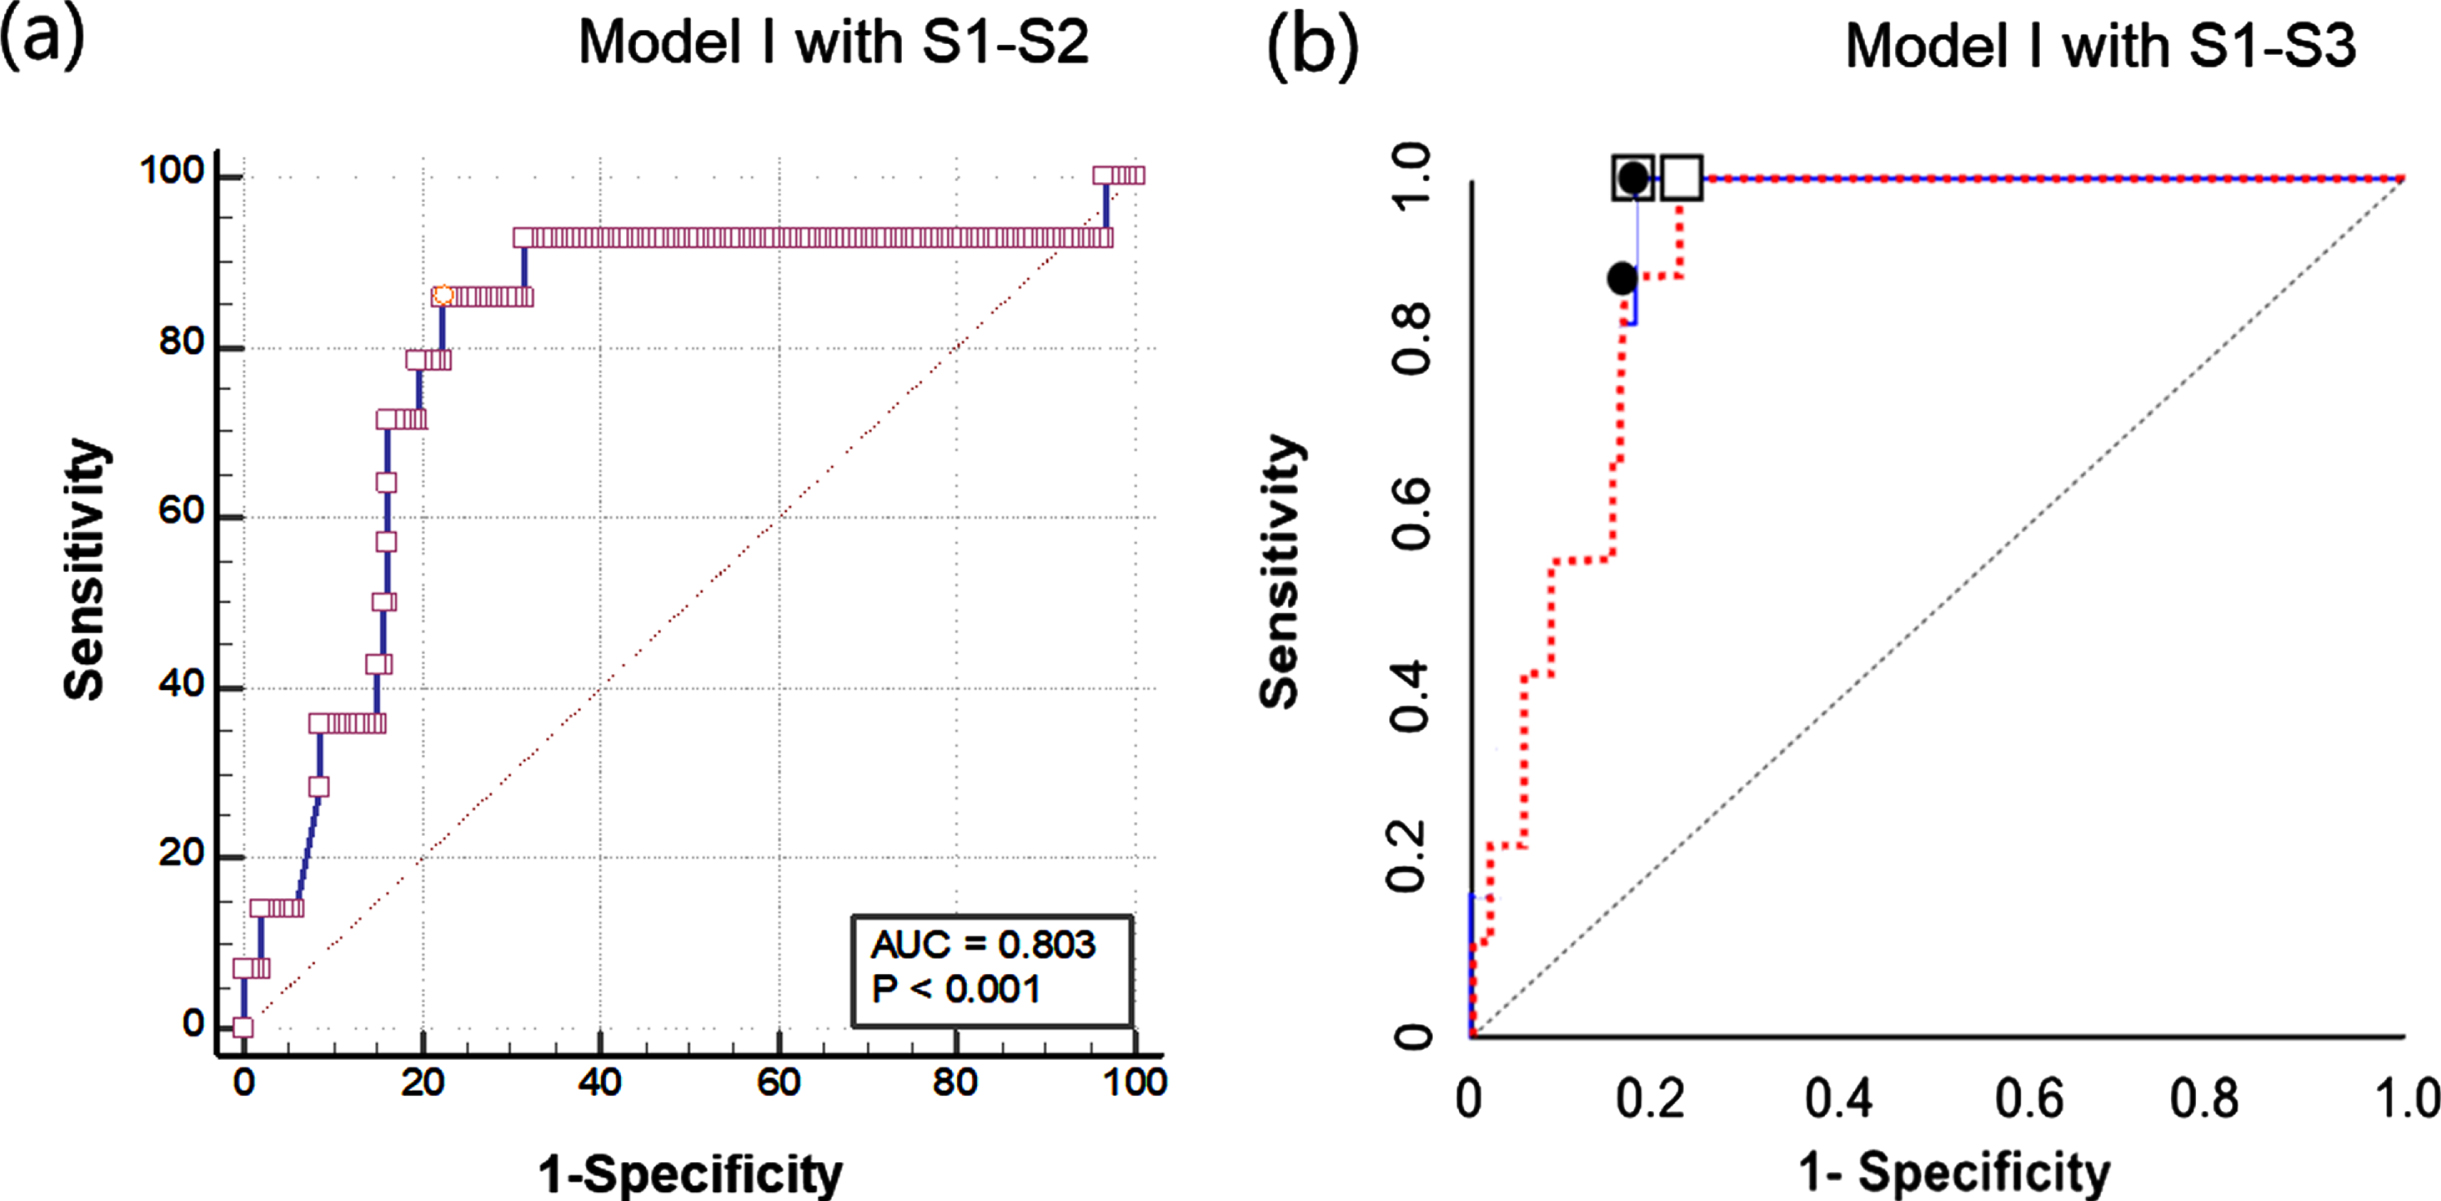
Table 2 describes the statistical results of the diagnostic performance of CSS for identifying CKD in the comparison Model I (green zone vs red zone). With adopting the exclusion criterion of eGFR < 30 mL/min/1.73 m2 (S1), the sensitivity and specificity were 80.0% and 68.0%, respectively. With adopting the exclusion criteria of eGFR < 30 mL/min/1.73 m2 (S1) and alcohol-intake (S2), the sensitivity (85.7%) and specificity (75.5%) were slightly improved, respectively. Additional application of exclusion criteria for macrovascular disease significantly improved sensitivity and specificity to 80.0% and 68.0%, respectively. It is noteworthy that the stepwise adoption of this exclusion criterion did not significantly change the cutoff value of the critical shear stress (330 mPa to 364 mPa). As a result, application of these exclusion criteria (S1–S3) improved sensitivity by 20% and specificity by 12.1%. Figure 4 shows the ROC curves for the Model I with two different exclusion criteria. Adoption of S1 and S2 yielded AUC of 79.3%, whereas adoption of S1–S3 did 90.1%. Of course, higher AUC and consequently improved sensitivity and specificity values were obtained when all exclusion conditions were applied.
Table 2
Statistical results of Model I with stepwise application of the secondary exclusion criteria
| Exclusion criteria | Analyzed patients | No. of DKD (Prevalence) | AUC | cut-off (mPa) | Sensitivity | Specificity |
| S1) eGFR < 30 | 234 | 17 (7.2%) | 67.8% | 341 | 70.6% | 76.5% |
| S1) eGFR < 30 & | 204 | 13 (6.3%) | 77.2% | 363 | 84.6% | 81.2% |
| S2) Alcohol-intake | ||||||
| S1) eGFR < 30 & | ||||||
| S2) Alcohol intake & | 162 | 9 (5.6%) | 90.3% | 363 | 100% | 81% |
| S3) Macrovascular Dx |
Fig. 4
Comparison of receiver operating characteristic (ROC) curves for Model I: (a) Model I with adopting S1-S2 and (b) Model I with adopting S1–S3.
Similarly, Table 3 describes the statistical results of the diagnostic performance of CSS for identifying CKD in the comparison Model II (green zone vs red & orange zones). When an exclusion criterion of eGFR < 30 mL/min/1.73 m2 (S1) was applied, the sensitivity and specificity were 64.7% and 76.3%, respectively. Neither sensitivity (68.3%) nor specificity (74.5%) improved when the additional alcohol intake exclusion criterion was combined with the first exclusion criterion of eGFR < 30 mL/min/1.73 m2. Additional application of exclusion criteria for macrovascular disease significantly improved sensitivity (75.5%) but not specificity (75.0%). Overall, as a result of applying these exclusion criteria (S1–S3), the sensitivity was slightly improved by 10.8% and the specificity was the same level.
Table 3
Statistical results of Model II with stepwise application of the secondary exclusion criteria
| Exclusion criteria | Analyzed patients | No. of DKD (Prevalence) | AUC | cut-off | Sensitivity | Specificity |
| S1) eGFR < 30 | 270 | 51 (18.9%) | 71.9% | 356 | 64.7% | 76.3% |
| S1) eGFR < 30 & | 233 | 41 (17.6%) | 72.2% | 356 | 68.3% | 74.5% |
| S2) Alcohol-intake | ||||||
| S1) eGFR < 30 & | ||||||
| S2) Alcohol intake & | 145 | 20 (13.8%) | 75.5 | 356 | 75.5% | 75.0% |
| S3) Macrovascular Dx |
4Discussion
In the present study, we found that CSS is significantly correlated with the presence of CKD in patients with type 2 diabetes who did not take alcohol within a week. The sensitivity and specificity of CSS increased more in patients with type 2 diabetes mellitus without a history of macrovascular complications (100% and 75.3% in Model I). The area under the receiver operating characteristic (AUROC) of CSS was 90.1%, which indicates good diagnostic accuracy. Based on these findings, we suggest that the optimal cutoff value of CSS should be 363 mPa when DKD criteria are met. To the best of our knowledge, this is the first study to suggest a CSS cut-off value for the diagnosis of DKD.
In fact, these diagnostic accuracy results are sufficient for the application of CSS as a screening assay for CKD in diabetic patients. Our previous research [16] yielded sensitivity and specificity values of 60.2% and 60.3%, respectively, with an AUC of 0.635. Since these excellent results were obtained by adopting the exclusion criteria, it is worth examining the key exclusion criteria closely. As shown in Fig. 2(a), the patient selection was consisted of two- processes with exclusion criteria. In the primary exclusion process, 8.5% (35 of 413 enrolled patients) were excluded from and 31.2% were excluded from the secondary exclusion process. In the secondary exclusion, patients who yielded GFR < 30 mL/min/1.73 m2, (S1, n = 6), patients who took alcohol within a week (S2, n = 50) and macrovascular diseases (S3, n = 73) were excluded, respectively.
In general, CSS gradually increased as eGFR decreased. However, when the eGFR is lower than 30 mL/min/1.73 m2, the CSS tends to increase once more [16]. Furthermore, most patients with GFR < 30 mL/min/1.73 m2 are classified as stage IV CKD and present with pronounced symptoms and therefore no screening is required. Thus, the S1 exclusion criterion was adopted. Second, general blood tests used to exclude samples that have consumed alcohol within 24 hours. In fact, even mild level of alcohol intake affected RBC size and morphology due to osmotic pressure alteration [25]. However, either excessive intakes of alcohol in a short period of time or chronic alcohol intake would result in significant hemorheological alterations [23, 24]. Considering the local culture of episodic heavy drinking, local blood tests strongly recommend abstaining from alcohol consumption for up to a week. Therefore, we adopted the alcogol-intake (S2) as one of the exclusion criteria. Meanwhile, CSS was interpreted as a force required to disperse RBC aggregates. Elevated CSS was closely related with macrovascular diseases such as coronary artery disease [21, 22]. Thus, S3 was carefully selected after comprehensive and systematic analysis of clinical data to establish exclusion criteria.
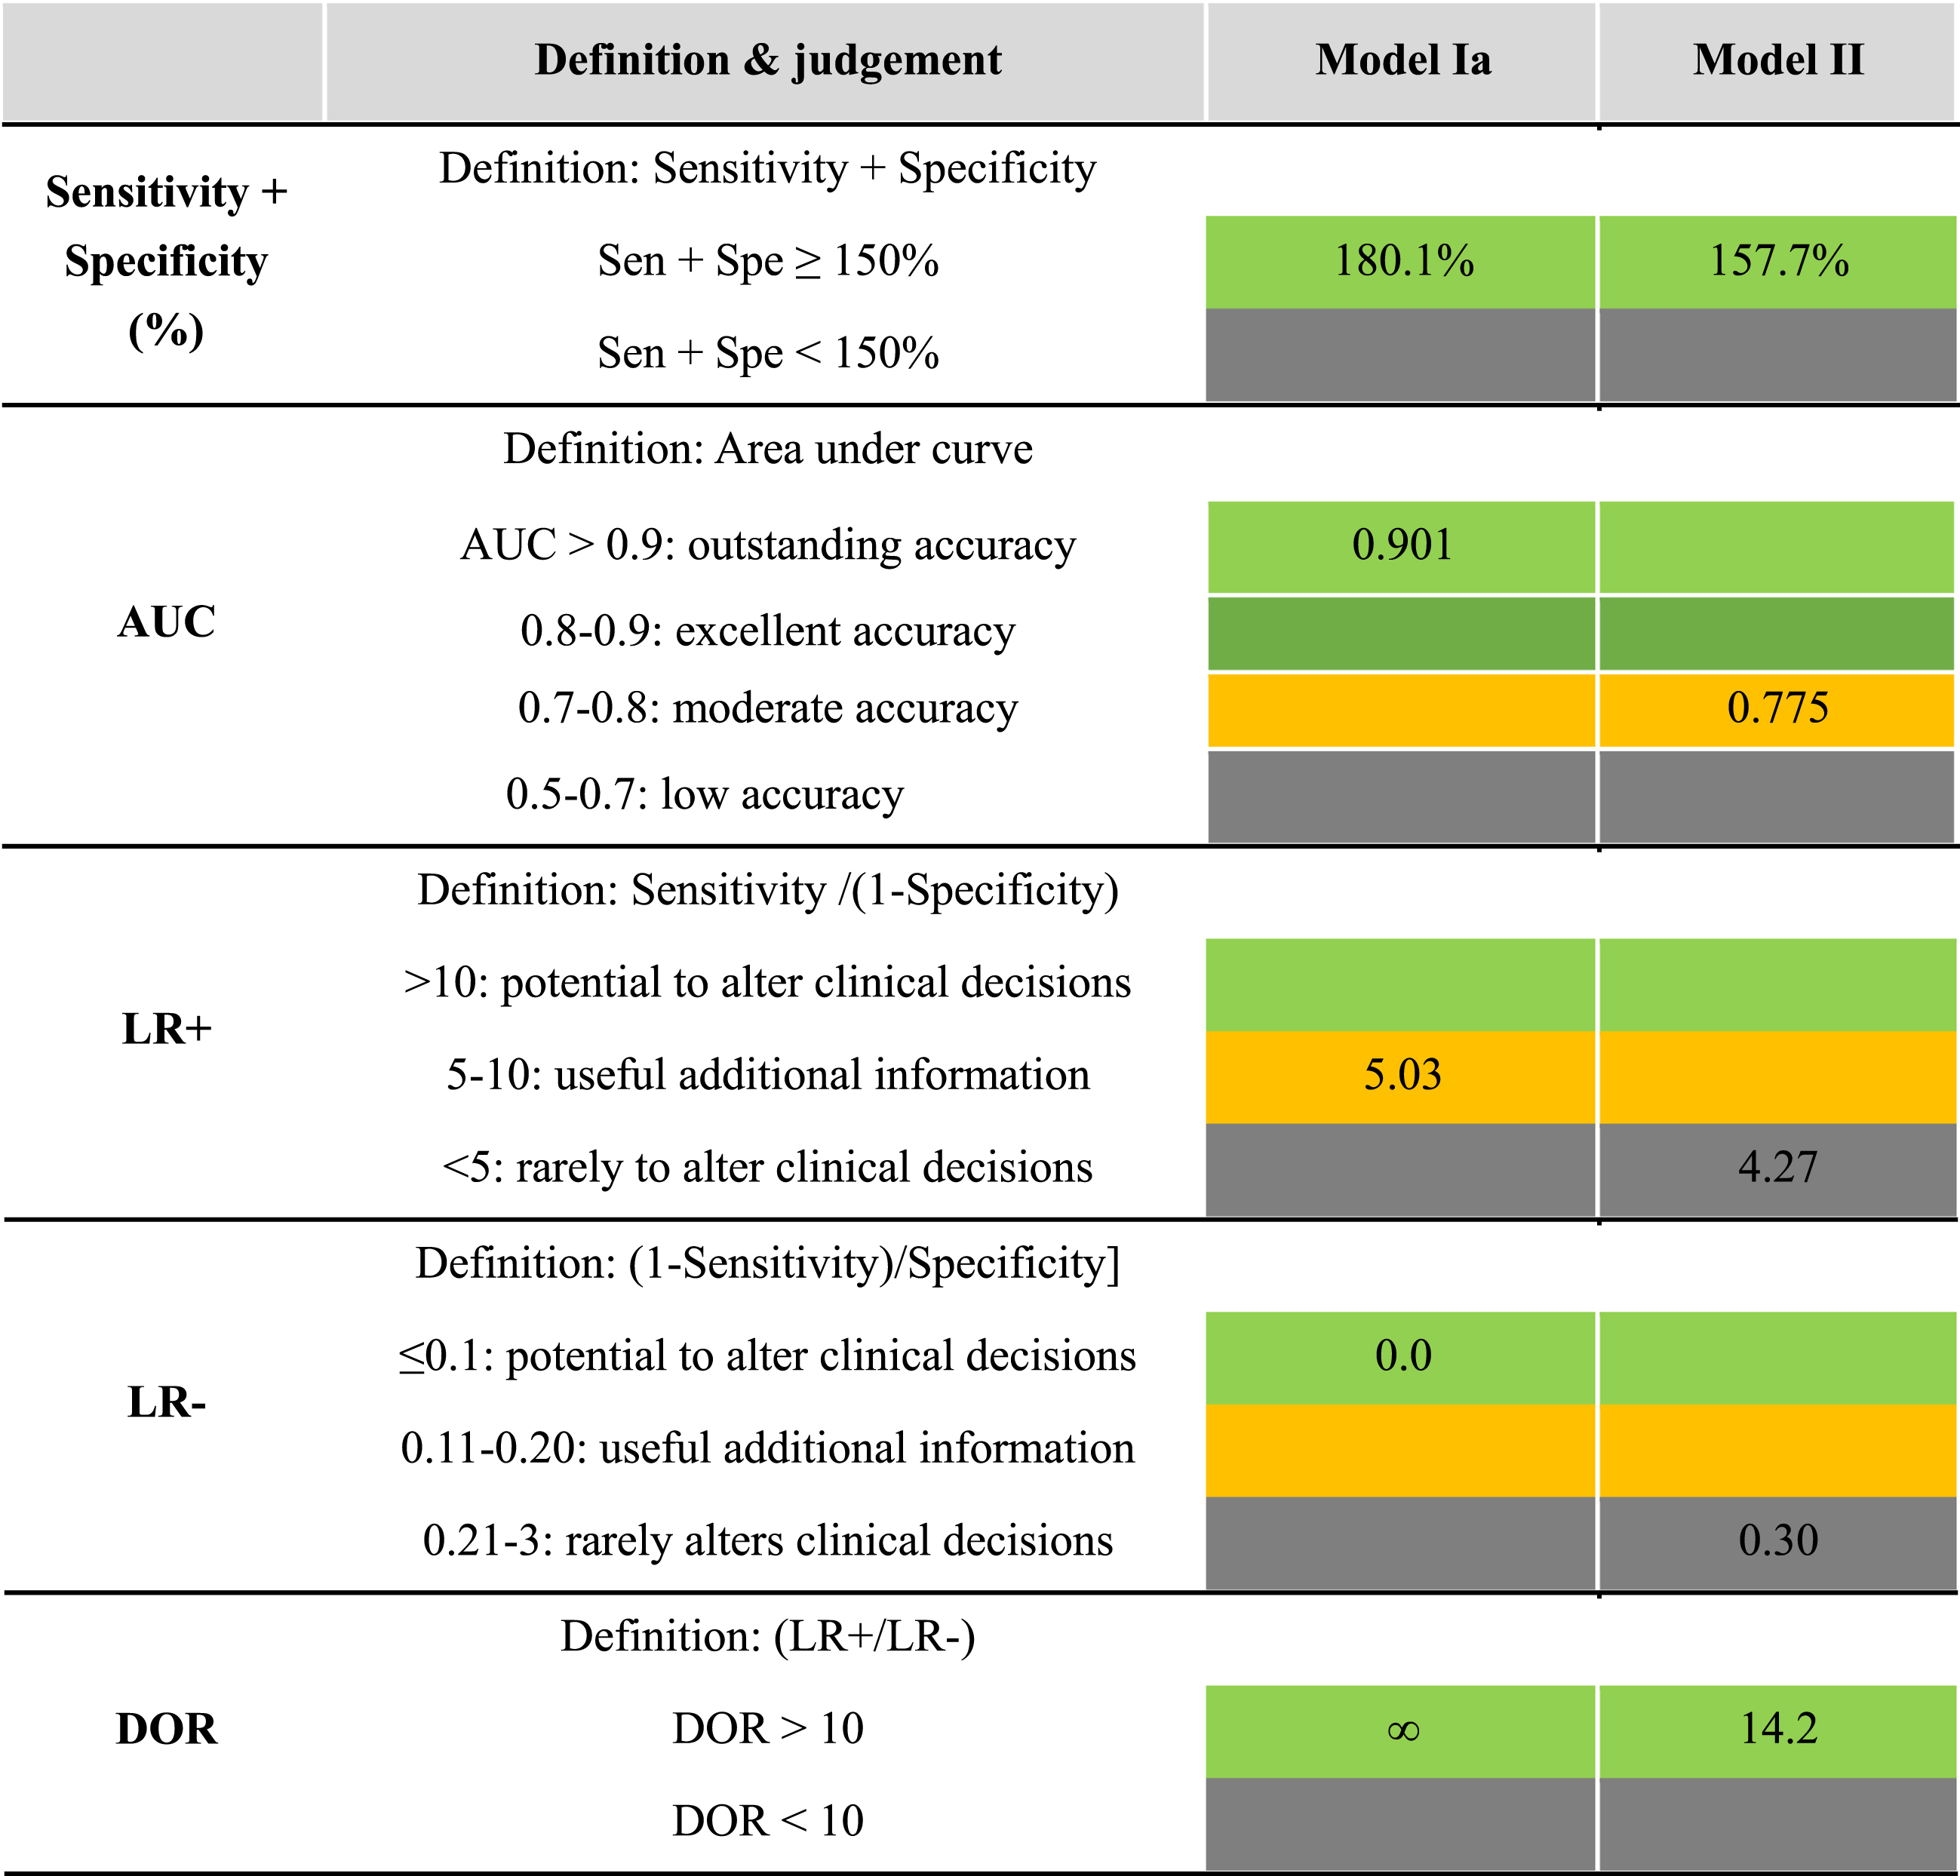
To evaluate the diagnostic accuracy of CSS for DKD, one must examine the classifications of each diagnostic index. The diagnostic indices were graded according to the evaluation guidelines as listed in Table 3. Since sensitivity and specificity are inversely proportional to one other in the ROC curve analysis, the sum of these two values should be higher than 150%. Of course, depending on the purpose of the diagnostic index, high sensitivity and moderate specificity values may coexist, and vice versa. LR+ is the probability ratio of true positive to false positive, whereas LR–is the ratio of false positive to true negative. Therefore, the higher the LR+ and the lower the LR–, the more accurate the diagnosis. Finally, diagnostic odd ratio (DOR) is defined as the ratio of LR+ to LR–and ranges from zero to infinity. The cutoff value of the DOR is generally 10. Given these evaluation guidelines, the current diagnostic accuracy of CSS for DKD is quite high. Both Models Ia and Ib exhibit excellent grading (green color), except for LR+. Model IIb also yielded moderate accuracy in terms of the sum of sensitivity and specificity, AUC, and DOR.
In the present analysis, we introduced four different comparison models (Model I and Model II) in Table 4. The main difference between Model I and II is the inclusion of the orange zones as DKD-positive. In Model I, the DKD positives were strictly defined with the red zones, which are classified as high risk or CKD stage 3, as shown in Fig. 1(c). In Model I, all indexes to examine diagnostic accuracy of CSS for DKD exhibited excellent values, which were categorized as outstanding accuracy and had the potential to alter clinical decision. For instance, the AUC was 0.917, LR- was 0.0, and DOR was ∞ for Model I, all of which are in the highest rank of diagnostic accuracy grading. These results indicate that CSS can distinctively identify DKD-positive (red zone) patients at local clinics. When the orange zone is included in the DKD positive group along with the red zone (Model II), the diagnostic accuracy indexes of CSS, tend to decrease somewhat but can still be useful for screening purposes, as listed in Table 4.
Table 4
Various indexes representing diagnostic performance
 |
There has been a vast clinical unmet need to detect diabetic kidney disease in primary care settings without analyzing a full panel of GFR, ACR, and additional renal biomarkers. CSS, which can be quickly and easily measured at the point of care, is a potential solution to these unmet needs. A commercial system (RheoScan) can measure CSS from sample to answer in less than a minute with EDTA treated whole blood sample. Although CSS measurement uses advanced techniques of optics and microrheology, the low-cost test kit technology could be used even for diabetic patients in developing countries, in which the number of diabetic patients is increasing significantly.
4.1Limitation of the study
Due to the limit of a retrospective study, there were extensive exclusion of patients who did not meet the selection guidelines for this study. It is also worth noting that not all patients diagnosed with DKD develop renal dysfunction due to their diabetes mellitus [29]; i.e., patients who present with CKD and diabetes mellitus (type 1 or type 2) can have true DKD, nondiabetic kidney disease (NDKD) concurrent with diabetes mellitus, or a combination of both DKD and NDKD. However, distinguishing cases of true DKD from other patients with limited clinical information without kidney biopsy is difficult. Thus, the results of the present study are insufficient to determine whether the CKD in the diabetic patient group is true DKD or NDKD concurrent with diabetes mellitus.
Conflict of interest
S. Shin has a patent for RheoScan system and owns stock in Rheomditech Inc. The remaining authors have no conflicts of interest to declare.
Acknowledgments
This research was supported by the Seoul R&D Project (no. HI14C0670).
References
[1] | Alicic RZ , Rooney MT , Tuttle KR . Diabetic kidney disease: challenges, progress, and possibilities. Clin J Am Soc Nephrol. (2017) ;12: (12):2032–2045. |
[2] | Hong YA , Ban TH , Kang CY , Hwang SD , Choi SR , Lee H , Jung HY , Kim K , Kwon YE , Kim SH , Kim TH , Koo HS , Yoon CY , Kim K , Park J , Kim YK . Trends in epidemiologic characteristics of end-stage renal disease from Korean Renal Data System (KORDS). Kidney Res Clin Pract. (2021) ;40: (1):52–61. |
[3] | Hill NR , Fatoba ST , Oke JL , et al. Global prevalence of chronic kidney disease - a systematic review and meta-analysis. PLoS One. (2016) ;11: (7):e0158765. |
[4] | Hur KY , Moon MK , Park JS , Kim SK , Lee SH , Yun JS , Baek JH , Noh J , Lee BW , Oh TJ , Chon S , Yang YS , Son JW , Choi JH , Song KH , Kim NH , Kim SY , Kim JW , Rhee SY , Lee YB , Jin SM , Kim JH , Kim CH , Kim DJ , Chun S , Rhee EJ , Kim HM , Kim HJ , Jee D , Kim JH , Choi WS , Lee EY , Yoon KH , Committee of Clinical Practice Guidelines, Korean Diabetes Association. 2021 Clinical practice guidelines for diabetes mellitus of the Korean Diabetes Association. Diabetes Metab J. (2021) ;45: (4):461–481. |
[5] | Ohkuma T , Jun M , Chalmers J , et al. Combination of changes in estimated GFR and albuminuria and the risk of major clinical outcomes. Clin J Am Soc Nephrol. (2019) ;14: (6):862–872. |
[6] | Carrero JJ , Grams ME , Sang Y , Ärnlöv J , Gasparini A , Matsushita K , Qureshi AR , Evans M , Barany P , Lindholm B , Ballew SH , Levey AS , Gansevoort RT , Elinder CG , Coresh J . Albuminuria changesare associated with subsequent risk of end-stage renal disease andmortality. Kidney Int. (2017) ;91: (1):244–251. |
[7] | Yamazaki T , Mimura I , Tanaka T , Nangaku M . Treatment of diabetic kidney disease: current and future. Diabetes Metab J. (2021) ;45: (1):11–26. |
[8] | KDIGO CKD Work Group. KDIGO 2012 clinical practice guideline for the evaluation and management of chronic kidney disease. Kidney Int Suppl. (2013) ;3: :1–150. |
[9] | Levey AS , de Jong PE , Coresh J , El Nahas M , Astor BC , Matsushita K , Gansevoort RT , Kasiske BL , Eckardt KU . The definition, classification, and prognosis of chronic kidney disease: a KDIGO controversies conference report. Kidney Int. (2011) ;80: (1):17–28. |
[10] | Fraser SD , Blakeman T . Chronic kidney disease: identification and management in primary care. Pragmatic and Observational Research. (2016) ;7: :21–32. |
[11] | Singh M , Shin S . Changes in erythrocyte aggregation and deformability in diabetes mellitus: a brief review. CSIR. (2009) ;47: :7–15. |
[12] | Cho YI , Mooney MP , Cho DJ . Hemorheological disorders in diabetes mellitus. J Diabetes Sci Technol. (2008) ;2: (6):1130–8. |
[13] | Turpin C , Catan A , Guerin-Dubourg A , Debussche X , Bravo SB , Álvarez E , et al. Enhanced oxidative stress and damage inglycated erythrocytes. PLoS ONE. (2020) ;15: (7):e0235335. |
[14] | Lee SB , Kim YS , Kim JH , Park K , Nam JS , Kang S , Park JS , Shin S , Use of RBC deformability index as an early marker of diabetic nephropathy, Clinical Hemorheology and Microcirculation. (2019) ;72: :75–84. |
[15] | Wang Y , Yang P , Yan Z , Liu Z , Ma Q , Zhang Z , Wang Y , Su Y . The relationship between erythrocytes and diabetes mellitus. J Diabetes Res. (2021) ;25: :6656062. |
[16] | Lee S , Lee MY , Nam JS , Kang S , Park JS , Shin S , Ahn CW , Kim KR . Hemorheological Approach for Early Detection of Chronic Kidney Disease and Diabetic Nephropathy in Type 2 Diabetes. Diabetes Technol Ther. (2015) ;17: (11):808–15. |
[17] | Shin S , Nam JH , Hou JX , Suh JS . A transient, microfluidic approach to the investigation of erythrocyte aggregation: the threshold shear-stress for erythrocyte disaggregation, Clinical Hemorheology and Microcirculation. (2009) ;42: :117–125. |
[18] | Xue S , Lee BK , Shin S , Disaggregating shear stress: the roles of cell deformability and fibrinogen concentration, Clinical Hemorheology and Microcirculation. (2013) ;55: :231–240. |
[19] | Lee H , Na W , Lee SB , Ahn CW , Moon JS , Won KC , Shin S . Potential diagnostic hemorheological indexes for chronic kidney disease in patients with type 2 diabetes. Frontiers in Physiology. (2019) ;10: :1062. |
[20] | Chung SM , Oh JH , Moon JS , et al. Critical shear stress is associated with diabetic kidney disease in patients with type 2 diabetes. Scientific Reports. (2018) ;8: (1):908. |
[21] | Kim J , Chung H , Cho M , Lee BK , Karimi A , Shin S . The role of critical shear stress on acute coronary syndrome. Clin Hemorheol Microcirc. (2013) ;55: (1):101–9. doi: 10.3233/CH-131694. PMID: 23445628. |
[22] | Fuchs J , Pinhas A , Davidson E , Rotenberg Z , Agmon J , Weinberger I . Plasma viscosity, fibrinogen and haematocrit in the course of unstable angina. Eur Heart J. (1990) ;11: (11):1029–32. |
[23] | Saribal D , Blood viscosity of individuals with alcohol abuse, Annals of Medical Research. (2019) ;26: (4):695–7. |
[24] | Hamazaki T , Shishido H . Increase in blood viscosity due to alcohol drinking. Thromb Res. (1983) ;30: (6):587–94. |
[25] | Fehr M , Galliard-Grigioni KS , Reinhart WH . Influence of acute alcohol exposure on hemorheological parameters and platelet function in vivo and in vitro . Clin Hemorheol Microcirc. (2008) ;39: (1-4):351–8. |
[26] | Perkins NJ , Schisterman EF . The inconsistency of “optimal” cutpoints obtained using two criteria based on the receiver operating characteristic curve. Am J Epidemiol. (2006) ;163: (7):670–675. |
[27] | Power M , Fell G , Wright M . Principles for high-quality, high-value testing. Evid Based Med. (2013) ;18: (1):5–10. |
[28] | Fischer JE , Bachmann LM , Jaeschke R . A readers’ guide to the interpretation of diagnostic test properties: clinical example of sepsis. Intensive Care Med. (2003) ;29: (7):1043–51. |
[29] | Anders HJ , Huber TB , Isermann B , Schiffer M . CKD in diabetes: diabetic kidney disease versus nondiabetic kidney disease. Nat Rev Nephrol. (2018) ;14: (6):361–377. |


