
Identification of a prognostic signature based on five ferroptosis-related genes for diffuse large B-cell lymphoma
Abstract
BACKGROUND:
Therapies for diffuse large B-cell lymphoma (DLBCL) are limited due to the diverse gene expression profiles and complicated immune microenvironments, making it an aggressive lymphoma. Beyond this, researches have shown that ferroptosis contributes to tumorigenesis, progression, and metastasis. We thus are interested to dissect the connection between ferroptosis and disease status of DLBCL. We aim at generating a valuable prognosis gene signature for predicting the status of patients of DLBCL, with focus on ferroptosis-related genes (FRGs).
OBJECTIVE:
To examine the connection between ferroptosis-related genes (FRGs) and clinical outcomes in DLBCL patients based on public datasets.
METHODS:
An expression profile dataset for DLBCL was downloaded from GSE32918 (https://www.ncbi.nlm.nih.gov/geo/ query/acc.cgi?acc=gse32918), and a ferroptosis-related gene cluster was obtained from the FerrDb database (http://www. zhounan.org/ferrdb/). A prognostic signature was developed from this gene cluster by applying a least absolute shrinkage and selection operator (LASSO) Cox regression analysis to GSE32918, followed by external validation. Its effectiveness as a biomarker and the prognostic value was determined by a receiver operator characteristic curve mono factor analysis. Finally, functional enrichment was evaluated by the package Cluster Profiler of R.
RESULTS:
Five ferroptosis-related genes (FRGs) (GOP1, GPX2, SLC7A5, ATF4, and CXCL2) associated with DLBCL were obtained by a multivariate analysis. The prognostic power of these five FRGs was verified by TCGA (https://xenabrowser.net/datapages/?dataset=TCGA.DLBC.sampleMap%2FHiSeqV2_PANCAN&host=https%3A%2F%2Ftcga.xenahubs.net&removeHub=https%3A%2F%2Fxena.treehouse.gi.ucsc.edu%3A44) and GEO (https://www.ncbi.nlm.nih.gov/geo/query/acc.cgi?acc=gse 32918) datasets, with ROC analyses. KEGG and GO analyses revealed that upregulated genes in the high-risk group based on the gene signature were enriched in receptor interactions and other cancer-related pathways, including pathways related to abnormal metabolism and cell differentiation.
CONCLUSION:
The newly developed signature involving GOP1, GPX2, SLC7A5, ATF4, and CXCL2 has the potential to serve as a prognostic biomarker. Furthermore, our results provide additional support for the contribution of ferroptosis to DLBCL.
1.Introduction
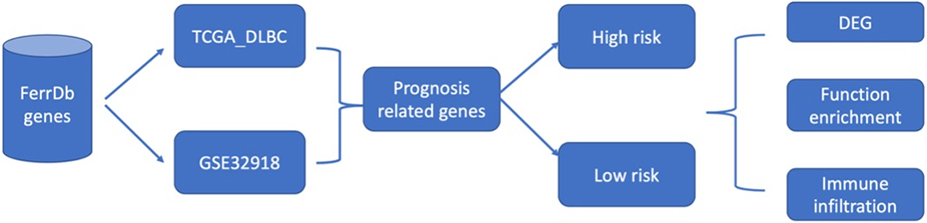
Figure 1.
Flowchart of this current study.
Diffuse large B-cell lymphoma (DLBCL) is a common and aggressive type of non-Hodgkin lymphoma with a poor prognosis. It can arise de novo or result from the transformation of lymphoma. The morbidity of this disease increases with age, especially among males [1, 2]. Intrinsic and extrinsic risk factors are involved in the progression of the disease, including genetic and environmental factors [3]. Advances in gene expression profiling have resulted in initial progress toward the molecular diagnosis of DLBCL subtypes, including two prominent “cell-of-origin” subtypes which account for 80%–85% of cases, termed germinal center and activated B cell-like DLBCL [4, 5]. The substantial heterogeneity of DLBCL poses a major challenge to the treatment and prediction of prognosis of this disease. Great progress in the development of therapies for DLBCL at present has resulted in a significantly extended overall survival (OS) [6]; however, therapeutic efficacies are still limited due to the high proliferation rate, heterogeneity, and invasion of tumor cells [2, 5]. Some studies have identified specific markers with remarkable performance for early diagnosis and the prediction of survival [7, 8, 9]. Despite numerous clinical trials focusing on these molecular markers for DLBCL treatment, few have been successful. Therefore, identification of new, effective prognostic models for DLBCL is an urgent and important task.
Regulated cell death has a critical role in normal homeostasis and development [10]. A unique form of regulated cell death, termed ferroptosis, was initially introduced by Stockwell et al. as a unique form of iron-dependent oxidative cell death [11, 12]. A study of 114 tumor cell lines has shown that DLBCL and kidney cancer are associated with erastin [13], which can promote ferroptosis to inhibit tumor development. Furthermore, ferroptosis can inhibit cancer progression [14]. Dissecting the mechanisms underlying ferroptosis and ferroptosis inducers provides a new direction for cancer treatment [15, 16]. A great deal of ferroptosis-related genes (FRGs) were performed as prognostic biomarkers, including GPX4 [17], HIF1A [18], and NFE2L2 [19]. Furthermore, FRGs have been approved as biomarkers for the treatment of DLBCL [19, 20, 21]; however, their clinical value has not been completely determined owing to limited data.
Detailed information about the clinicopathologic and molecular features of DLBCL is urgently needed. The aim of our research was to examine FRGs and clinical outcomes in DLBCL based on analyses of public datasets. In our research, the differential transcription of FRGs we evaluated according to mRNA expression data for patients with DLBCL and relevant clinical data from public datasets. Based on this process, we built a prognostic 5-FRGs signature and verified the characteristics of these FRGs using an external cohort (GSE83632: https://www.ncbi.nlm.nih.gov/geo/query/acc.cgi?acc=GSE83632). Furthermore, we performed KEGG (Kyoto Encyclopedia of Genes and Genomes) and GO (Gene Ontology) analysis to determine the potential mechanisms underlying the biological effects of the five FRGs.
2.Materials and methods
2.1Data acquisition
Publicly available data for two cohorts, including RNA-seq data (Transcripts Per Million/TPM-normalized) and clinical data for patients, were obtained from Gene Expression Omnibus (GEO) (https://www. ncbi.nlm.nih.gov/geo/query/acc.cgi?acc=gse32918) and The Cancer Genome Atlas (TCGA) (https://xenabrows er.net/datapages/?dataset=TCGA.DLBC.sampleMap% 2FHiSeqV2_PANCAN&host=https%3A%2F%2Ftcga. xenahubs.net&removeHub=https%3A%2F%2Fxena.tre ehouse.gi.ucsc.edu%3A44). The GSE32918 dataset was separated into two sets at a ratio 7:3 – training set (
2.2Data normalization
The expression profile data were uniformly normalized using TPM (Transcripts Per Million) counts, correcting for biases related to gene length and library size. By employing TPM normalization, we were able to compare gene expression levels across different samples in an accurate and reliable manner.
2.3Building a prognostic gene signature
A gene cluster related to overall survival (OS) was determined by both uni- and multivariate Cox regression analyses in the GSE32918 training set. This gene cluster was then employed to further refine the gene sets and build a FRG signature by applying the least absolute shrinkage and selection operator (LASSO) Cox regression analysis using the glmnet package [25] in R, which effectively selected the most predictive features. Furthermore, the selected predictive features were employed to establish multivariate Cox regression model to calculate samples’ risk scores. Based on each patient’s calculated risk score, patient samples were divided into two groups (low risk and high risk) by applying their median risk score as the threshold value. Following these steps, the risk scores for patients within the GSE32918 and TCGA datasets were determined to verify the effectiveness of the signature [26]. Independent clinical factors (including DLBCL pathological class, gender, age, and risk score) were evaluated by uni- or multivariate Cox regression analyses for the development of the 5-FRGs signature.
2.4ROC curve analyses
Receiver operating characteristic (ROC) curves were used to set up the best cut-off scores (which help to evaluate the sensitivity and specificity of the cut-offs in predicting survival outcomes) for the 5-FRGs, to carry out a further survival analysis.
2.5Survival analysis
The Kaplan-Meier survival curve, cumulative event table, and cumulative number table were drawn using the surveyor package. The cut-off risk scores based on the median value were determined using R.
2.6Differentially expressed gene analysis
DEGs between high- and low-risk groups in TCGA datasets were identified. Information from TCGA-DLBCL was included as covariates during the analysis. Eighty DEGs were identified for further analyses.
2.7Functional enrichment analysis
To annotate the functions of DEG sets, the Cluster Profiler package was used for KEGG and GO pathway enrichment analyses in R [27]. A single-sample gene set enrichment analysis (ssGSEA) was performed using GSVA to calculate the immune-related functions differing between the high-risk and low-risk groups [28]. Briefly, the enrichment fraction of immune-related gene clusters in each sample was calculated. The samples were divided into two groups (low-risk and high-risk) according to the threshold defined previously.
2.8Statistical analysis
A Kaplan-Meier analysis was used to compare overall survival (OS) between the two risk groups. The threshold for statistical significance was
3.Results
3.1Screening of five prognostic ferroptosis-related genes (5-FRGs) using GSE32918
Flowchart of this study is shown in Fig. 1.
Figure 2.
Summary of 217 ferroptosis-related genes significantly associated with overall survival by a univariate analysis. Eighteen FRGs were significantly associated with survival.
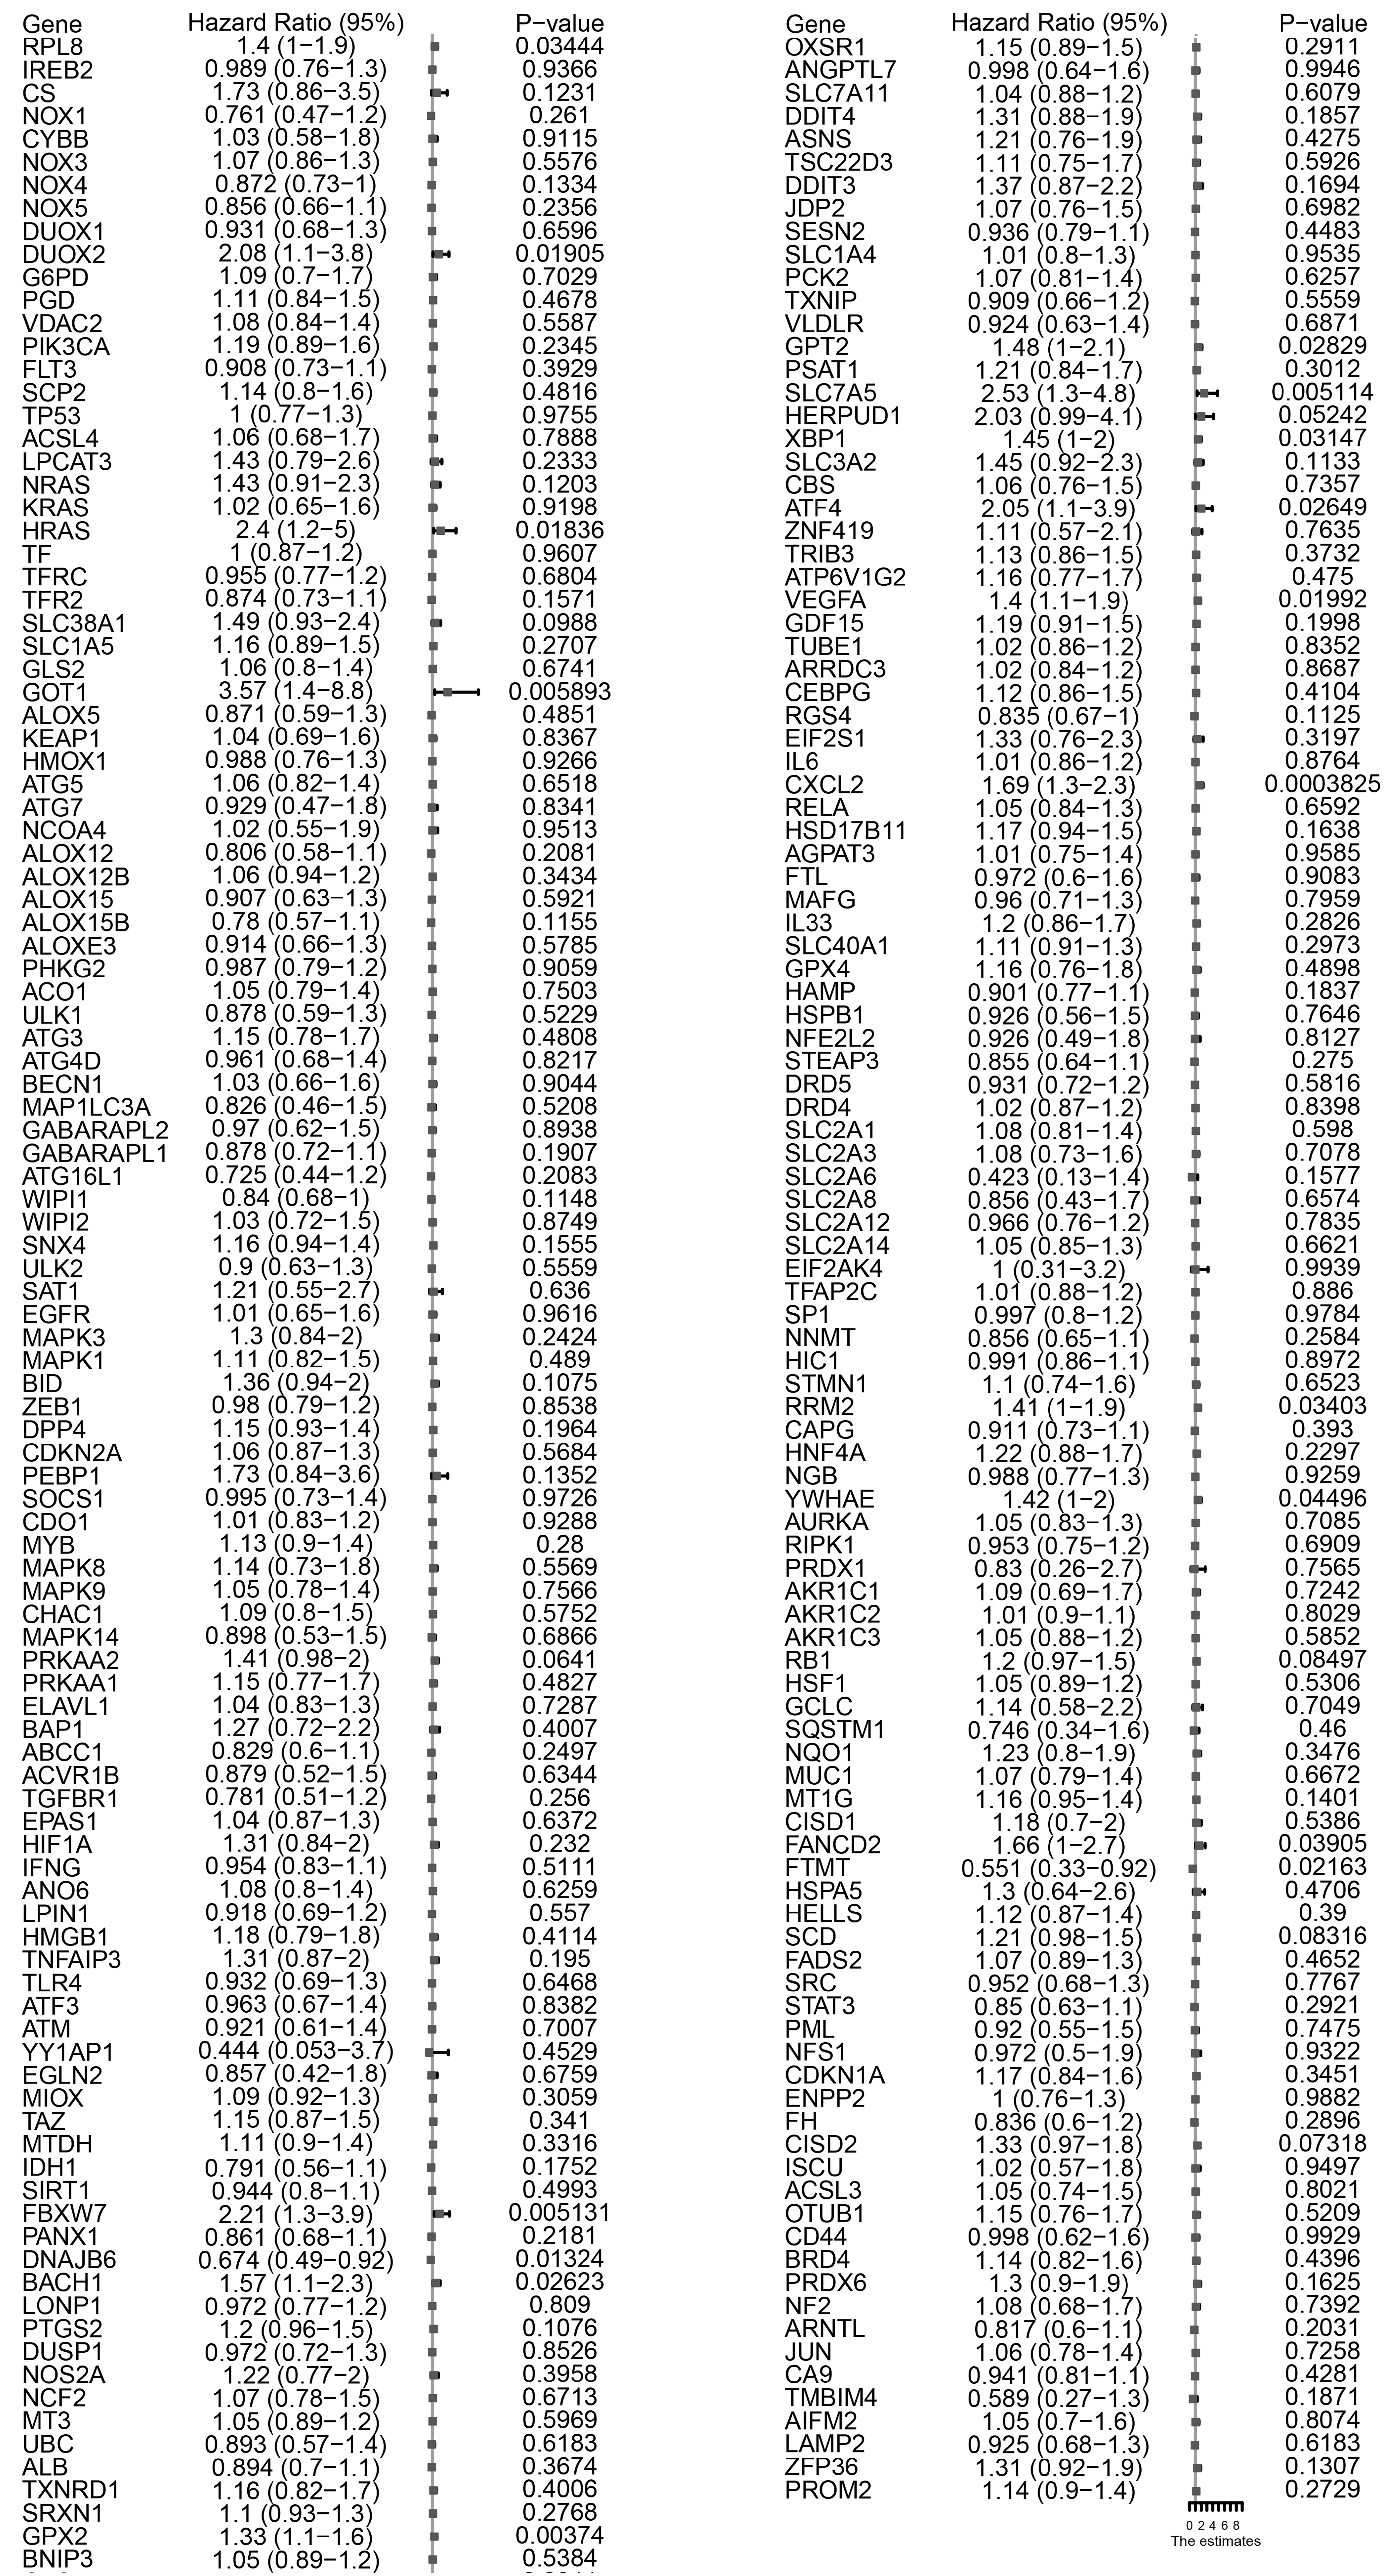
Figure 3.
Eighteen FRGs were associate with survival by a univariate analysis. Five ferroptosis-related genes with significant associations are noted in bold.

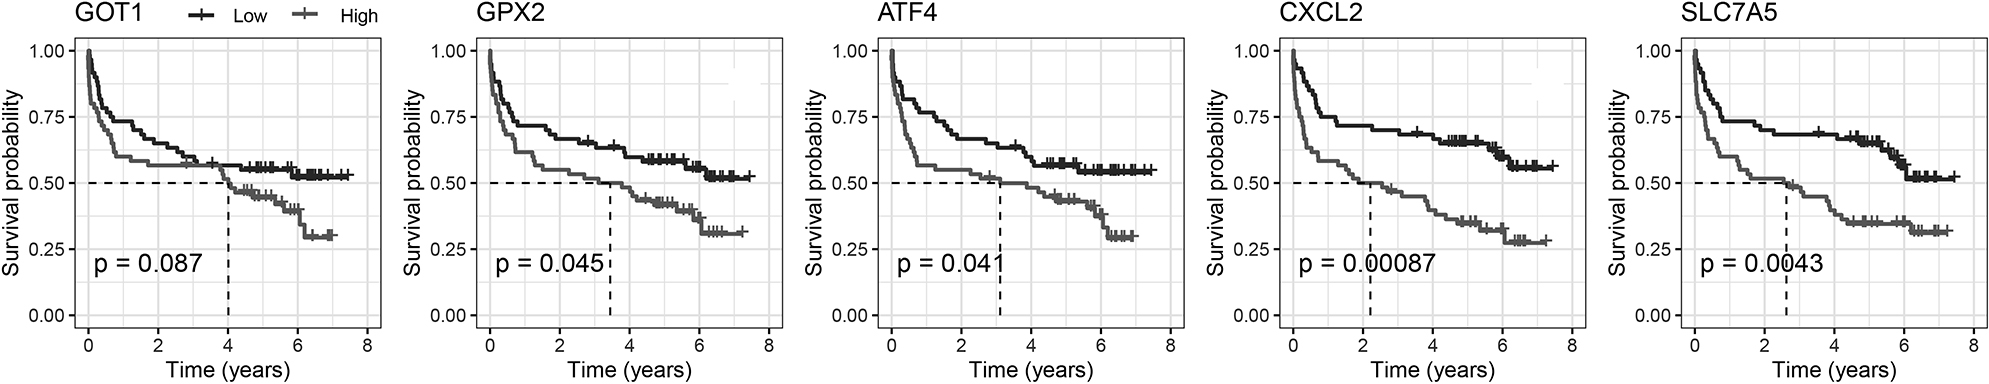
Figure 4.
Kaplan-Meier plot for the five FRGs.
A total of 172 DLBCL samples from GEO datasets (https://www.ncbi.nlm.nih.gov/geo/query/acc.cgi?acc= gse32918) and 48 DLBCL samples from TCGA datasets (https://xenabrowser.net/datapages/?dataset= TCGA.DLBC.sampleMap%2FHiSeqV2_PANCAN&host=https%3A%2F%2Ftcga.xenahubs.net&removeHub=https%3A%2F%2Fxena.treehouse.gi.ucsc.edu%3 A44) were included in the analysis. We analyzed the RNA-seq data available in GEO to identify differentially expressed FRGs between tumor tissues and adjacent normal tissues. In total, 257 ferroptosis-related genes (FRGs) were obtained from the FerrDb website (http://www.zhounan.org/ferrdb/), including driver genes, suppressor genes, and inducer genes. The probe data provided by the GPL platforms within the GEO datasets were used for probe and gene conversion process. The 257 FRGs expression were derived from microarray chip probing, and some genes remain undetectable due to the limited microarray probing capabilities. We carefully identified and excluded genes that were not detected in the chip data. After this process, we obtained 217 detectable genes for subsequent analyses.
We employed a univariate Cox proportional hazards model combined with LASSO (Least Absolute Shrinkage and Selection Operator) regression to select gene features. This method ensures identification only those genes that have a significant correlation with patient prognosis. With the predictive power of the Cox model and the feature selection capacity of LASSO, we ensure the selection of the resulting gene markers are not only relevant but also pivotal in predicting patients’ clinical outcomes. With this method, 18 of 217 FRGs significantly related to overall survival (OS) were screened (Fig. 2). Among these, five were also identified as significant factors in a multivariate analysis (Figs 3 and 4). Finally, the FRGs GOP1, GPX2, SLC7A5, ATF4, and CXCL2 were identified as potential biomarkers for DLBCL.
Figure 5.
Building a prognostic signature depend on 5-FRGs. (A) Distribution of statistical coefficients for the five FRGs. (B) Box plot of the partial likelihood deviance against log
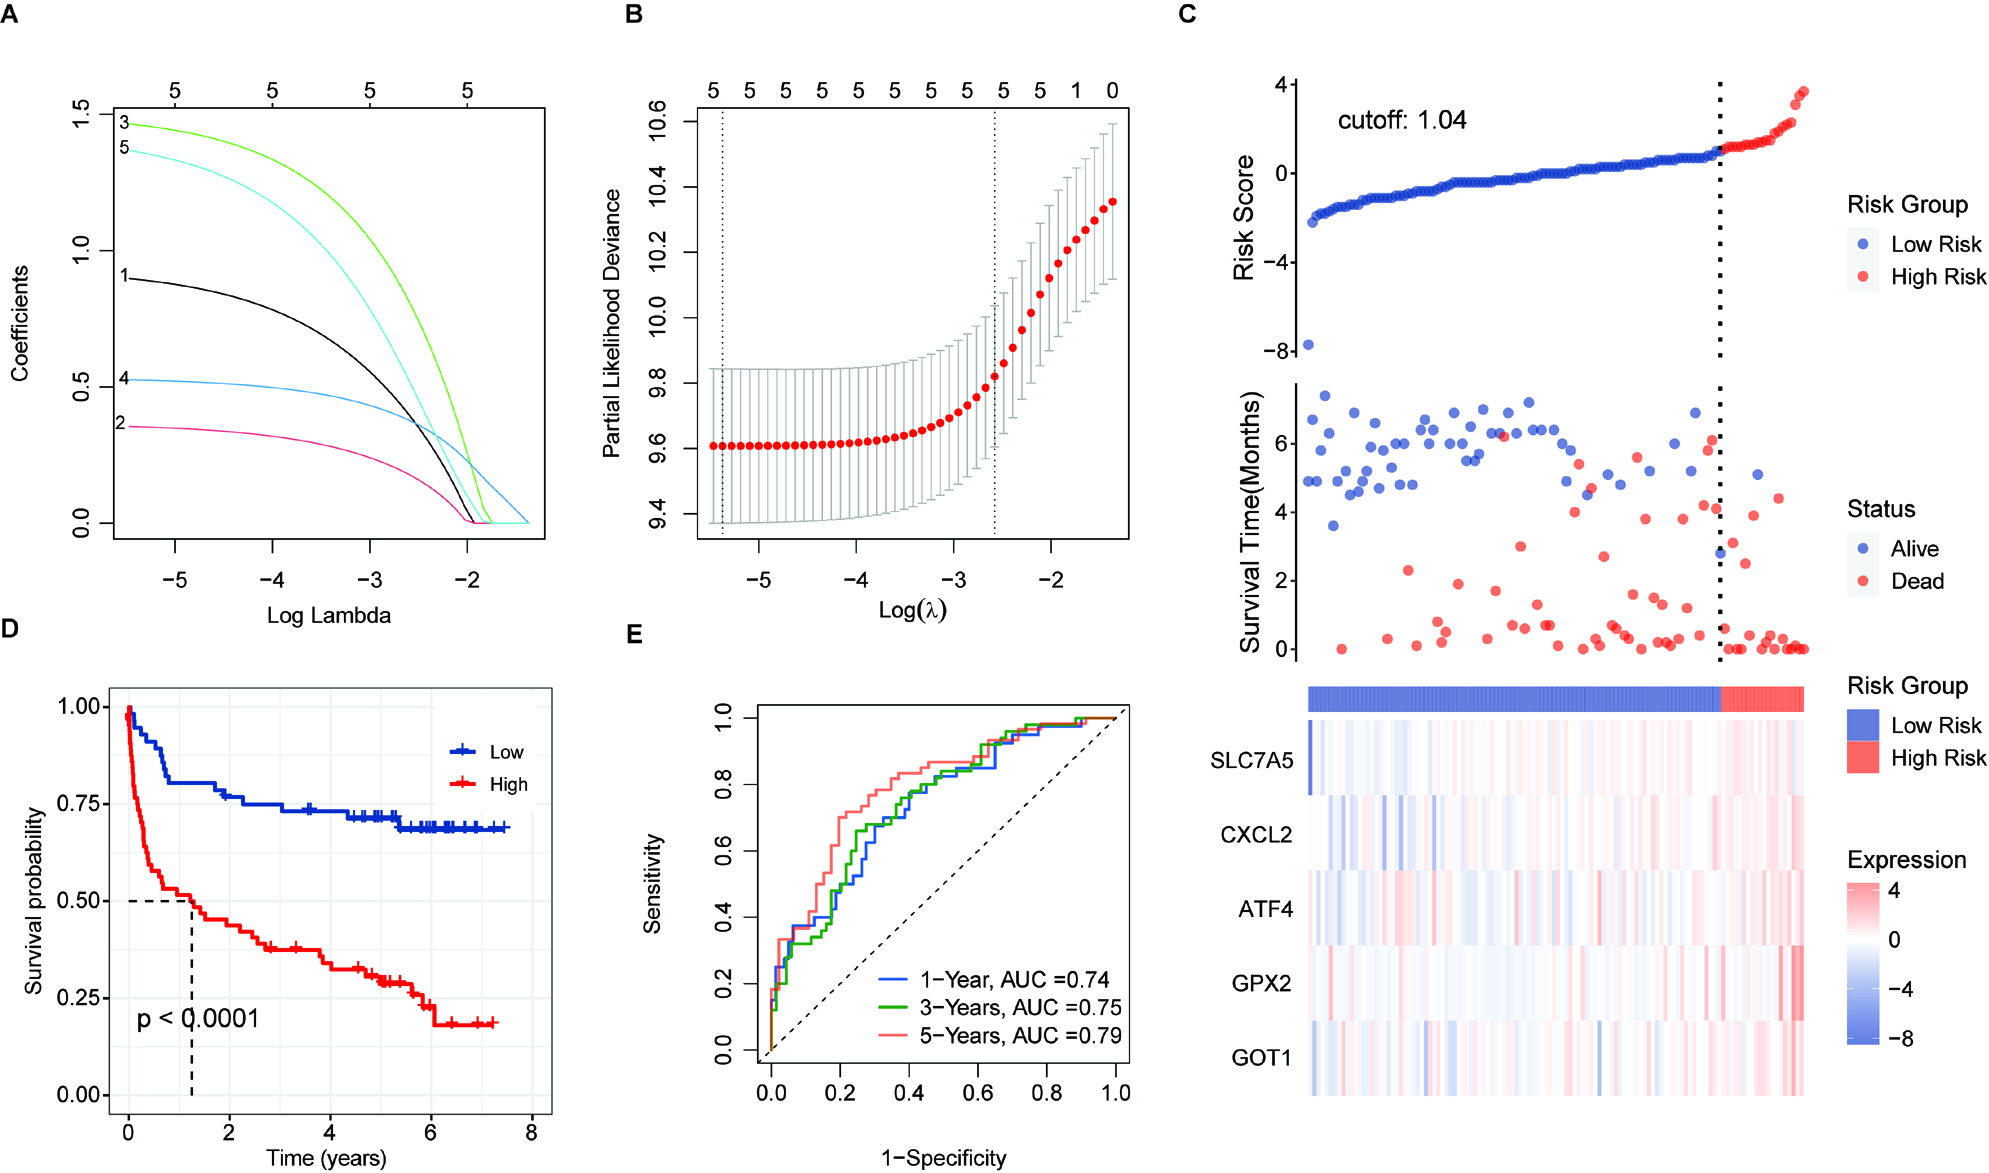
Figure 6.
Validation of prognostic score of the 5-FRGs. (A) Survival curve for samples in the two risk groups in the TCGA dataset. (B) Visualization of the survival status, survival time, and expression level the two risk groups based on 5-FRGs scores by using the TCGA dataset. (C) ROC curve for the AUC analysis of the prognostic efficiency of the 5-FRGs for overall survival in the TCGA dataset. Blue shows 2-year, green shows 3-year, and red shows 5-year survival. (D) Survival curve for samples in the two risk groups in the GSE32918 test set. (E) Visualization of the survival status, survival time, and expression level the two risk groups based on 5-FRGs scores in the GSE32918 test set. (F) ROC curve for the AUC analysis of the prognostic efficiency of the 5-FRGs for overall survival in the GSE32918 test set.
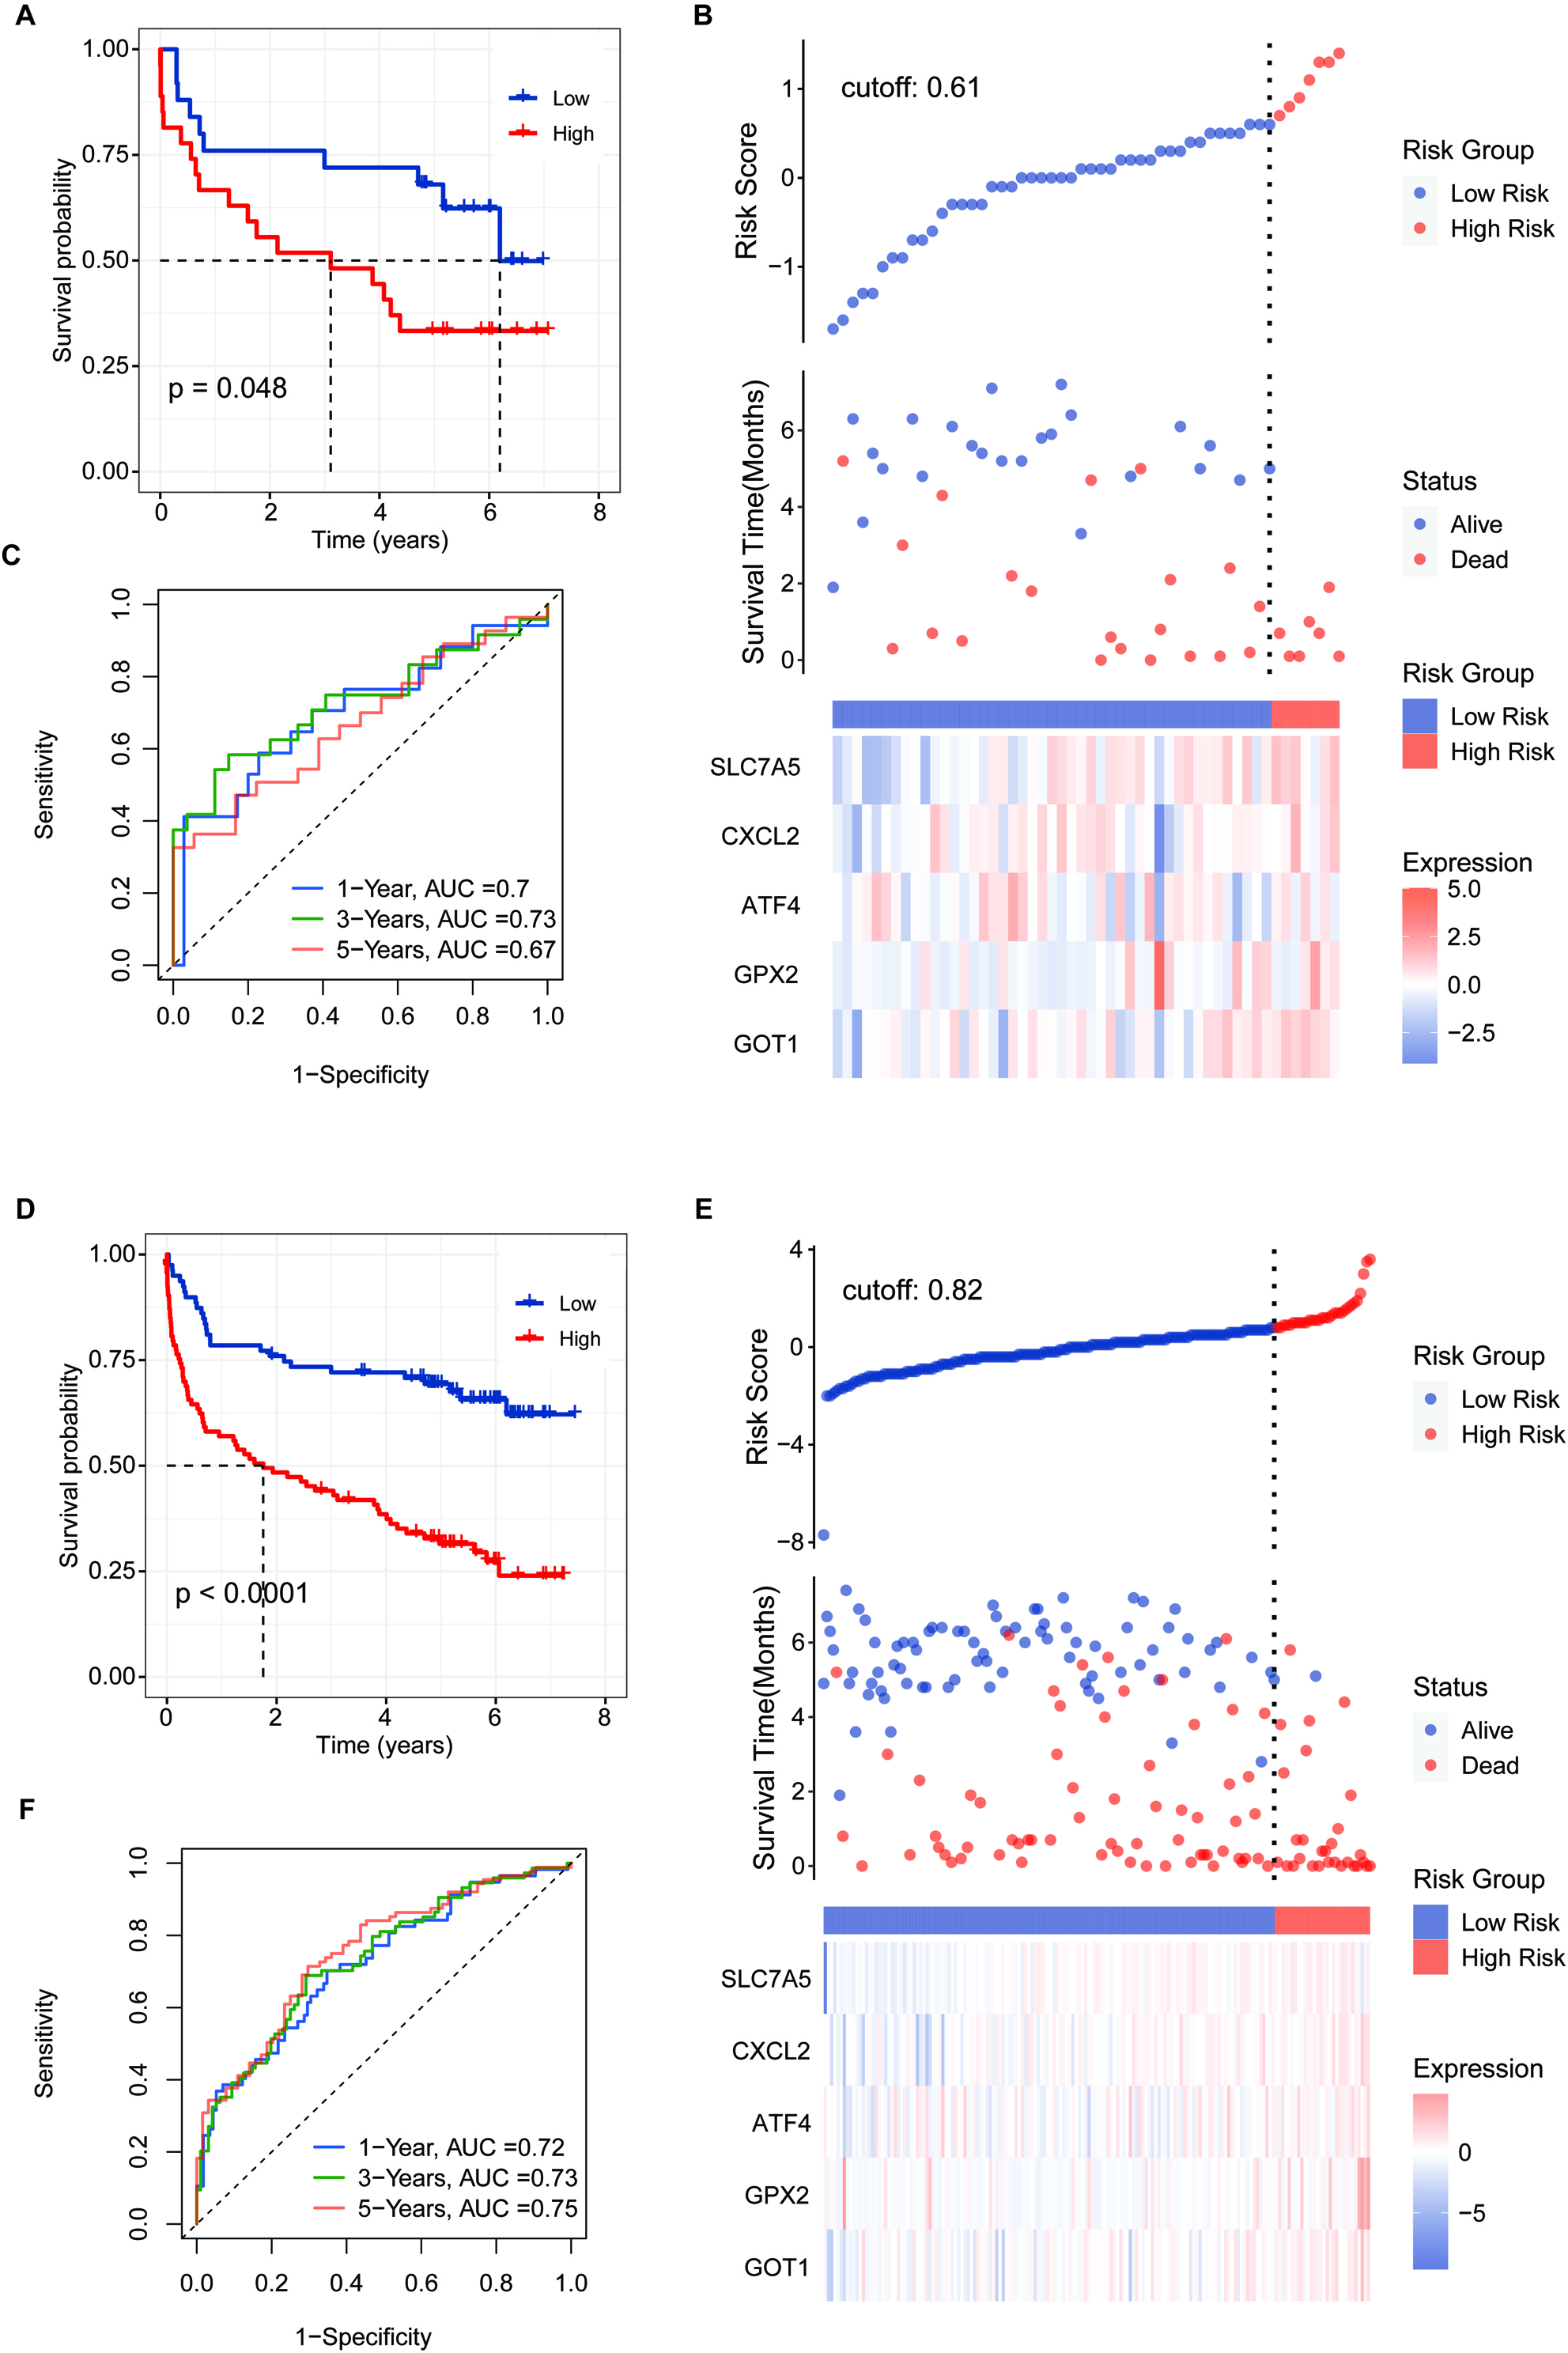
Figure 7.
Validation of the 5-FRG signature using the GSE32918 test set. (A) Survival curve for samples in the two risk groups in the GSE32918 test. (B) Visualization of the survival status, survival time, and expression level the two risk groups based on 5-FRGs scores in the GSE32918 test set. (C) ROC curve for the AUC analysis of the prognostic efficiency of the 5-FRGs for overall survival in the GSE32918 test set. Blue shows 2-year, green shows 3-year, and red shows 5-year survival.
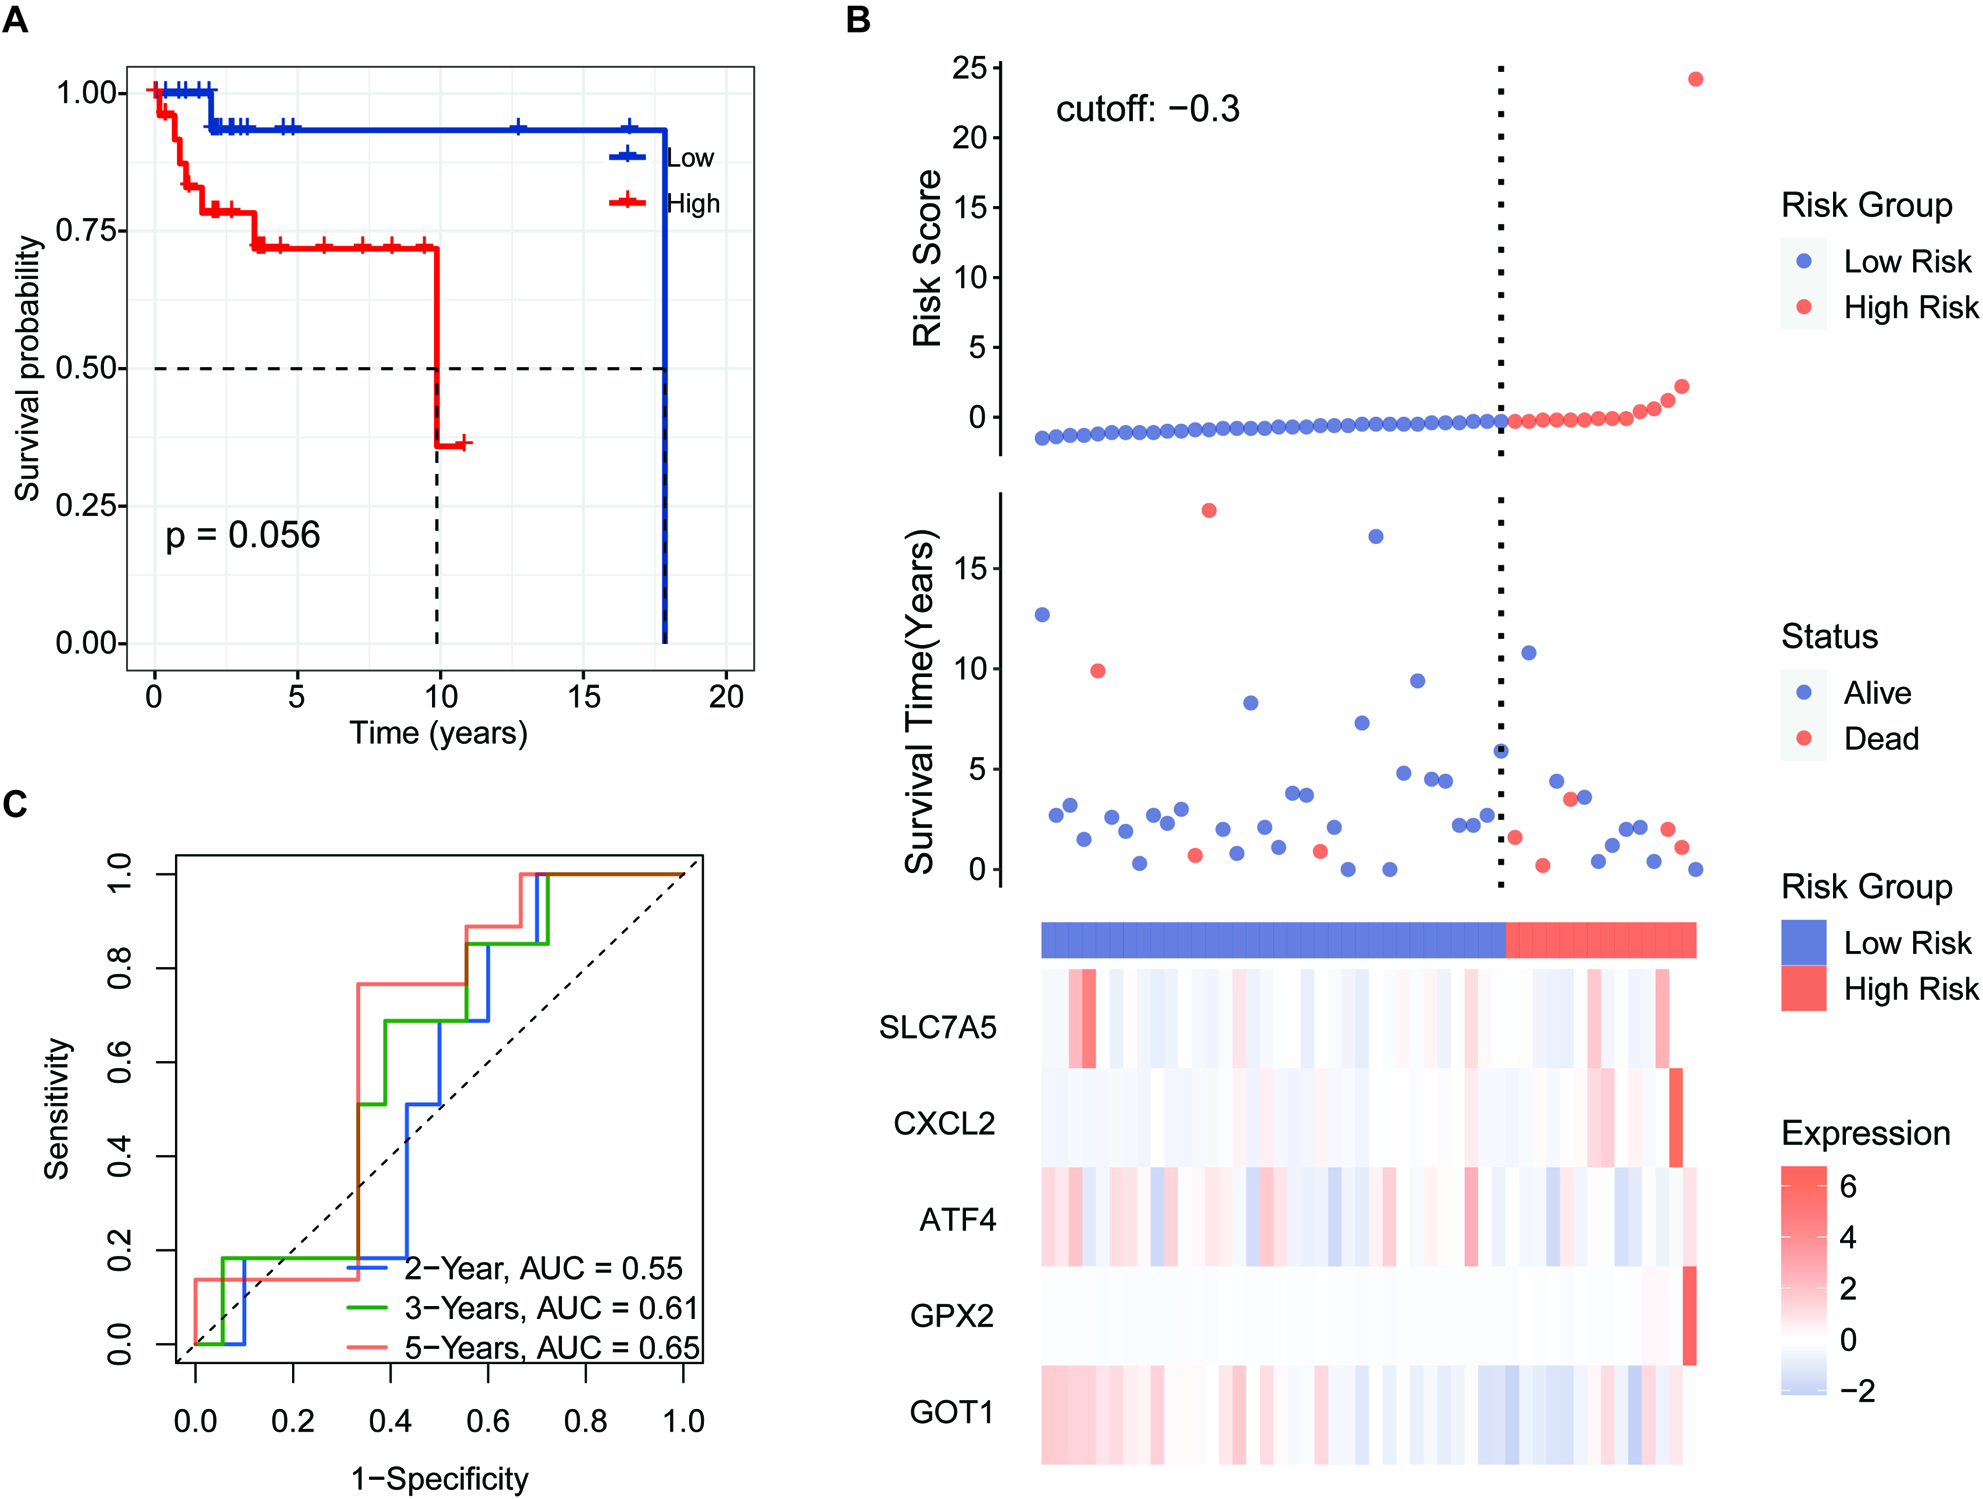
Figure 8.
Independent prognostic score of the 5-FRG signature. (A–C) Violin plot of the distribution of individual risk scores for each group according to pathological type (A), sex (B), and age (C), ABC: activated B-cell, GCB: germinal center B-cell. (D and E) Relationships between clinical factors and overall survival by (D) univariate Cox-regression analyses and (E) a multivariate analysis.
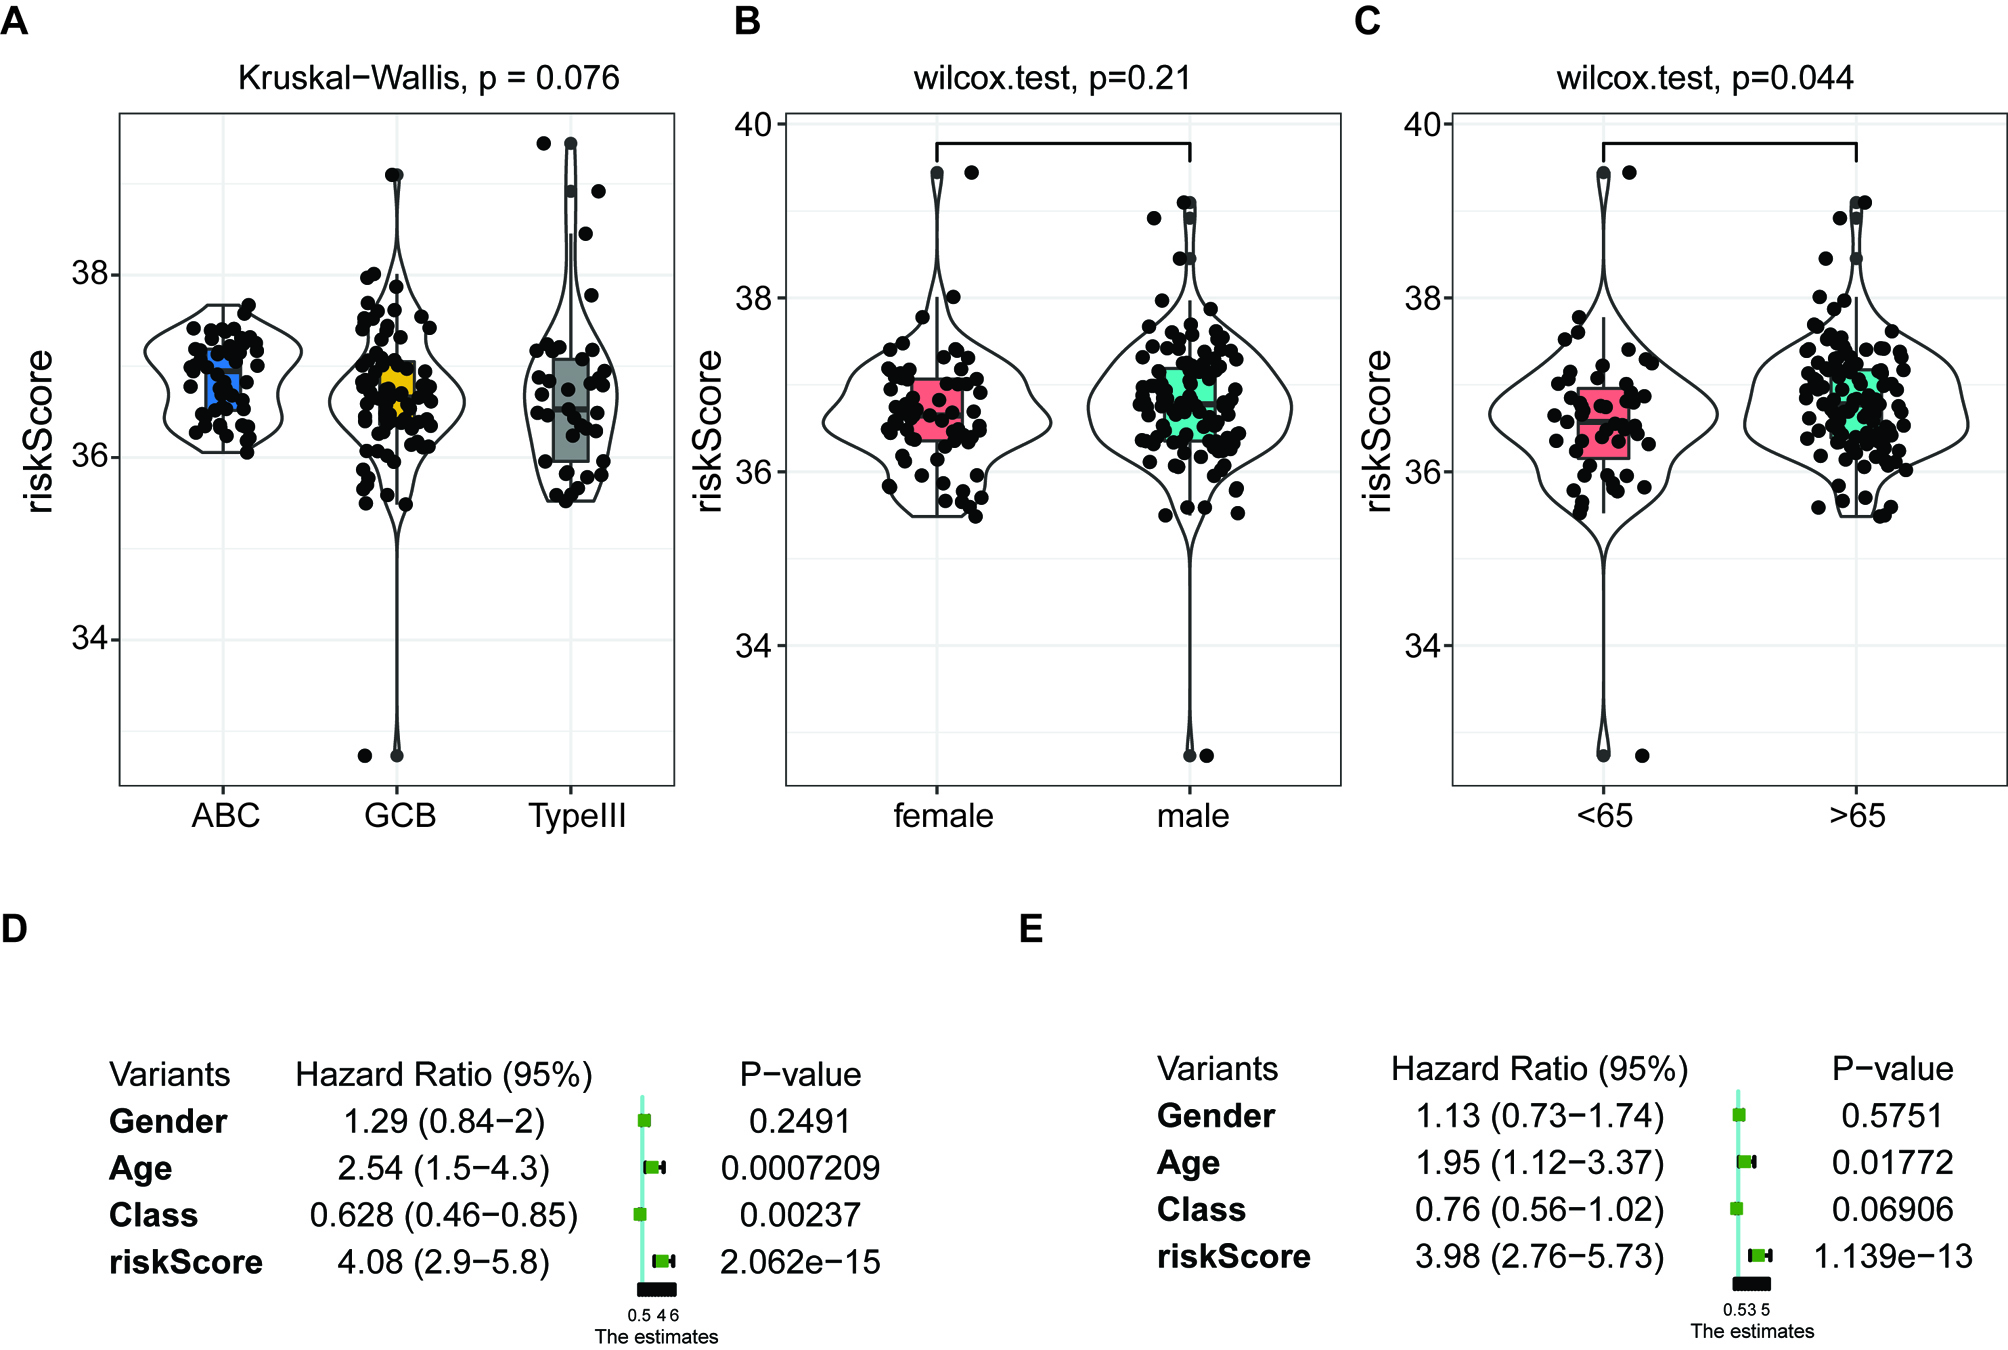
Figure 9.
Results of functional enrichment analyses. (A) Volcano plot of the distribution of DEGs between the high-risk group and low-risk group based on the FRG signature. (B) KEGG pathway analysis of the upregulated DEGs in the high-risk group. (C) GO pathway analysis of the upregulated DEGs in the high-risk group.
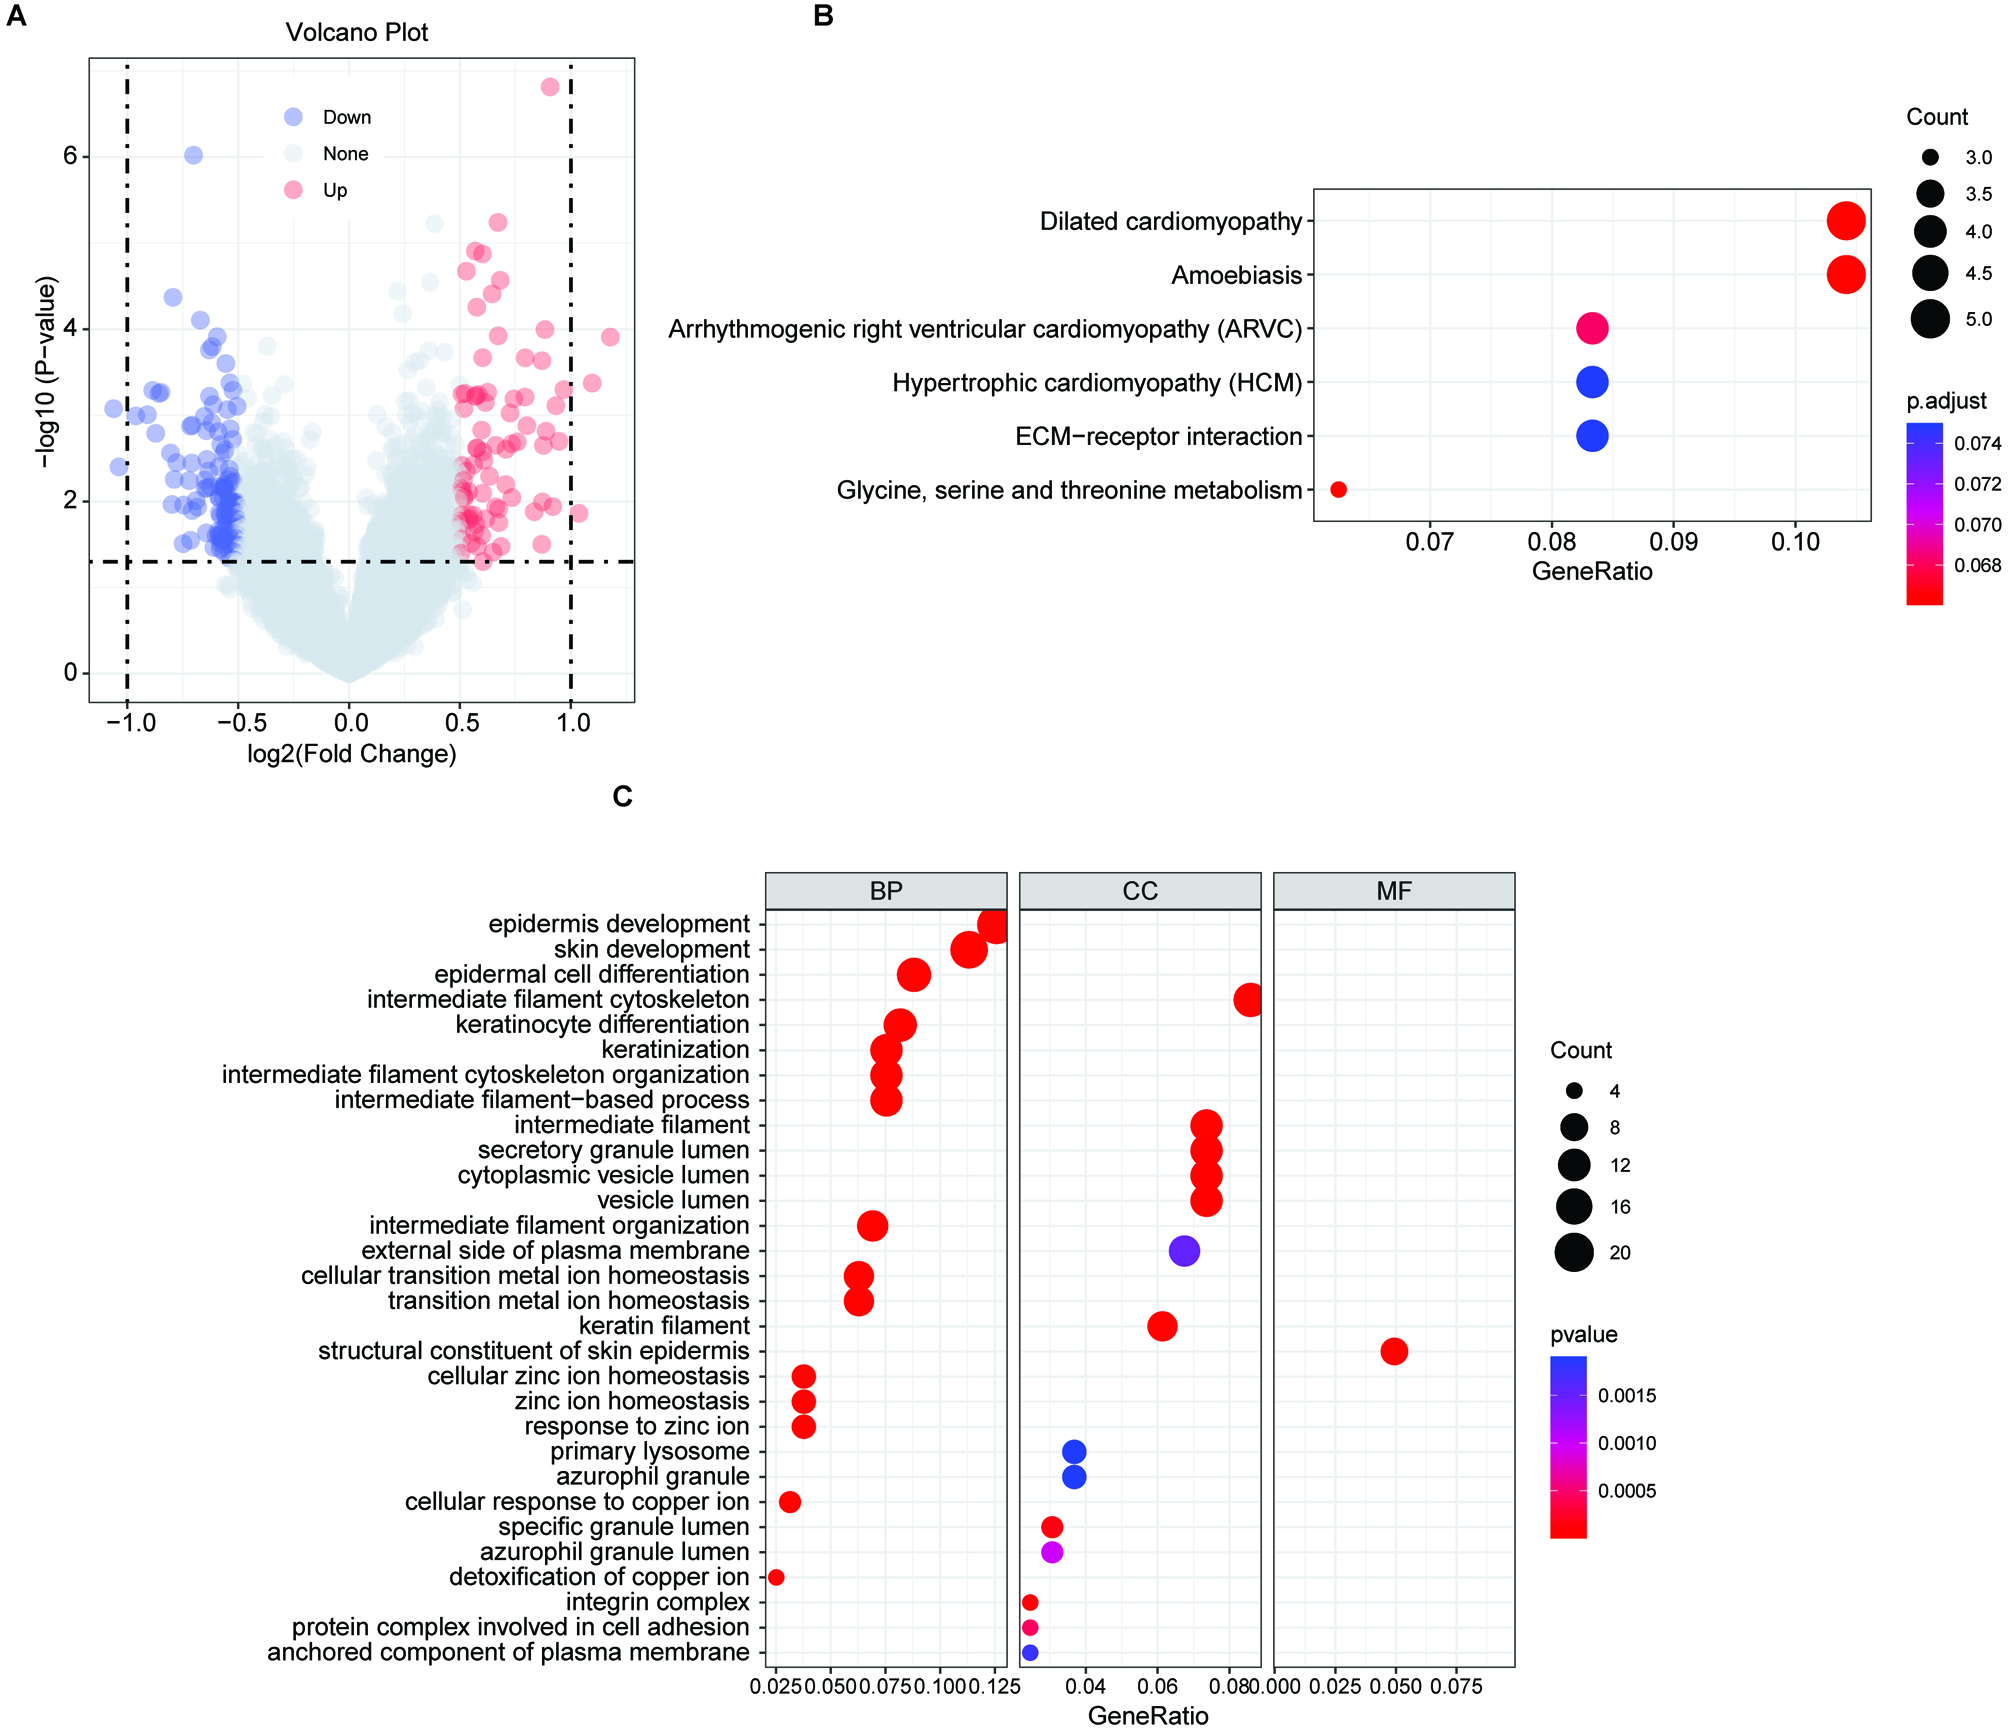
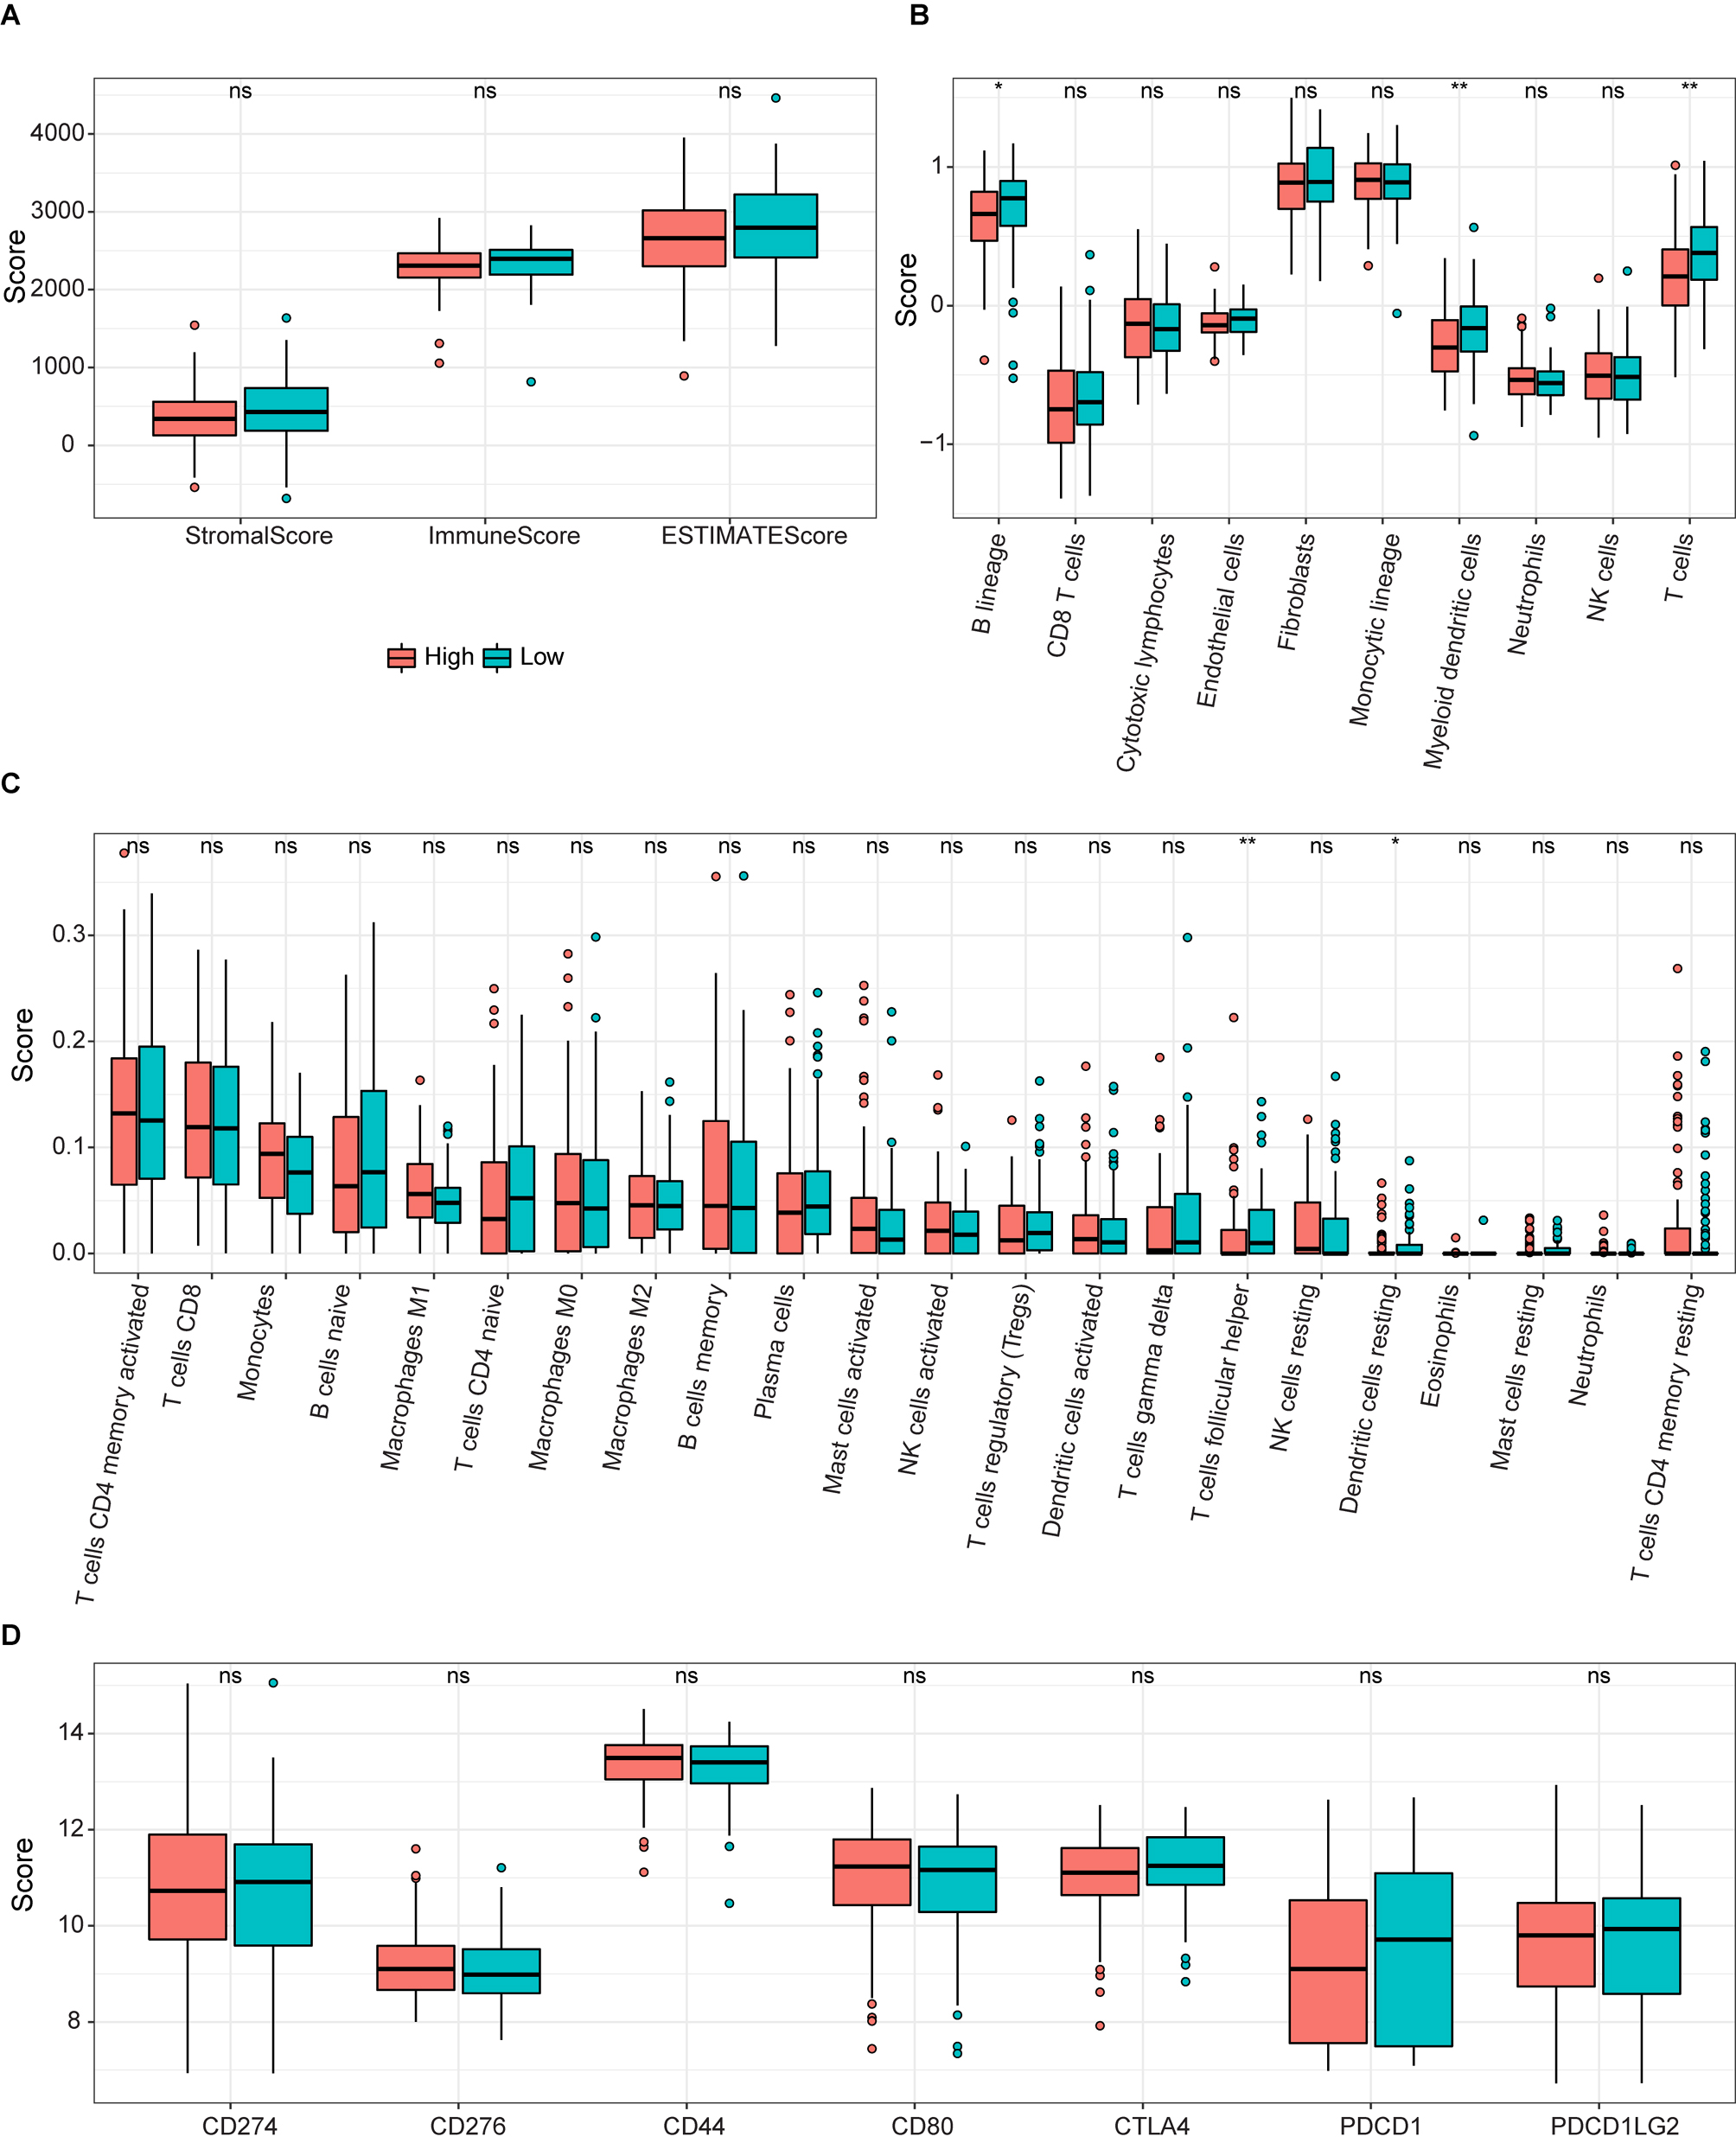
Figure 10.
ssGSEA results for the two groups. (A) Box plot of relationships between the signature and stromal, immune, and estimate scores. (B and C) Boxplots of enrichment values for 10 immune cells and 22 immune-related functions. (D) Enrichment scores for seven immune-related biomarkers are shown in boxs.
3.2Prognostic value of the 5-FRGs signature
We next evaluated whether the expression profile of the 5-FRGs signature could be used to establish a gene-based prognostic model by LASSO-Cox regression.
Patients were divided into two groups including high- and low-risk groups according to the median cut-off risk scores/values. Applying a principal component analysis (PCA) and t-distributed random neighborhood embedding (t-SNE) analysis (Fig. 5C), patients in the two groups were clearly separated. Next, we performed a survival analysis based on the transcription profiles. As expected, patients with high 5-FRGs values had a poor survival (Fig. 5D,
3.3Verification of the 5-FRGs signature using TCGA and GEO datasets
To verify the prognostic value of the 5-FRGs signature, we conducted a predictive analysis using the cohorts from TCGA, GSE32918 (Whole set,
3.4Relationship between the 5-FRGs and clinical characteristics
We applied the independent prognostic factors based on OS in an additional cohort (GSE83632: https://www. ncbi.nlm.nih.gov/geo/query/acc.cgi?acc=GSE83632) and calculated the distribution of individual 5-FRGs in each group according to gender, age, pathological class (Fig. 8A–C). The risk scores for the groups according to age were significantly correlated with outcomes in the cohort of TCGA (Fig. 8C). Next, we conducted univariate and multivariate Cox regression analyses of the 5-FRGs features in the TCGA dataset to determine whether they are independent predictors of OS. Univariate Cox regression analyses showed that the risk score in the TCGA cohort was significantly related to OS (HR
In the context of medical research, particularly when dealing with disease like Diffuse Large B-Cell Lymphoma (DLBCL), we are perpetually in pursuit of indicators that can help in the early detection and prediction of the disease course. Such indicators are diagnostic and prognostic factors. Diagnostic factors help in identifying the presence of a disease while prognostic factors provide information about the likely outcomes of the disease, including the chances of recovery, recurrence, or progression. Our study suggested that we have identified a set of five Ferroptosis-Related Genes (5-FRGs) that show promise in diagnosing DLBCL and providing a prognosis for DLBCL patients.
3.5Functional annotation of the 5-FRGs
To determine the potential biological functions of the 5-FRGs, 80 DEGs that were upregulated in the high-risk group compared with the low-risk group were evaluated by a functional enrichment analysis (Fig. 9A). In a KEGG pathway analysis, the DEGs were enriched in the ECM receptor interaction and glycine, serine and threonine metabolic pathways (Fig. 9B). A GO analysis demonstrated that the DEGs were associated with terms related to cell interactions, including cell adhesion, secretory granule lumen, and anchored component of plasma membrane, consistently with the results of the KEGG. In addition, these genes were closely related to certain iron-related pathways, such as cellular transition metal ion homeostasis, gated cellular response to copper ion, and detoxification of copper ion (Fig. 9C). Furthermore, terms related to cancer were obtained, such as epidermal cell differentiation and amoebic infection. These results indicated that the functions of the 5-FRGs are closely related to cancer progression.
3.6Correlations of 5-FRGs with immune function in DLBCL
To determine the potential connection of 5-FRGs and immune status, we calculated the enrichment scores for various immune cell subsets with related functions by a ssGSEA (Fig. 10A and B). We did not detect a significant relationship between the immune response and the risk score based on 5-FRGs. However, the levels of infiltration of various immune cells, such as T cells, B lineage, and myeloid dendritic cells, were lower in the high-risk group than in the low-risk group. In addition, DEG scores differed between two groups of immune-related functions for T cells follicular helper and Dendritic cells resting. These results indicate that the 5-FRGs did not actively participate in immune-related pathways to promote cancer. Immune check point biomarkers were compared between the two groups, revealing that levels of immune checkpoint genes were not closely related to levels of the 5-FRGs. In conclusion, these results suggest that the 5-FRGs signature did not significantly connect with the immune function in DLBCL, since the immune response in patients with DLBCL and the risk scores derived from these 5-FRGs were not directly associated. However, we do appreciate that there is a significant difference in immune cell infiltration between high-risk and low-risk groups. We noticed that the presence of various critical immune cells, such as T cells, B cells, and myeloid dendritic cells, was reduced in patients who were categorized within the high-risk group. This suggests that while the 5-FRGs signature may not directly reflect the immune response, there is a potential association where a high-risk score correlates with diminished infiltration of specific immune cells in the tumor microenvironment. The finding that a disparity in DEG scores related to differences in T follicular help cells and resting dendritic cells between the two groups, suggests that the 5-FRGs signature could be indirectly linked to certain aspects of immune functions.
4.Discussion
DLBCL is a common aggressive lymphoma characterized by rapid development and heterogeneity and shows high mortality and incidence rates [29, 30]. Many researchers have demonstrated that ferroptosis, a unique form of cell death, could affect the immune microenvironment in tumorigenesis and is a potential treatment target [30]. In our study, we studied the expression profiles of 18 FRGs in DLBCL and their relationship with OS by a comprehensive bioinformatics analysis. Then, we identified a characteristic 5-FRGs signature associated with the prognosis and progression of patients in DLBCL. Next, the new prognostic signature was validated using additional datasets. Furthermore, we performed functional enrichment analyses of genes related to 5-FRGs, revealing the roles of biological processes related to cellular interactions.
The five prognostic FRGs identified in this study were GOP1, GPX2, SLC7A5, ATF4, and CXCL2. Extensive research has demonstrated that FRGs are involved in tumorigenesis, including in DLBCL. GOP1 has been established as a multiple sclerosis-susceptibility gene [31, 32]. Single nucleotide polymorphisms in GOP1 are also associated with several autoimmune diseases, including type 1 diabetes [33, 34], Crohn’s disease [35], Addison’s disease [36], and rheumatoid arthritis [37]. GPX2, which encodes a glutathione peroxidase, acts a part in the malignant progression of many tumors, including breast cancer, KRAS-driven lung cancer, and bladder cancer [38, 39, 40, 41]. SLC7A5 activates mTORC1 on lysosomes and thereby induces leucine uptake in organelles [42]. This locus is therefore highly expressed in various tumor cells, which has been reported involved in the proliferation, growth, and survival of cells [43, 44] and promotes tumor growth [45]. ATF4 can regulate autophagy by promoting the transcriptional activation of some autophagy-related genes in DLBCL [46, 47]. CXCL2 is a hematoregulatory chemokine produced by activated immune cells, including monocytes an neutrophils; it is expressed in inflammation sites and suppresses hematopoietic progenitor cell proliferation in vitro [48]. Previous studies have proved that CXCL2 acted as a biomarker in bladder cancer [49] and affected cell proliferation and apoptosis in hepatic cellular cancer [50]. Beyond identification of this 5-FRGs signature, we demonstrated that the higher risk scores based on the FRG signature were correlated to a poor prognosis, with the ROC curve for 5-FRGs effectively predicting OS in DCBLC. Furthermore, we found that the risk score basis of 5-FRGs increased as the age of patients with DCBLC increased in the validation datasets, with no associations with sex or pathological class. Moreover, the independent prognostic value of the five FRGs and clinical parameters was established. Significant prognostic value was detected for a signature based on the age and risk score. Our study has given promising insights for the predictive value of the 5-FRGs. However, to validate the reliability of our results, more extensive multicenter clinical validation is required.
According to previous studies, ferroptosis is related to the immune system [51, 52]. To further assess the association between immune cells infiltration and 5-FRGs, we performed a ssGSEA of the affected gene clusters. ssGSEA scores for B lineage, T cells, and myeloid dendritic cells were significantly lower in the high-risk group than in the low-risk group. Numerous studies have illustrated the pivotal role that T cells play in the intricate immunotherapy, rendering them a crucial indicator of a patient’s response to chemotherapy. This enhancement of T cells is routinely associated with a significant increase in life expectance [53, 54, 55]. In view of the poor prognosis associated with the high-risk groups, we speculated that patients could have T cell failure and weakened anti-tumor immunity. We also noted that cells or functions related to immune activation, such as follicular helper cells and dendritic cells in the quiescent state, were reduced in the high-risk samples. These findings highlight the possibility that the 5-FRGs signature could be indirectly linked to certain aspects of immune function. In summary, while the 5-FRGs signature may not be a direct marker of immune function in DLBCL, the observed patterns of immune cell infiltration and gene expression differences related to immune-related functions suggest that there might be an underlying association. All in all, our data indicate that the 5-FRGs signature has an indirect impact on the immune functions of DLBCL, potentially influencing the disease’s behavior and patient prognosis through mechanisms that merit further investigation.
5.Conclusions
We developed a predictive signature based on five FRGs for DLBCL. This 5-FRGs signature is an independent prognostic factor and shows good predictive performance. We further showed that co-expressed genes with the FRGs were highly enriched in tumor-related pathways and were indirectly related to immune functions in DLBCL, indicating that immunotherapy may have an impact on DLBCL. The efficacy of corresponding drugs in DLBCL and the potential molecular mechanism underlying ferroptosis and tumor immunity require further research.
Data availability statement
The public datasets used in the study were obtained from FerrDb, http://www.zhounan.org/ferrdb, TCGA repository, https://portal.gdc/cancer.gov/ and GEO repository: https://www.ncbi.nlm.nih.gov/geo/.
Funding
This work was supported by the National Natural Science Foundation of China 81460036, 51962008.
Author contributions
WPL and RZY carried out the studies, participated in collecting data.and drafted the manuscript. NSY and WMZ performed the statistical analysis and participated in its design. All authors read and approved the final manuscript.
Acknowledgments
Not applicable
Conflict of interest
The author reports no conflicts of interest in this work.
References
[1] | P. Vodicka, P. Klener and M. Trneny, Diffuse Large B-Cell Lymphoma (DLBCL): Early patient management and emerging treatment options, Onco Targets Ther 15: ((2022) ), 1481–1501. |
[2] | H. Matsui, S.H. Randell, S.W. Peretti, C.W. Davis and R.C. Boucher, Coordinated clearance of periciliary liquid and mucus from airway surfaces, J Clin Invest 102: ((1998) ), 1125–1131. |
[3] | S. Dolma, S.L. Lessnick, W.C. Hahn and B.R. Stockwell, Identification of genotype-selective antitumor agents using synthetic lethal chemical screening in engineered human tumor cells, Cancer Cell 3: ((2003) ), 285–296. |
[4] | A.A. Alizadeh, M.B. Eisen, R.E. Davis, C. Ma, I.S. Lossos, A. Rosenwald, J.C. Boldrick, H. Sabet, T. Tran, X. Yu, J.I. Powell, L. Yang, G.E. Marti, T. Moore, J. Hudson Jr., L. Lu, D.B. Lewis, R. Tibshirani, G. Sherlock, W.C. Chan, T.C. Greiner, D.D. Weisenburger, J.O. Armitage, R. Warnke, R. Levy, W. Wilson, M.R. Grever, J.C. Byrd, D. Botstein, P.O. Brown and L.M. Staudt, Distinct types of diffuse large B-cell lymphoma identified by gene expression profiling, Nature 403: ((2000) ), 503–511. |
[5] | A. Rosenwald, G. Wright, W.C. Chan, J.M. Connors, E. Campo, R.I. Fisher, R.D. Gascoyne, H.K. Muller-Hermelink, E.B. Smeland, J.M. Giltnane, E.M. Hurt, H. Zhao, L. Averett, L. Yang, W.H. Wilson, E.S. Jaffe, R. Simon, R.D. Klausner, J. Powell, P.L. Duffey, D.L. Longo, T.C. Greiner, D.D. Weisenburger, W.G. Sanger, B.J. Dave, J.C. Lynch, J. Vose, J.O. Armitage, E. Montserrat, A. López-Guillermo, T.M. Grogan, T.P. Miller, M. LeBlanc, G. Ott, S. Kvaloy, J. Delabie, H. Holte, P. Krajci, T. Stokke and L.M. Staudt, The use of molecular profiling to predict survival after chemotherapy for diffuse large-B-cell lymphoma, N Engl J Med 346: ((2002) ), 1937–1947. |
[6] | M. Crump, S.S. Neelapu, U. Farooq, E. Van Den Neste, J. Kuruvilla, J. Westin, B.K. Link, A. Hay, J.R. Cerhan, L. Zhu, S. Boussetta, L. Feng, M.J. Maurer, L. Navale, J. Wiezorek, W.Y. Go and C. Gisselbrecht, Outcomes in refractory diffuse large B-cell lymphoma: Results from the international SCHOLAR-1 study, Blood 130: ((2017) ), 1800–1808. |
[7] | W. Zheng, Q. Lin, M.A. Issah, Z. Liao and J. Shen, Identification of PLA2G7 as a novel biomarker of diffuse large B cell lymphoma, BMC Cancer 21: ((2021) ), 927. |
[8] | A. Rosenwald, S. Bens, R. Advani, S. Barrans, C. Copie-Bergman, M.H. Elsensohn, Y. Natkunam, M. Calaminici, B. Sander, M. Baia, A. Smith, D. Painter, L. Pham, S. Zhao, M. Ziepert, E.S. Jordanova, T.J. Molina, M.J. Kersten, E. Kimby, W. Klapper, J. Raemaekers, N. Schmitz, F. Jardin, W.B.C. Stevens, E. Hoster, A. Hagenbeek, J.G. Gribben, R. Siebert, R.D. Gascoyne, D.W. Scott, P. Gaulard, G. Salles, C. Burton, D. de Jong, L.H. Sehn and D. Maucort-Boulch, Prognostic Significance of MYC Rearrangement and Translocation Partner in Diffuse Large B-Cell Lymphoma: A study by the lunenburg lymphoma biomarker consortium, J Clin Oncol 37: ((2019) ), 3359–3368. |
[9] | N. Lodhi, M. Tun, P. Nagpal, A.A. Inamdar, N.M. Ayoub, N. Siyam, L. Oton-Gonzalez, A. Gerona, D. Morris, R. Sandhu and K.S. Suh, Biomarkers and novel therapeutic approaches for diffuse large B-cell lymphoma in the era of precision medicine, Oncotarget 11: ((2020) ), 4045–4073. |
[10] | M. Gao, P. Monian and X. Jiang, Metabolism and iron signaling in ferroptotic cell death, Oncotarget 6: ((2015) ), 35145–31546. |
[11] | S.J. Dixon, K.M. Lemberg, M.R. Lamprecht, R. Skouta, E.M. Zaitsev, C.E. Gleason, D.N. Patel, A.J. Bauer, A.M. Cantley, W.S. Yang, B. Morrison 3rd and B.R. Stockwell, Ferroptosis: An iron-dependent form of nonapoptotic cell death, Cell 149: ((2012) ), 1060–1072. |
[12] | J.Y. Cao and S.J. Dixon, Mechanisms of ferroptosis, Cell Mol Life Sci 73: ((2016) ), 2195–2209. |
[13] | W.S. Yang, R. SriRamaratnam, M.E. Welsch, K. Shimada, R. Skouta, V.S. Viswanathan, J.H. Cheah, P.A. Clemons, A.F. Shamji, C.B. Clish, L.M. Brown, A.W. Girotti, V.W. Cornish, S.L. Schreiber and B.R. Stockwell, Regulation of ferroptotic cancer cell death by GPX4, Cell 156: ((2014) ), 317–331. |
[14] | S.E. Kim, L. Zhang, K. Ma, M. Riegman, F. Chen, I. Ingold, M. Conrad, M.Z. Turker, M. Gao, X. Jiang, S. Monette, M. Pauliah, M. Gonen, P. Zanzonico, T. Quinn, U. Wiesner, M.S. Bradbury and M. Overholtzer, Ultrasmall nanoparticles induce ferroptosis in nutrient-deprived cancer cells and suppress tumour growth, Nat Nanotechnol 11: ((2016) ), 977–985. |
[15] | C. Zhang, X. Liu, S. Jin, Y. Chen and R. Guo, Ferroptosis in cancer therapy: A novel approach to reversing drug resistance, Mol Cancer 21: ((2022) ), 47. |
[16] | L. Zhao, X. Zhou, F. Xie, L. Zhang, H. Yan, J. Huang, C. Zhang, F. Zhou, J. Chen and L. Zhang, Ferroptosis in cancer and cancer immunotherapy, Cancer Commun (Lond) 42: ((2022) ), 88–116. |
[17] | K. Bersuker, J.M. Hendricks, Z. Li, L. Magtanong, B. Ford, P.H. Tang, M.A. Roberts, B. Tong, T.J. Maimone, R. Zoncu, M.C. Bassik, D.K. Nomura, S.J. Dixon and J.A. Olzmann, The CoQ oxidoreductase FSP1 acts parallel to GPX4 to inhibit ferroptosis, Nature 575: ((2019) ), 688–692. |
[18] | R. Xiao, S. Wang, J. Guo, S. Liu, A. Ding, G. Wang, W. Li, Y. Zhang, X. Bian, S. Zhao and W. Qiu, Ferroptosis-related gene NOX4, CHAC1 and HIF1A are valid biomarkers for stomach adenocarcinoma, J Cell Mol Med 26: ((2022) ), 1183–1193. |
[19] | H. Chen, Y. He, T. Pan, R. Zeng, Y. Li, S. Chen, Y. Li, L. Xiao and H. Zhou, Ferroptosis-related gene signature: A New Method for Personalized Risk Assessment in Patients with Diffuse Large B-Cell Lymphoma, Pharmgenomics Pers Med 14: ((2021) ), 609–619. |
[20] | N. Zhou and L. Busino, Targeting epigenetics and ferroptosis in DLBCL, Blood 142: ((2023) ), 1108–1109. |
[21] | Q. Zhou, T. Li, Q. Qin, X. Huang and Y. Wang, Ferroptosis in lymphoma: Emerging mechanisms and a novel therapeutic approach, Front Genet 13: ((2022) ), 1039951. |
[22] | S.L. Barrans, S. Crouch, M.A. Care, L. Worrillow, A. Smith, R. Patmore, D.R. Westhead, R. Tooze, E. Roman and A.S. Jack, Whole genome expression profiling based on paraffin embedded tissue can be used to classify diffuse large B-cell lymphoma and predict clinical outcome, Br J Haematol 159: ((2012) ), 441–453. |
[23] | S. Doll, F.P. Freitas, R. Shah, M. Aldrovandi, M.C. da Silva, I. Ingold, A. Goya Grocin, T.N. Xavier da Silva, E. Panzilius, C.H. Scheel, A. Mourão, K. Buday, M. Sato, J. Wanninger, T. Vignane, V. Mohana, M. Rehberg, A. Flatley, A. Schepers, A. Kurz, D. White, M. Sauer, M. Sattler, E.W. Tate, W. Schmitz, A. Schulze, V. O’Donnell, B. Proneth, G.M. Popowicz, D.A. Pratt, J.P.F. Angeli and M. Conrad, FSP1 is a glutathione-independent ferroptosis suppressor, Nature 575: ((2019) ), 693–698. |
[24] | L.F. Ye and B.R. Stockwell, Transforming lipoxygenases: PE-specific enzymes in disguise, Cell 171: ((2017) ), 501–502. |
[25] | R. Tibshirani, J. Bien, J. Friedman, T. Hastie, N. Simon, J. Taylor and R.J. Tibshirani, Strong rules for discarding predictors in lasso-type problems, J R Stat Soc Series B Stat Methodol 74: ((2012) ), 245–266. |
[26] | Z. Chen, T. Wu, Z. Yan and M. Zhang, Identification and validation of an 11-ferroptosis related gene signature and its correlation with immune checkpoint molecules in glioma, Front Cell Dev Biol 9: ((2021) ), 652599. |
[27] | G. Yu, L.G. Wang, Y. Han and Q.Y. He, clusterProfiler: An R package for comparing biological themes among gene clusters, Omics 16: ((2012) ), 284–287. |
[28] | S. Hänzelmann, R. Castelo and J. Guinney, GSVA: Gene set variation analysis for microarray and RNA-seq data, BMC Bioinformatics 14: ((2013) ), 7. |
[29] | O. Gusyatiner and M.E. Hegi, Glioma epigenetics: From subclassification to novel treatment options, Semin Cancer Biol 51: ((2018) ), 50–58. |
[30] | L. Yang, L. Bi, Z. Lei, Y. Miao, B. Li, T. Liu and W. Wu, Preparation of amidoxime-functionalized β-cyclodextrin-graft-(maleic anhydride-co-acrylonitrule) copolymer and evaluation of the adsorption and regeneration properties of uranium, Polymers (Basel) 10: ((2018) ). |
[31] | Genome-wide association study identifies new multiple sclerosis susceptibility loci on chromosomes 12 and 20, Nat Genet 41: ((2009) ), 824–828. |
[32] | A.H. Beecham, N.A. Patsopoulos, D.K. Xifara, M.F. Davis, A. Kemppinen, C. Cotsapas, T.S. Shah, C. Spencer, D. Booth, A. Goris, A. Oturai, J. Saarela, B. Fontaine, B. Hemmer, C. Martin, F. Zipp, S. D’Alfonso, F. Martinelli-Boneschi, B. Taylor, H.F. Harbo, I. Kockum, J. Hillert, T. Olsson, M. Ban, J.R. Oksenberg, R. Hintzen, L.F. Barcellos, C. Agliardi, L. Alfredsson, M. Alizadeh, C. Anderson, R. Andrews, H.B. Søndergaard, A. Baker, G. Band and S.E. Baranzini, Analysis of immune-related loci identifies 48 new susceptibility variants for multiple sclerosis, Nat Genet 45: ((2013) ), 1353–1360. |
[33] | M. Zoledziewska, G. Costa, M. Pitzalis, E. Cocco, C. Melis, L. Moi, P. Zavattari, R. Murru, R. Lampis, L. Morelli, F. Poddie, P. Frongia, P. Pusceddu, M. Bajorek, A. Marras, A.M. Satta, A. Chessa, M. Pugliatti, S. Sotgiu, M.B. Whalen, G. Rosati, F. Cucca and M.G. Marrosu, Variation within the CLEC16A gene shows consistent disease association with both multiple sclerosis and type 1 diabetes in Sardinia, Genes Immun 10: ((2009) ), 15–17. |
[34] | J.A. Todd, N.M. Walker, J.D. Cooper, D.J. Smyth, K. Downes, V. Plagnol, R. Bailey, S. Nejentsev, S.F. Field, F. Payne, C.E. Lowe, J.S. Szeszko, J.P. Hafler, L. Zeitels, J.H. Yang, A. Vella, S. Nutland, H.E. Stevens, H. Schuilenburg, G. Coleman, M. Maisuria, W. Meadows, L.J. Smink, B. Healy, O.S. Burren, A.A. Lam, N.R. Ovington, J. Allen, E. Adlem, H.T. Leung, C. Wallace, J.M. Howson, C. Guja, C. Ionescu-Tîrgovişte, M.J. Simmonds, J.M. Heward, S.C. Gough, D.B. Dunger, L.S. Wicker and D.G. Clayton, Robust associations of four new chromosome regions from genome-wide analyses of type 1 diabetes, Nat Genet 39: ((2007) ), 857–864. |
[35] | A. Márquez, J. Varadé, G. Robledo, A. Martínez, J.L. Mendoza, C. Taxonera, M. Fernández-Arquero, M. Díaz-Rubio, M. Gómez-García, M.A. López-Nevot, E.G. de la Concha, J. Martín and E. Urcelay, Specific association of a CLEC16A/KIAA0350 polymorphism with NOD2/CARD15(-) Crohn’s disease patients, Eur J Hum Genet 17: ((2009) ), 1304–1308. |
[36] | B. Skinningsrud, E.S. Husebye, S.H. Pearce, D.O. McDonald, K. Brandal, A.B. Wolff, K. Løvås, T. Egeland and D.E. Undlien, Polymorphisms in CLEC16A and CIITA at 16p13 are associated with primary adrenal insufficiency, J Clin Endocrinol Metab 93: ((2008) ), 3310–3317. |
[37] | A. Martínez, N. Perdigones, M.C. Cénit, L. Espino, J. Varadé, J.R. Lamas, J.L. Santiago, M. Fernández-Arquero, H. de la Calle, R. Arroyo, E.G. de la Concha, B. Fernández-Gutiérrez and E. Urcelay, Chromosomal region 16p13: Further evidence of increased predisposition to immune diseases, Ann Rheum Dis 69: ((2010) ), 309–311. |
[38] | F. Li, L. Dai and J. Niu, GPX2 silencing relieves epithelial-mesenchymal transition, invasion, and metastasis in pancreatic cancer by downregulating Wnt pathway, J Cell Physiol 235: ((2020) ), 7780–7790. |
[39] | A. Minato, H. Noguchi, R. Ohnishi, I. Tomisaki, T. Nakayama and N. Fujimoto, Reduced expression level of GPX2 in T1 bladder cancer and its role in early-phase invasion of bladder cancer, In Vivo 35: ((2021) ), 753–759. |
[40] | Z. Ren, H. Liang, P.M. Galbo Jr., M. Dharmaratne, A.S. Kulkarni, A.T. Fard and M.L. Aoun, Redox signaling by glutathione peroxidase 2 links vascular modulation to metabolic plasticity of breast cancer, Proc Natl Acad Sci U S A 119: ((2022) ). |
[41] | M. Wang, X. Chen, G. Fu and M. Ge, Glutathione peroxidase 2 overexpression promotes malignant progression and cisplatin resistance of KRAS-mutated lung cancer cells, Oncol Rep 48: ((2022) ). |
[42] | R. Milkereit, A. Persaud, L. Vanoaica, A. Guetg, F. Verrey and D. Rotin, LAPTM4b recruits the LAT1-4F2hc Leu transporter to lysosomes and promotes mTORC1 activation, Nat Commun 6: ((2015) ), 7250. |
[43] | M. Galluccio, P. Pingitore, M. Scalise and C. Indiveri, Cloning, large scale over-expression in E. coli and purification of the components of the human LAT 1 (SLC7A5) amino acid transporter, Protein J 32: ((2013) ), 442–448. |
[44] | K. Voss, H.S. Hong, J.E. Bader, A. Sugiura, C.A. Lyssiotis and J.C. Rathmell, A guide to interrogating immunometabolism, Nat Rev Immunol 21: ((2021) ), 637–652. |
[45] | Q. Wang and J. Holst, L-type amino acid transport and cancer: Targeting the mTORC1 pathway to inhibit neoplasia, Am J Cancer Res 5: ((2015) ), 1281–1294. |
[46] | W. B’Chir, A.C. Maurin, V. Carraro, J. Averous, C. Jousse, Y. Muranishi, L. Parry, G. Stepien, P. Fafournoux and A. Bruhat, The eIF2α/ATF4 pathway is essential for stress-induced autophagy gene expression, Nucleic Acids Res 41: ((2013) ), 7683–7699. |
[47] | M. Li, M.R. Teater, J.Y. Hong, N.R. Park, C. Duy, H. Shen, L. Wang, Z. Chen, L. Cerchietti, S.M. Davidson, H. Lin and A.M. Melnick, Translational activation of ATF4 through mitochondrial anaplerotic metabolic pathways is required for DLBCL growth and survival, Blood Cancer Discov 3: ((2022) ), 50–65. |
[48] | A.G. King, K. Johanson, C.L. Frey, P.L. DeMarsh, J.R. White, P. McDevitt, D. McNulty, J. Balcarek, Z.L. Jonak, P.K. Bhatnagar and L.M. Pelus, Identification of unique truncated KC/GRO beta chemokines with potent hematopoietic and anti-infective activities, J Immunol 164: ((2000) ), 3774–3782. |
[49] | H. Zhang, Y.L. Ye, M.X. Li, S.B. Ye, W.R. Huang, T.T. Cai, J. He, J.Y. Peng, T.H. Duan, J. Cui, X.S. Zhang, F.J. Zhou, R.F. Wang and J. Li, CXCL2/MIF-CXCR2 signaling promotes the recruitment of myeloid-derived suppressor cells and is correlated with prognosis in bladder cancer, Oncogene 36: ((2017) ), 2095–2104. |
[50] | J. Ding, K. Xu, J. Zhang, B. Lin, Y. Wang, S. Yin, H. Xie, L. Zhou and S. Zheng, Overexpression of CXCL2 inhibits cell proliferation and promotes apoptosis in hepatocellular carcinoma, BMB Rep 51: ((2018) ), 630–635. |
[51] | R. Tang, J. Xu, B. Zhang, J. Liu, C. Liang, J. Hua, Q. Meng, X. Yu and S. Shi, Ferroptosis, necroptosis, and pyroptosis in anticancer immunity, J Hematol Oncol 13: ((2020) ), 110. |
[52] | Y. Weijiao, L. Fuchun, C. Mengjie, Q. Xiaoqing, L. Hao, L. Yuan and Y. Desheng, Immune infiltration and a ferroptosis-associated gene signature for predicting the prognosis of patients with endometrial cancer, Aging (Albany NY) 13: ((2021) ), 16713–16732. |
[53] | P. Autissier, C. Soulas, T.H. Burdo and K.C. Williams, Evaluation of a 12-color flow cytometry panel to study lymphocyte, monocyte, and dendritic cell subsets in humans, Cytometry A 77: ((2010) ), 410–419. |
[54] | M.D. Sharma, R. Pacholczyk, H. Shi, Z.J. Berrong, Y. Zakharia, A. Greco, C.S. Chang, S. Eathiraj, E. Kennedy, T. Cash, R.J. Bollag, R. Kolhe, R. Sadek, T.L. McGaha, P. Rodriguez, J. Mandula, B.R. Blazar, T.S. Johnson and D.H. Munn, Inhibition of the BTK-IDO-mTOR axis promotes differentiation of monocyte-lineage dendritic cells and enhances anti-tumor T cell immunity, Immunity 54: ((2021) ), 2354–2371e8.. |
[55] | M. St Paul, S.D. Saibil, S.C. Lien, S. Han, A. Sayad, D.T. Mulder, C.R. Garcia-Batres, A.R. Elford, K. Israni-Winger, C. Robert-Tissot, M. Zon, S.R. Katz, P.A. Shaw, B.A. Clarke, M.Q. Bernardini, L.T. Nguyen, B. Haibe-Kains, T.J. Pugh and P.S. Ohashi, IL6 induces an IL22(+) CD8(+) T-cell subset with potent antitumor function, Cancer Immunol Res 8: ((2020) ), 321–333. |


