
miRNA profiling of esophageal adenocarcinoma using transcriptome analysis
Abstract
Esophageal adenocarcinoma (EAC) occurs following a series of histological changes through epithelial-mesenchymal transition (EMT). A variable expression of normal and aberrant genes in the tissue can contribute to the development of EAC through the activation or inhibition of critical molecular signaling pathways. Gene expression is regulated by various regulatory factors, including transcription factors and microRNAs (miRs). The exact profile of miRs associated with the pathogenesis of EAC is largely unknown, though some candidate miRNAs have been reported in the literature. To identify the unique miR profile associated with EAC, we compared normal esophageal tissue to EAC tissue using bulk RNA sequencing. RNA sequence data was verified using qPCR of 18 selected genes. Fourteen were confirmed as being upregulated, which include CDH11, PCOLCE, SULF1, GJA4, LUM, CDH6, GNA12, F2RL2, CTSZ, TYROBP, and KDELR3 as well as the downregulation of UGT1A1. We then conducted Ingenuity Pathway Analysis (IPA) to analyze for novel miR-gene relationships through Causal Network Analysis and Upstream Regulator Analysis. We identified 46 miRs that were aberrantly expressed in EAC compared to control tissues. In EAC tissues, seven miRs were associated with activated networks, while 39 miRs were associated with inhibited networks. The miR-gene relationships identified provide novel insights into potentially oncogenic molecular pathways and genes associated with carcinogenesis in esophageal tissue. Our results revealed a distinct miR profile associated with dysregulated genes. The miRs and genes identified in this study may be used in the future as biomarkers and serve as potential therapeutic targets in EAC.
1.Background
Esophageal cancer is the eighth most common cancer and represents the sixth most common cause of cancer mortality globally [1, 2]. In the United States, The American Cancer Society estimates about 21,560 new diagnoses and 16,120 deaths related to esophageal cancer in 2023, each with a male predominance [3]. Approximately 10% of esophageal cancers in Western countries are identified to be esophageal adenocarcinoma (EAC). Further, the incidence of EAC has increased each decade from 1973 to 2015 in the United States, possibly due to the increasing prevalence of EAC risk factors, including obesity and GERD [4]. As incidence increases, the 5-year survival rate remains poor at around 20%, reflecting a need for the development of markers for early diagnosis and better treatment and prevention strategies [5, 6, 7]. For these reasons, it is essential to identify novel biomarkers and potential therapeutic targets.
Dysregulation of gene transcription has been identified as a critical mechanism underlying cancer pathophysiology [8]. One way that gene transcription is regulated is through microRNA (miR) [9, 10]. miRs are highly conserved, single-stranded RNA molecules averaging 22 nucleotides in length that regulate gene expression by binding target messenger RNA (mRNA). In general, miR-mRNA binding suppresses the mRNA molecule’s translation and/or degradation, leading to increased or decreased expression of certain genes [11, 12]. miRs may therefore possess either tumor-promoting (onco-miR) or suppressing activity based on the deactivated target mRNA [11]. Dysregulated miRs have been associated with many cancer phenotypes and implicated in a variety of dysregulated cellular pathways and mechanisms, including in EAC [13, 14, 15, 16]. While not all dysregulated genes and molecular pathways lead consistently to carcinogenesis, a variety of mechanisms have been described in EAC development [17]. Furthermore, relatively few miRs have been reported to be associated with EAC, which necessitates further investigation into possible miRs associated with EAC development [18, 19, 20, 21, 22].
2.Objective
This study aims to identify novel miRs associated with EAC and their potential gene targets.
3.Methods
3.1Patient selection
The protocol for this prospective study was approved by the Institutional Review Board (IRB# 1194896) of Creighton University. All patients undergoing primary endoscopic biopsy or surgical resection of suspected EAC were considered for inclusion in this study. A written informed consent was obtained from all patients scheduled for surgery at Creighton University Medical Center. For this study,
3.2Tissue collection and processing
The EAC and normal tissue collected during surgical endoscopy or resection were transported to the lab the same day at 4∘C and processed for total RNA isolation. Total RNA was isolated using TRI reagent (TRIzol™ Reagent, Sigma, Catalog #T9424, St. Louis, Missouri, USA) following the manufacturer’s guidelines. Total RNA yield was measured using NanoDrop One (Thermo Fisher Scientific Inc.) and 1
3.3Bulk RNA sequencing and analysis
We conducted bulk RNA sequencing on 4 EAC and 4 normal esophageal mucosa samples. Genetic analysis and statistical inference were performed at The University of Nebraska Medical Center (UNMC) using the following protocol: The original fastq format reads were trimmed by the fqtrim tool (https://ccb.jhu.edu/software/ fqtrim) to remove adapters, terminal unknown bases (Ns), and low quality 3’ regions (Phred score
3.4Identification of differentially expressed genes (DEGs)
Genes were filtered using
3.5Ingenuity pathway analysis
To investigate the potentially novel miR-gene interactions associated with the DEGs identified through bulk RNA sequencing, we conducted Ingenuity Pathway Analysis (IPA). IPA is a bioinformatic analysis platform created by QIAGEN Inc. that predicts functional relationships among sets of genes. Within IPA, we further utilized Causal Network and Upstream Regulator Analyses. (QIAGEN Inc. https://digitalinsights.qiagen. com/products-overview/discovery-insights-portfolio/analysis-and-visualization/qiagen-ipa/). These analytical tools allow for exploration beyond direct relationships and provide insight into potential physiologic mechanisms that are associated with target datasets. Causal Network Analysis uses experimental data to predict regulatory species, including miRs and transcription factors that are not directly connected to DEGs. Upstream Regulator Analysis predicts regulatory molecules that influence the observed genotype associated with input data through either upstream or downstream changes to gene transcription. Both analysis methods may provide novel insight into pathophysiologic mechanisms that control the development of EAC that might not be readily apparent in a set of differentially expressed genes. microRNAs and their associated gene targets were obtained through IPA. Disease and biologic function analysis of IPA is included in Supplemental File 1.
3.6Protein-protein interaction, functional enrichment, and identification of hub genes
Functional relationship analysis for the DEGs was conducted using the Search Tool for Retrieval of Interacting Genes (STRING), accessed through (http://string-db.org). STRING is a web-based database that can predict relationships between input genes to create protein-protein interaction (PPI) networks. Our network was constructed using a confidence of interaction score
To further narrow the focus of our investigation, we identified genes involved in the top 10 enriched Gene Ontology (GO) Biological Processes (Table 2). GO Term false discovery rate
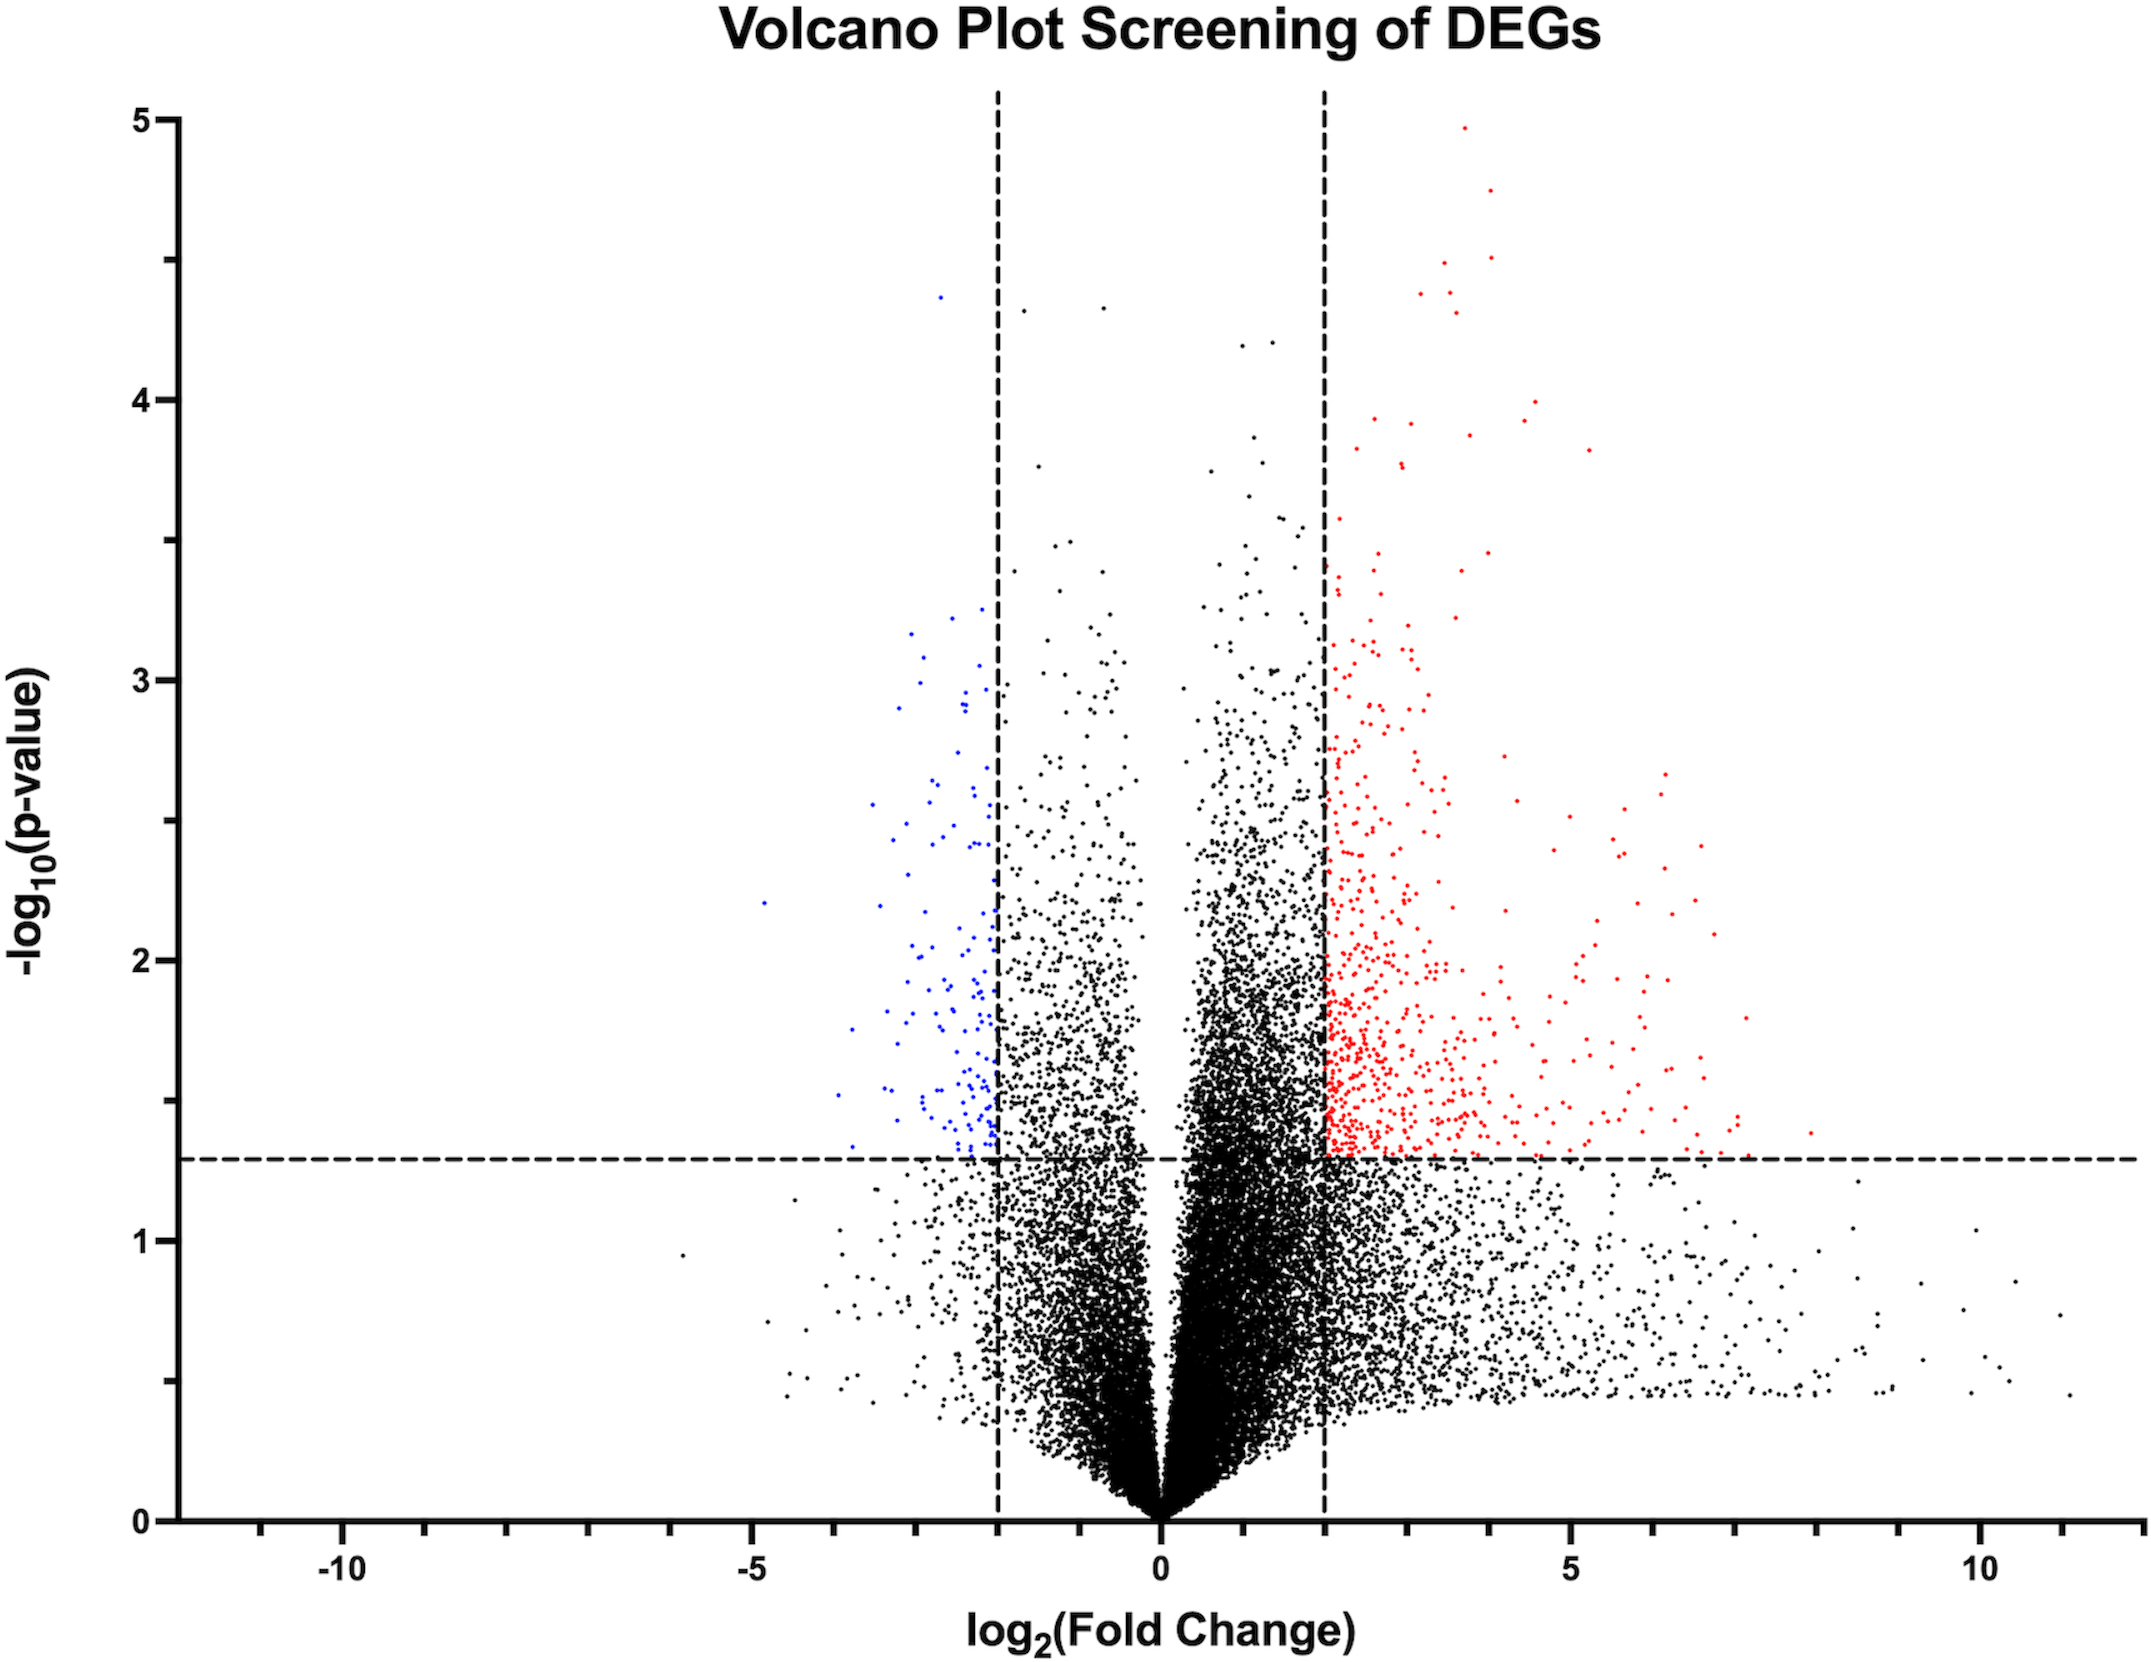
Figure 1.
Volcano plot visual representation of filtering out candidate DEGs from RNA sequence data using
Hub genes demonstrate high connectivity in PPI networks and can help identify genes that play critical roles in underlying network pathways [27]. Therefore, identifying hub genes may provide insight into meaningful biological mechanisms involved in PPI networks and assist in clarifying the importance of an underlying gene in disease development. We used the Cytoscape plugin cytoHubba [28] to identify hub genes within our PPI. Within cytoHubba, we conducted hub analysis to determine the 20 top hub genes using five commonly used embedded algorithms, which include Maximal Clique Centrality (MCC), Maximum Neighborhood Component (MNC), Density of Maximum Neighborhood Component (DMNC), Degree method (Degree), and Edge Percolated Component (EPC) [29]. We further conducted Molecular Complex Detection (MCODE) within Cytoscape, a separate Cytoscape plugin that assists in identifying highly connected hub genes in large PPIs [30]. MCODE was analyzed using a Network Scoring degree cutoff of 2, and cluster finding was set to ‘haircut’ utilizing a node score cutoff of 0.2, K-Core of 2, and a maximum depth of 100. MCODE output modules were considered significant with a k-score
3.7qPCR of DEGs for RNA sequencing validation
To verify the data identified with RNA sequencing, qPCR (real-time polymerase chain reaction) was used to quantify the expression of 18 DEGs identified through IPA analysis. 13 previously unreported DEGs (PCOLCE, CDH11, GJA4, PTGFR, CDH6, LUM, GNA12, SULF1, CDC14B, KDELR3, TYROBP, UGT1A1, and F2RL2) were selected based on literature review into each gene’s known functional relationships related to mechanisms involved in EAC risk and development, including inflammatory signaling, cellular organization, and mechanisms involved in insulin signaling. The remaining five genes (FOXF1, IGFBP7, CTRHC1, HEYL, and NFATC2) have been previously characterized in relation to EAC and were analyzed for additional validation. Of the selected genes, seven were identified as highly connected hubs and therefore serve as potentially important targets for future research: PCOLCE, CDH11, GJA4, PTGFR, CDH6, LUM, SULF1, and TYROBP).
Total RNA was extracted using the TRIZOL method (T9424, Millipore Sigma, Burlington, Massachusetts, USA) following standard protocol in our laboratory. The yield of total RNA was quantified using Nanodrop 2000 Spectrophotometer (Thermo Fisher Scientific, Waltham, Massachusetts, USA). Following this, 2
Table 1
Primer sequences used to preform qPCR on selected DEGs detected using RNA sequencing analysis
| Gene Name | Symbol | Sequence 5’ | Sequence 5’ |
|---|---|---|---|
| Cadherin 11 | CDH11 | TGGCAGCAAGTATCCAATGG | TTTGGTTACGTGGTAGGCAC |
| Procollagen C-endopeptidase enhancer 1 | PCOLCE | GTGCGGAGGGGATGTGAAG | CGAAGACTCGGAATGAGAGGG |
| Sulfatase 1 | SULF1 | GGACGGATACAGCAGGAACG | CAGCACATGGGTGTAGTCACA |
| Gap junction alpha-4 protein | GJA4 | TGCAAGAGTGTGCTAGAGGC | ACAAAGCAGTCCACGAGGTAG |
| Lumican | LUM | TAACTGCCCTGAAAGCTACCC | GGAGGCACCATTGGTACACTT |
| Cadherin 6 | CDH6 | AGAACTTACCGCTACTTCTTGC | TGCCCACATACTGATAATCGGA |
| Guanine nucleotide-binding protein subunit alpha-12 | GNA12 | GGAGGGATTCTGGCATCAGG | CCGATCCGGTCCAAGTTGTC |
| Prostaglandin F2-alpha receptor | PTGFR | AAGTCCAAGGCATCGTTTCTG | TGACTCCAATACACCGCTCAAT |
| Guanylate cyclase 1, soluble, alpha 3 | GUCY1A1 | GGGACCAGATTAGATGGTGTACTTGG | CCCATCATGCTGTTCCATTGTG |
| Coagulation factor II (thrombin) receptor-like 2 | F2RL2 | GCAAAGCCAACCTTACCCATT | GAGGTAGATGGCAGGTATCAGT |
| Cathepsin Z | CTSZ | GTGCAGAACGTCATCGACTG | TTGCAGGTCTCGTCAGGGA |
| TYRO protein tyrosine kinase-binding protein | TYROBP | ACTGAGACCGAGTCGCCTTAT | ATACGGCCTCTGTGTGTTGAG |
| Dual specificity protein phosphatase CDC14B | CDC14B | GCCATTCTCTACAGCAGACCA | TGTAAACCATTGCCAGATTGAGT |
| ER lumen protein-retaining receptor 3 | KDELR3 | TCCCAGTCATTGGCCTTTCC | CCAGTTAGCCAGGTAGAGTGC |
| UDP glucuronosyltransferase family 1 member A1 | UGT1A1 | TTGTCTGGCTGTTCCCACTTA | GGTCCGTCAGCATGACATCA |
| Insulin-like growth factor-binding protein 7 | IGFBP7 | CGAGCAAGGTCCTTCCATAGT | GGTGTCGGGATTCCGATGAC |
| Forkhead box protein F1 | FOXF1 | CCCAGCATGTGTGACCGAAA | ATCACGCAAGGCTTGATGTCT |
| Collagen triple helix repeat-containing protein 1 | CTHRC1 | CAATGGCATTCCGGGTACAC | GTACACTCCGCAATTTTCCCAA |
| Nuclear factor of activated T-cells, cytoplasmic 2 | NFATC2 | GAGCCGAATGCACATAAGGTC | CCAGAGAGACTAGCAAGGGG |
| Hairy/enhancer-of-split related with YRPW motif-like protein | HEYL | GGAAGAAACGCAGAGGGATCA | CAAGCGTCGCAATTCAGAAAG |
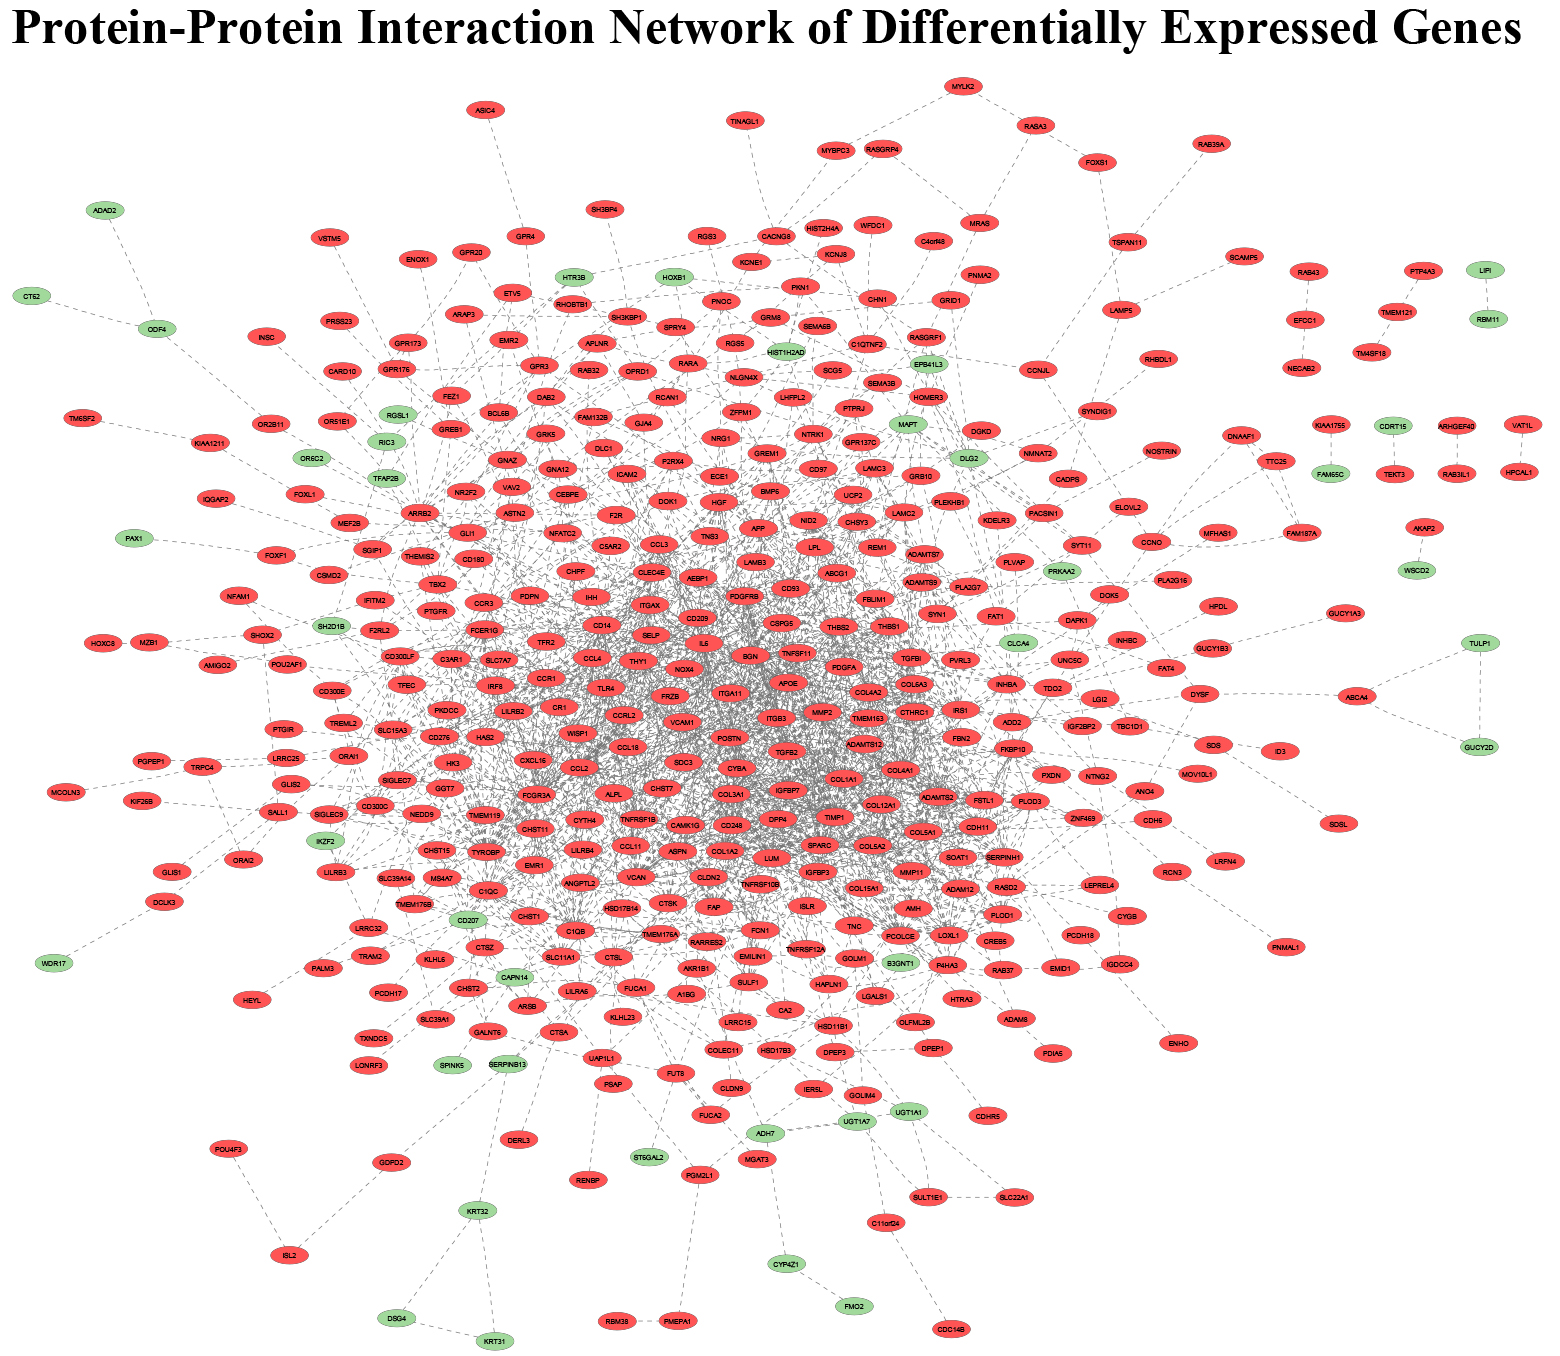
Figure 2.
PPI among DEGs identified using RNA-sequencing analysis (Red-Upregulated DEG; Green-Downregulated DEG; Grey line-Predicted connection between adjacent genes).
4.Results
4.1RNA sequencing and differentially expressed genes
RNA sequencing data revealed a total of 58,826 detected genes. Of these, 784 genes met our criteria for significantly upregulated or downregulated (
4.2Protein-protein interaction
A protein-protein interaction map of the 588 DEGs was created using STRING that included 526 mappable nodes and displayed 2085 edges (expected number of edges
4.3Gene enrichment
GO Biological Process enrichment of the obtained PPI network revealed 156 significantly overrepresented genes from pathways involved in cell adhesion, collagen fibril organization/biosynthesis, inflammatory response, ECM organization, cell migration, positive regulation of ERK1/2 cascade, osteoblast differentiation, and cell-to-cell signaling (Table 2). The top 10 GO Terms were ranked by significance using -log10(p-value) and are displayed in Fig. 3. The 156 genes found within each of the top 10 most significantly enriched GO Terms are mapped in Fig. 4A and B.
Table 2
Top 10 enriched GO Terms Biological Process used to filter genes into relevant biological processes pertaining to EAC
| Top 10 Gene Ontology Terms Used for miR-Gene Inference | |||
|---|---|---|---|
| Accession ID | Gene Ontology Term | # of DEGs | |
| GO:0007155 | Cell adhesion | 3.30E-26 | 67 |
| GO:0030199 | Collagen fibril organization | 1.10E-16 | 22 |
| GO:0006954 | Inflammatory response | 2.10E-10 | 37 |
| GO:0030198 | Extracellular matrix organization | 2.70E-10 | 24 |
| GO:0032964 | Collagen biosynthetic process | 4.50E-08 | 7 |
| GO:0016477 | Cell migration | 1.20E-07 | 25 |
| GO:0070374 | Positive regulation of ERK1 and ERK2 cascade | 9.80E-07 | 21 |
| GO:0030335 | Positive regulation of cell migration | 2.80E-06 | 22 |
| GO:0001649 | Osteoblast differentiation | 3.50E-06 | 15 |
| GO:0007267 | Cell-cell signaling | 5.40E-06 | 20 |
Figure 3.
Top 10 enriched GO Terms Biological Process used to filter genes into relevant biological processes pertaining to EAC.
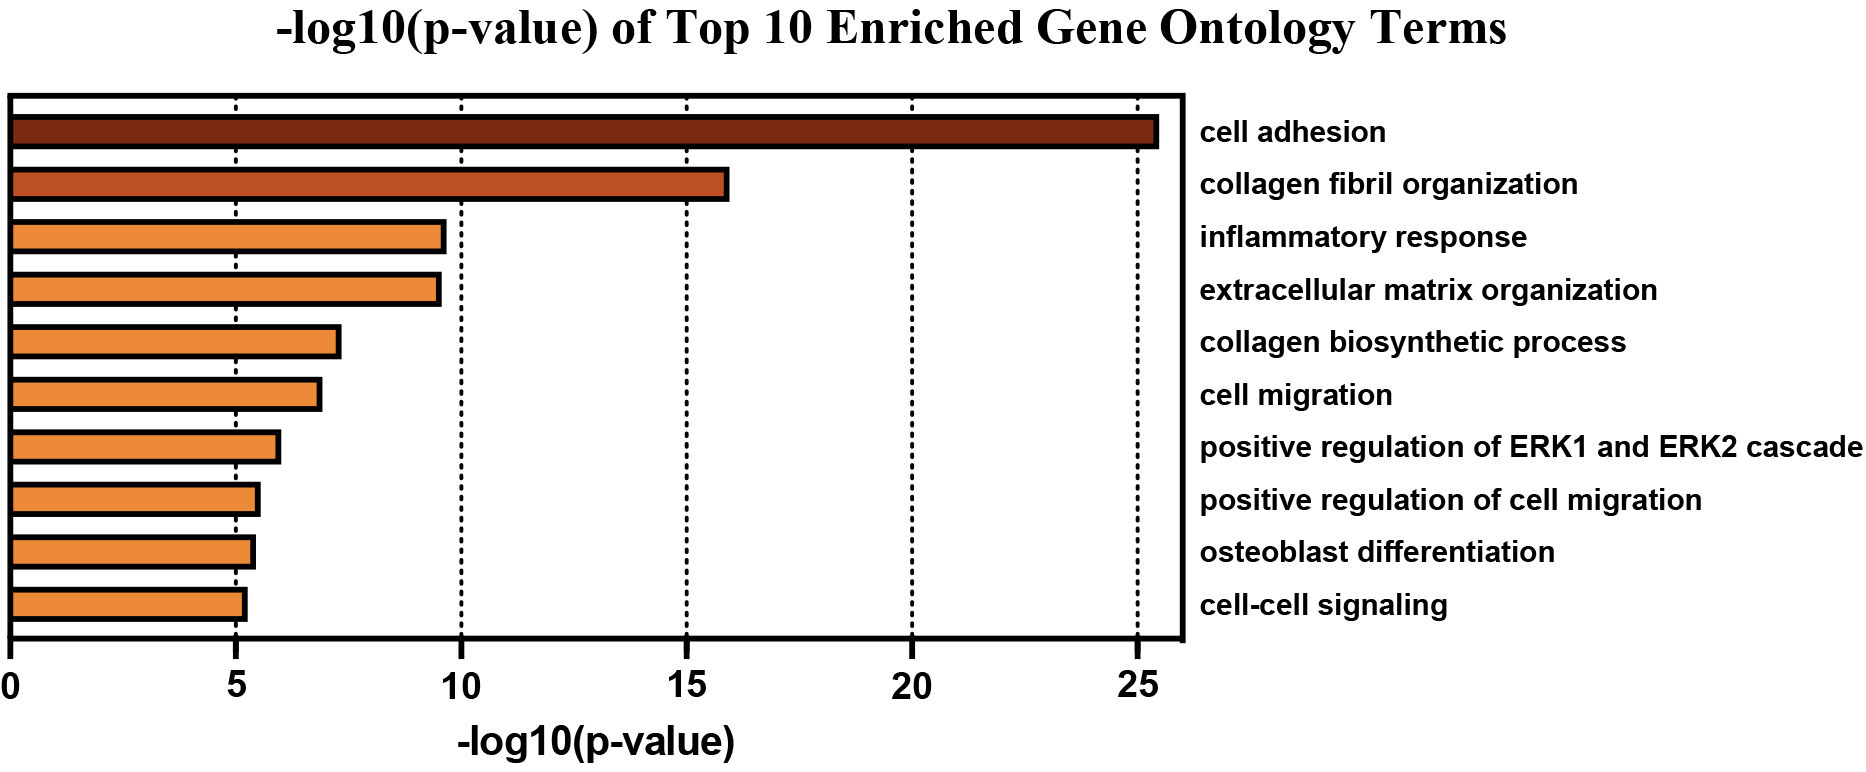
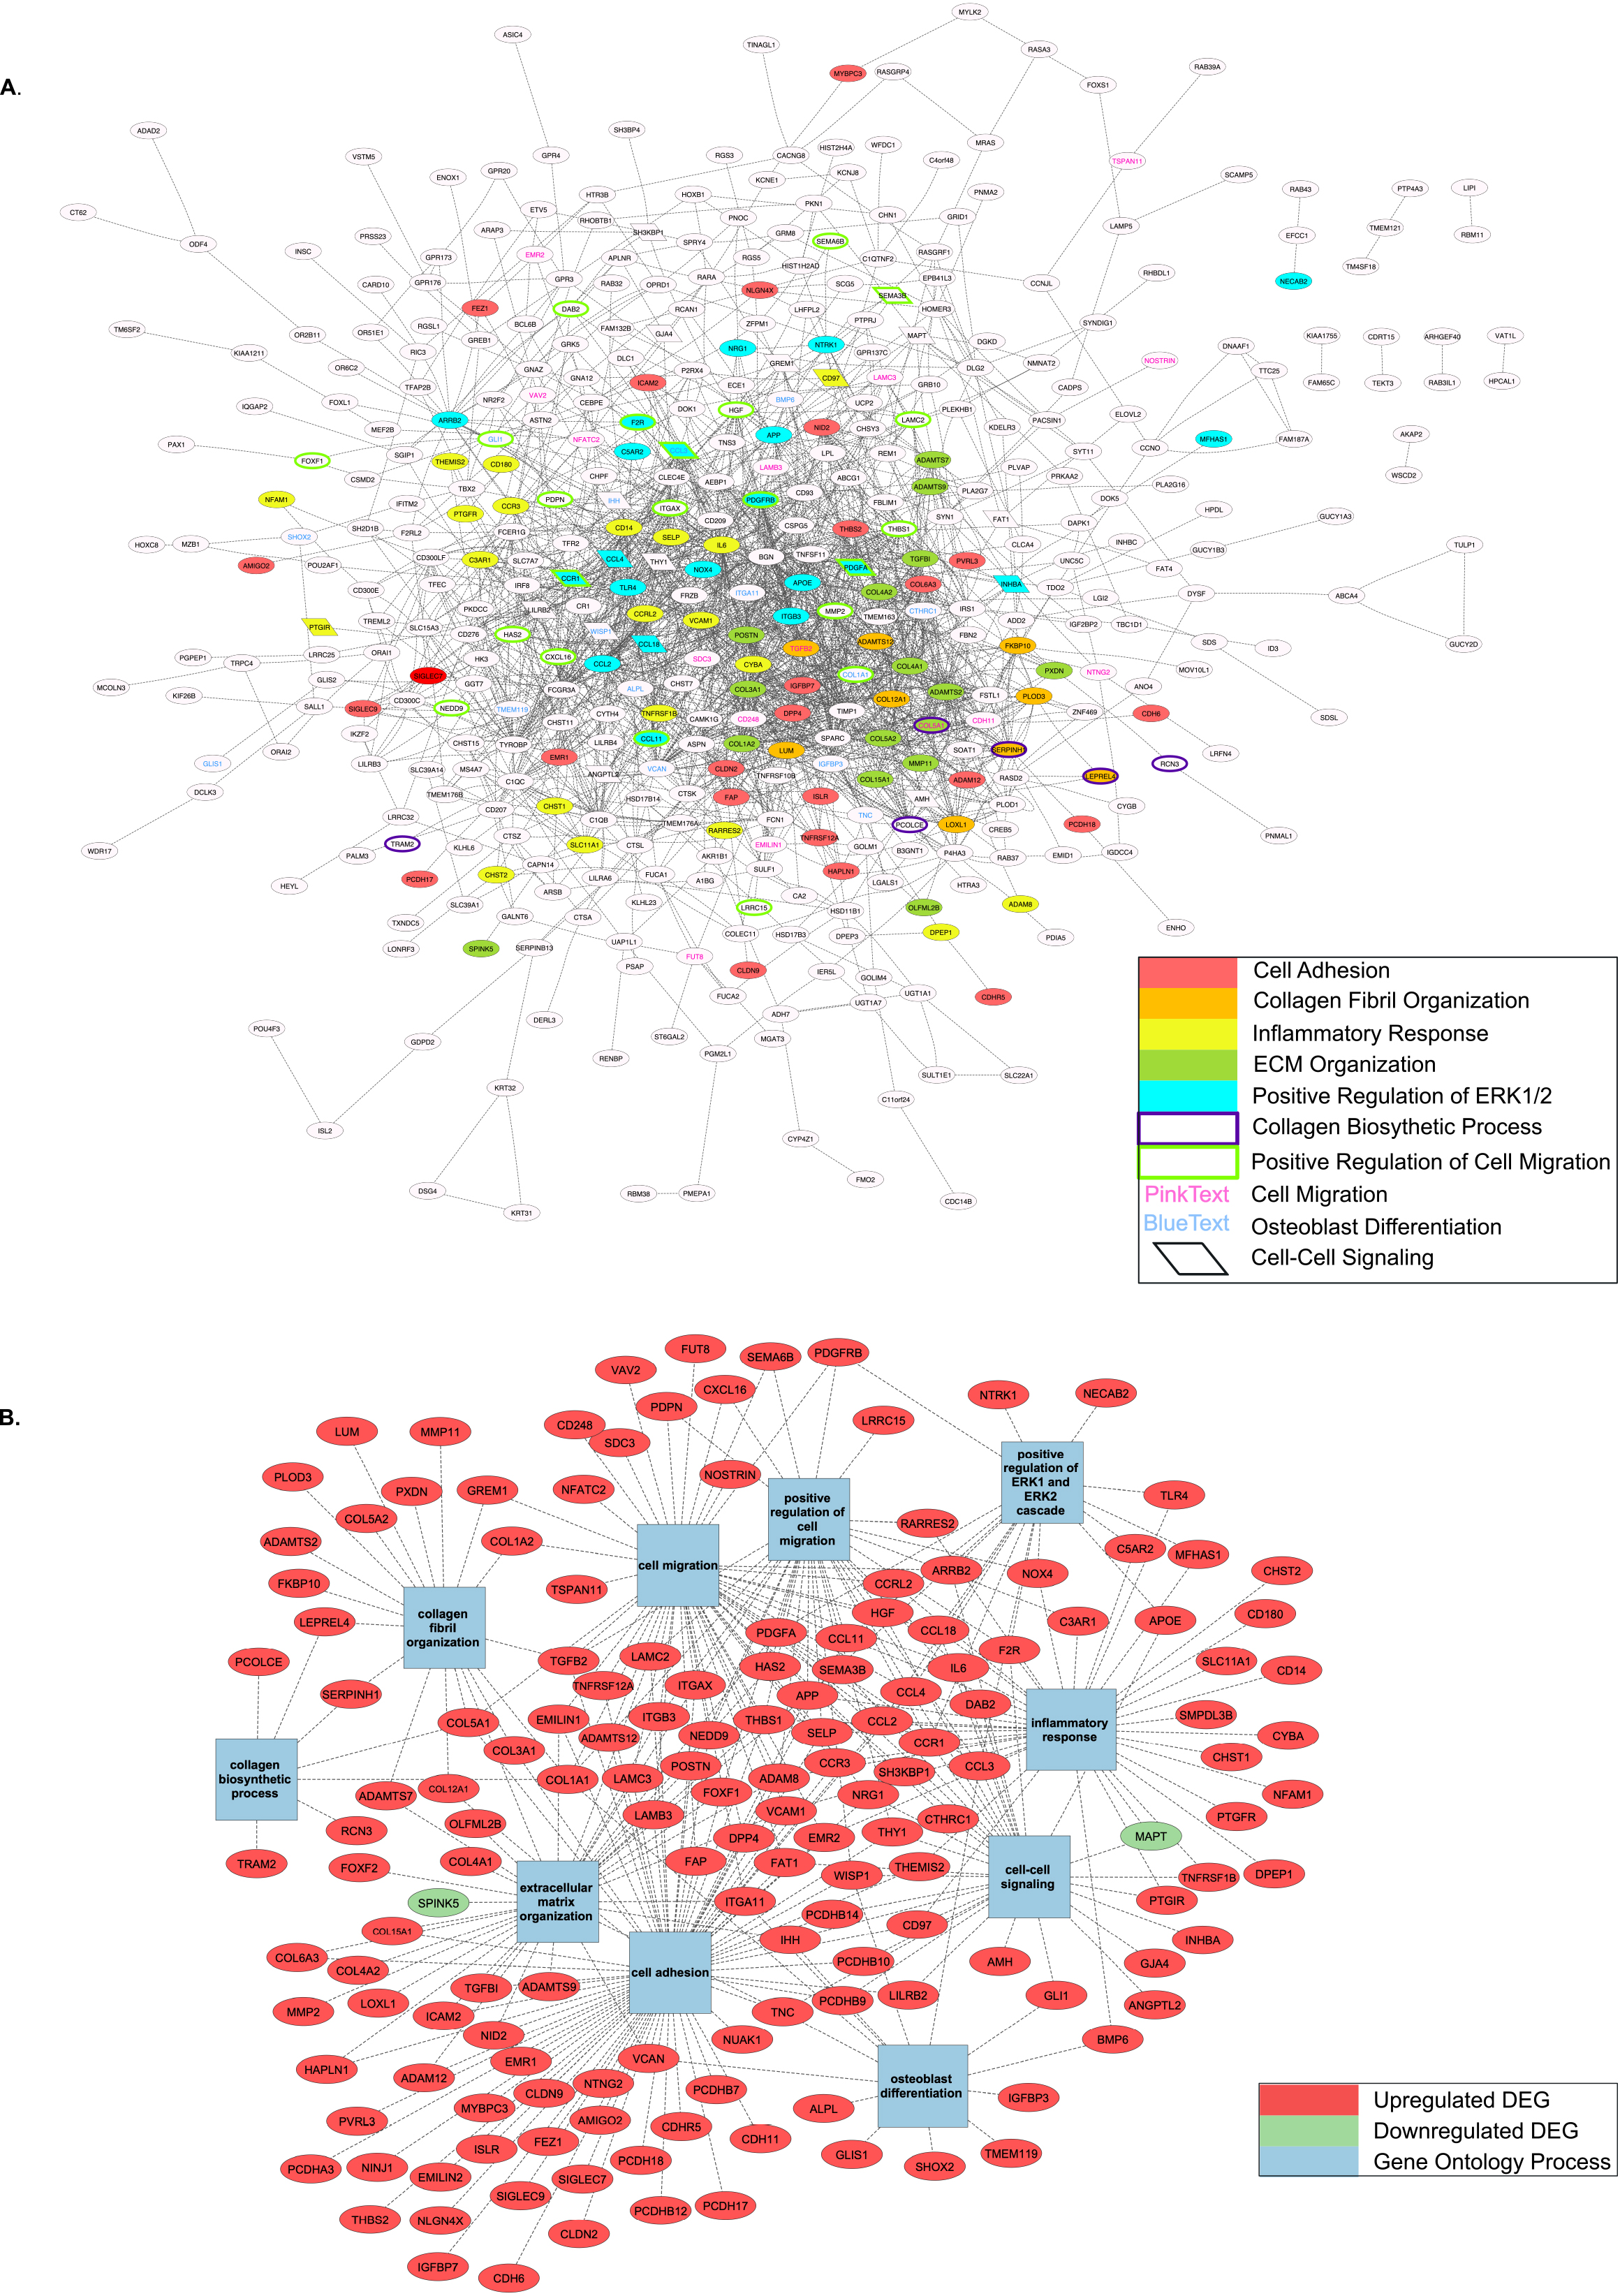
Figure 4.
PPI networks with Top 10 enriched GO Terms by Biological Process. A) Complete PPI network with Top 10 GO Terms highlighted based on gene inclusion; B) Genes found within Top 10 GO Terms and mapped individually to involved process.
4.4Hub gene analysis
Hub gene analysis revealed 84 unique hub genes using cytoHubba and MCODE modules. Of these, cytoHubba produced 48 genes across all five analysis methods (MCC, MNC, Degree, EPC, and DMNC), displayed in Fig. 5A. MCODE revealed 68 genes across four significant modules, depicted in Fig. 5B. Combined, 32 genes demonstrated overlap and appeared in both analysis methods (Fig. 5C). From cytoHubba, no genes were found across all five algorithms of analysis. Despite this, nine genes were found to overlap between MCC, MNC, Degree, and EPC methods (MMP2, BGN, COL1A2, COL1A3, VCAN, THBS1, COL1A1, POSTN, and TIMP1). An additional nine genes were found within three separate algorithmic outputs (COL5A1, COL4A1, COL5A2, THBS2, COL6A3, LUM, ITGB3, CCL2, and IL6).
Figure 5.
Hub gene analysis of significantly dysregulated genes using cytoHubba and MCODE plugins for Cytoscape. A) Outcome of cytoHubba analysis (using MCC, Degree, MNC, EPC, and DMNC algorithms) compared for overlap using five-way Venn diagram; B) Significant (k-score
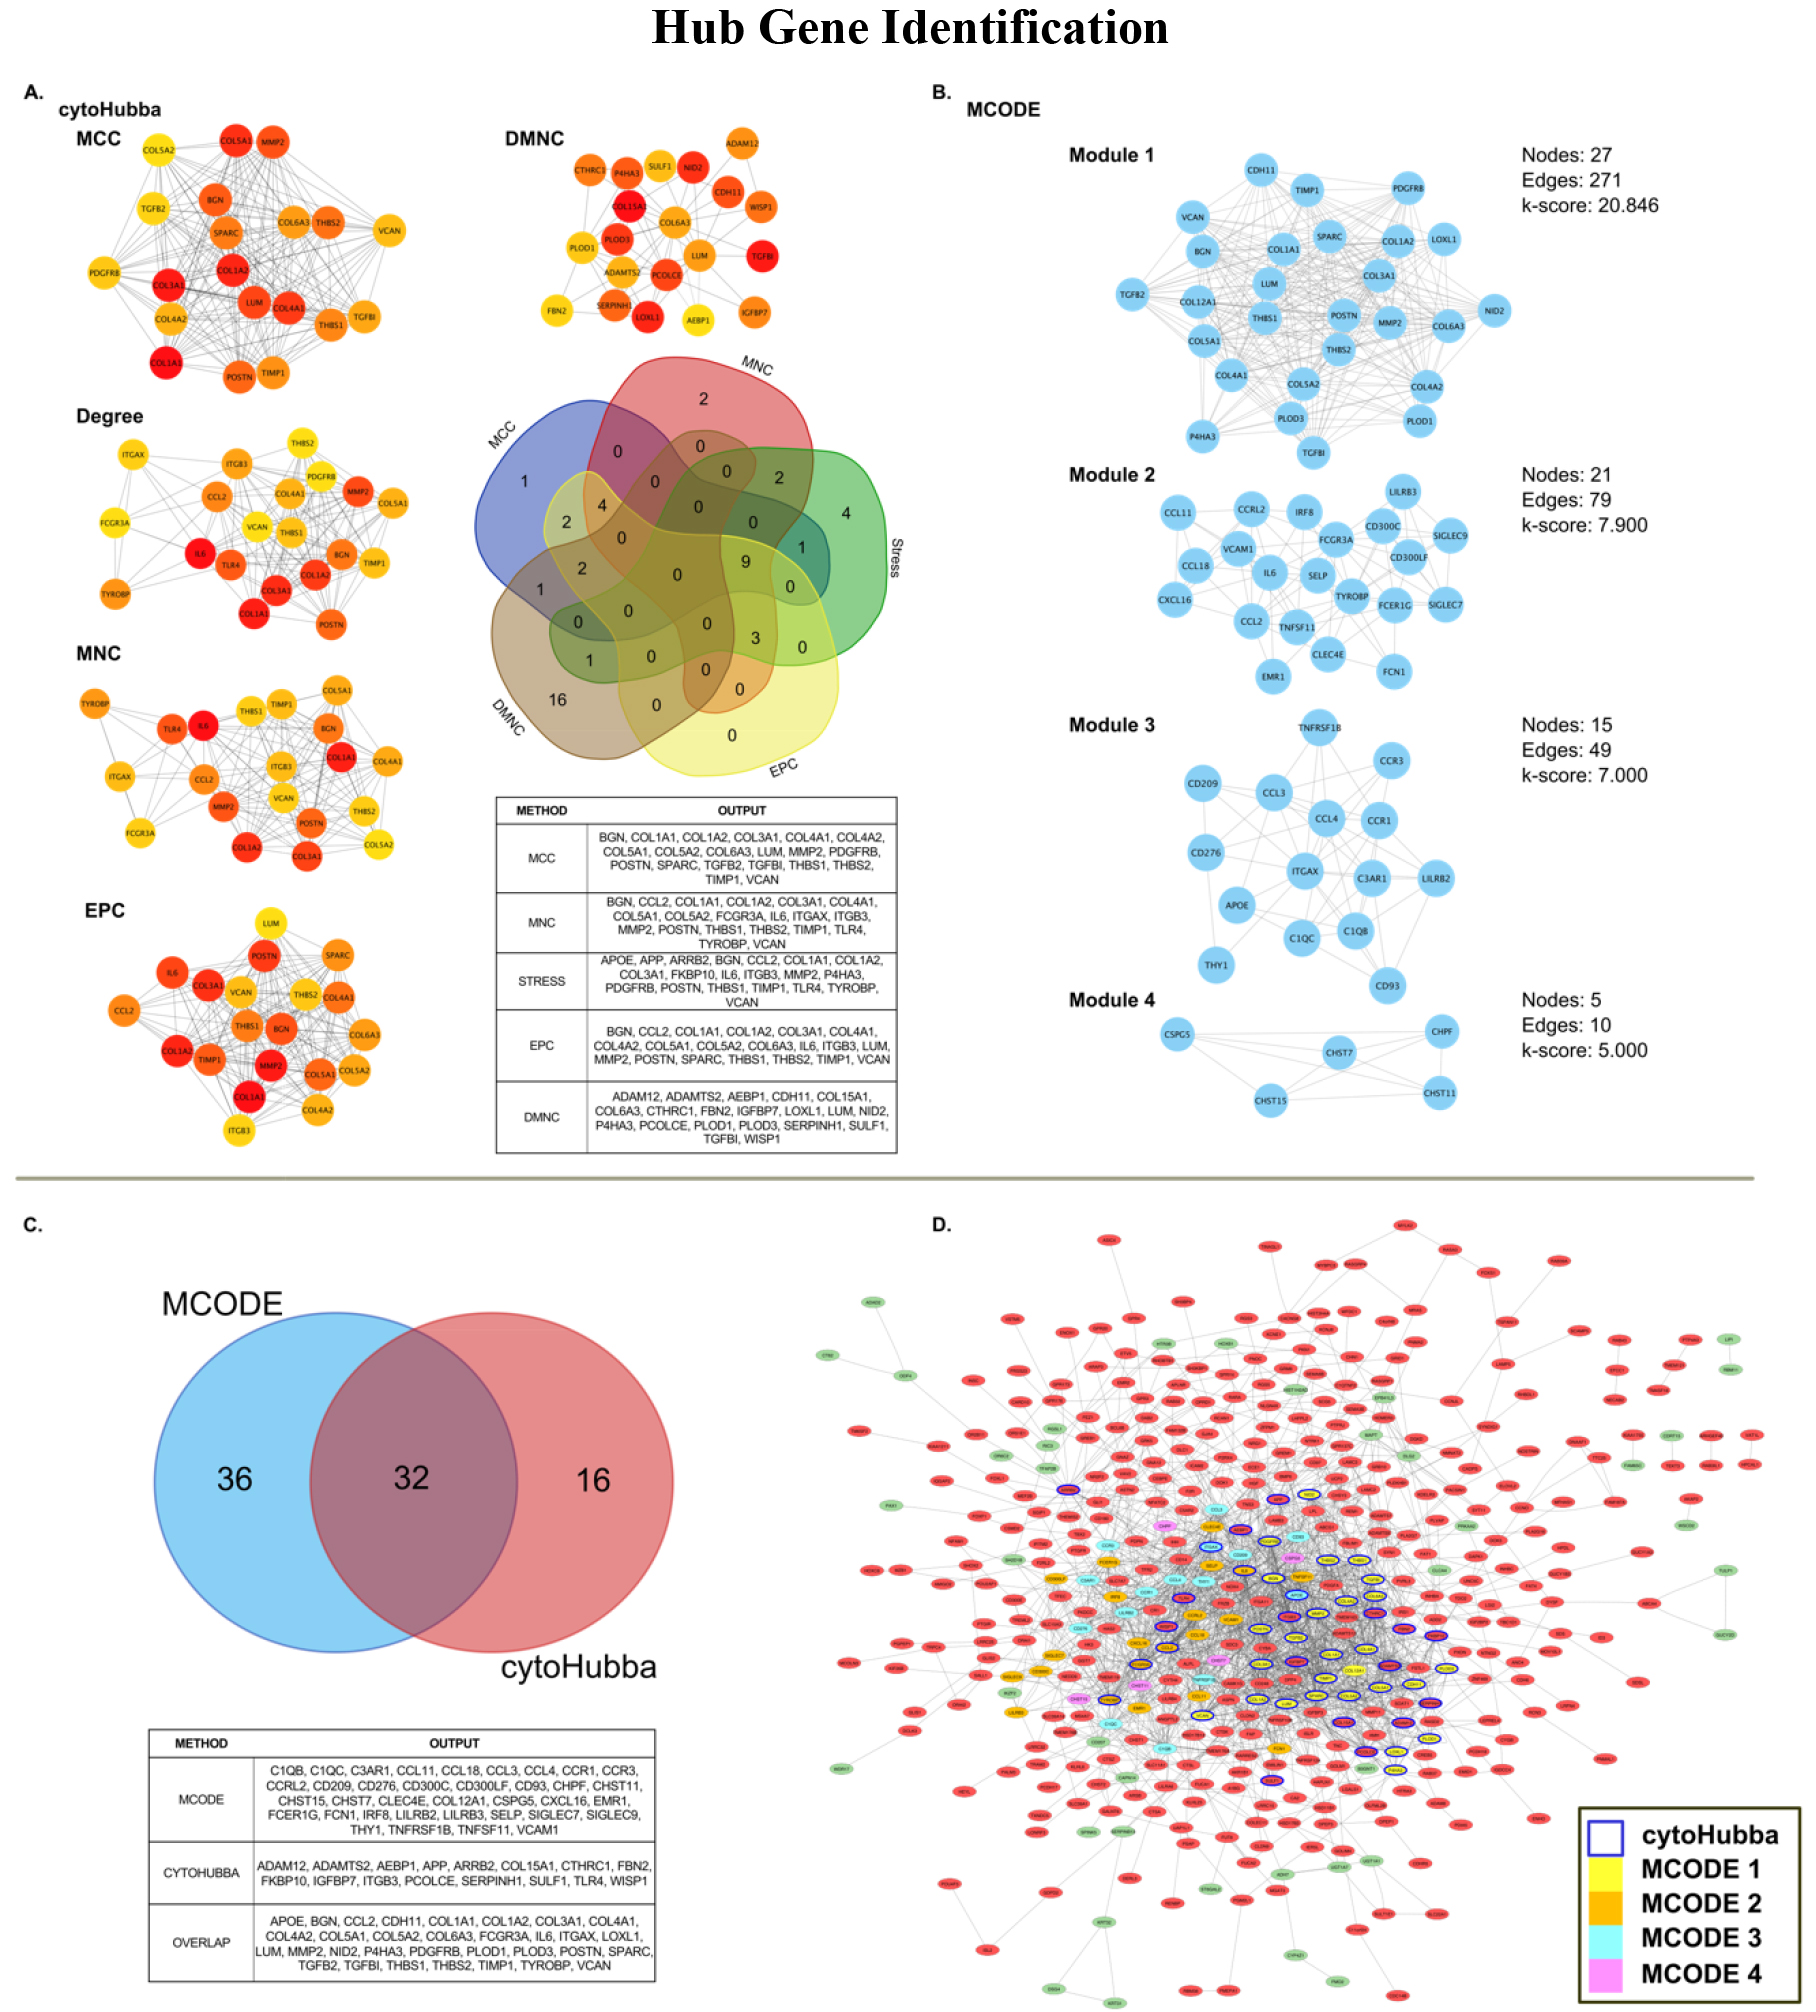
Table 3a
Identified miRs in activated networks indicated through Causal Network analysis (esophageal adenocarcinoma vs. healthy adjacent tissue). miR-DEG targets are divided into
upregulated (log2 FC
| Activated Causal Network miR-DEG Relationships | ||
|---|---|---|
| ASSOCIATED WITH ACTIVATED NETWORK | DEGS (LOG2 | DEGS (LOG2 |
| miR-28 | ADAMTS9, ADGRE5, ALPL, ANGPTL2, ARRB2, BMP6, C3AR1, CCN4, CCR1, CCR3, CD14, CLDN2, COL12A1, COL1A2, CXCL16, CYBA, DAB2, DPEP1, DPP4, EMILIN1, FAP, FAT1, FEZ1, FOXF2, GREM1, ICAM2, INHBA, ITGAX, ITGB3, LUM, MFHAS1, MMP2, NECTIN3, NFAM1, NFATC2, NID2, NLGN4X, NRG1, NTRK1, PCDH17, PCDHB14, PCOLCE, PDGFRB, POSTN, RARRES2, SELP, SEMA3B, SERPINH1, SH3KBP1, SHOX2, TGFBI, THBS2, TNFRSF12A, VCAM1 | SPINK5 |
| miR-145-5p | ADAM12, ADAMTS12, ADAMTS2, ADAMTS9, ADGRE2, ADGRE5, AMH, ANGPTL2, APOE, APP, ARRB2, BMP6, C3AR1, CCL11, CCL18, CCL2, CCL3, CCL4, CCN4, CCR1, CCR3, CCRL2, CD14, CHST2, CLDN2, COL12A1, COL1A1, COL1A2, COL3A1, COL4A1, COL4A2, COL5A1, COL6A3, CYBA, DAB2, DPEP1, EMILIN1, FAP, FAT1, FOXF2, FUT8, GJA4, GLI1, GREM1, HAS2, HGF, IGFBP3, IGFBP7, IL6, INHBA, ITGA11, ITGAX, ITGB3, LAMB3, LAMC2, LOXL1, MFHAS1, MMP11, MMP2, NECTIN3, NEDD9, NFAM1, NFATC2, NID2, NINJ1, NOX4, NRG1, PCDH17, PCDHB12, PCDHB14, PCDHB7, PDGFA, PDGFRB, PDPN, POSTN, PTGFR, PXDN, RARRES2, RCN3, SDC3, SELP, SEMA3B, SERPINH1, SHOX2, SLC11A1, SMPDL3B, TGFBI, THBS1, THBS2, THY1, TLR4, TNC, TNFRSF12A, VCAM1, VCAN | SPINK5 |
| miR-19 | ADAMTS2, AMH, AMIGO2, ANGPTL2, APOE, C3AR1, CCL11, CCL18, CCL2, CCL4, CCR1, CCR3, CCRL2, CD180, CD248, CLDN2, COL12A1, COL15A1, COL1A1, COL1A2, COL3A1, COL5A2, CTHRC1, CYBA, DAB2, DPP4, EMILIN2, FAP, FKBP10, FUT8, GLIS1, GREM1, HAPLN1, HAS2, HGF, IGFBP3, IHH, IL6, LAMB3, LOXL1, LRRC15, MFHAS1, MMP2, NFATC2, NLGN4X, NOX4, NRG1, PCDH18, PCDHB14, PDGFRB, PLOD3, PTGFR, RARRES2, SDC3, SEMA3B, TGFB2, THBS1, TMEM119, TNFRSF1B, VCAM1 | MAPT |
| miR-221 | ADAM8, ADAMTS9, ADGRE1, ADGRE2, ADGRE5, AMH, AMIGO2, ANGPTL2, APP, ARRB2, CCL18, CCL2, CD14, CD248, CDHR5, CLDN2, COL12A1, COL3A1, CTHRC1, CYBA, DPEP1, DPP4, EMILIN1, EMILIN2, FAP, FAT1, FOXF2, GLI1, HAPLN1, ICAM2, IHH, IL6, LAMB3, LAMC2, LOXL1, LRRC15, MFHAS1, MMP11, MMP2, NECTIN3, NFAM1, NLGN4X, NOSTRIN, NOX4, NRG1, PCDH17, PCDHB14, PDPN, PLOD3, PXDN, RCN3, SDC3, SELP, SEMA3B, SH3KBP1, SHOX2, SLC11A1, TGFBI, THBS1, THBS2, TNC, VCAM1, VCAN | |
| miR-133a-3p | ALPL, CCL11, CCL2, CCL3, CCL4, CCN4, COL1A1, COL3A1, COL4A1, HAS2, IGFBP3, IL6, ITGB3, MMP2, PCOLCE, PDGFRB, POSTN, SHOX2, TGFB2, THBS1, THBS2, VCAN | MAPT |
| miR-24 | ALPL, CCL11, CCL2, CCL3, CCL4, CCN4, COL1A1, COL3A1, HAS2, IGFBP3, IL6, ITGB3, MMP2, NOX4, POSTN, VCAN | MAPT |
Table 3b
Identified miRs in inactivated networks indicated through Causal Network analysis (esophageal adenocarcinoma vs. healthy adjacent tissue). miR-DEG targets are divided into upregulated (log2 FC
| Inactivated Causal Network miR-DEG Relationships | ||
|---|---|---|
| ASSOCIATED WITH INACTIVATED NETWORK | DEGS (LOG2 | DEGS (LOG2 |
| miR-149-5p | ADAM12, ADAMTS9, ADGRE5, ALPL, AMH, AMIGO2, ANGPTL2, ARRB2, BMP6, CCL2, CCN4, CCR1, CD14, CDH11, CDH6, CHST2, CLDN2, COL15A1, CTHRC1, CYBA, DAB2, DPP4, EMILIN1, FAP, FEZ1, FOXF1, FOXF2, FUT8, GLI1, GLIS1, GREM1, HAPLN1, ICAM2, IHH, IL6, INHBA, ITGB3, LAMC2, LUM, MFHAS1, NEDD9, NINJ1, NLGN4X, NRG1, PCDH17, PCDH18, PCDHB14, PDGFRB, PTGFR, SEMA3B, SLC11A1, SMPDL3B, TGFB2, TGFBI, THBS2, TNC, VAV2, VCAM1 | SPINK5 |
| miR-96-5p | ADAM12, ADAMTS9, ALPL, AMIGO2, APOE, APP, ARRB2, CCL2, CCN4, CCR1, CCRL2, CDH11, CLDN2, COL12A1, COL1A1, COL3A1, COL4A1, COL5A1, CYBA, DPEP1, EMILIN1, F2R, FAT1, FOXF1, FOXF2, GLI1, GREM1, HAS2, HGF, ICAM2, IGFBP7, IHH, INHBA, ITGB3, LAMB3, LAMC2, MFHAS1, MMP2, NECTIN3, NEDD9, NFAM1, NFATC2, NID2, NINJ1, PCDH18, PCDHB14, PCOLCE, PDGFA, PDPN, POSTN, SELP, SERPINH1, TGFB2, TGFBI, THBS1, THY1, TLR4, TNC, TNFRSF12A, VCAN | |
| miR-204-5p | ADAM12, ADAMTS12, ADAMTS2, ADAMTS9, ANGPTL2, BMP6, C3AR1, CCL18, CCL2, CCL3, CCR3, CD180, CD248, CDH11, CDH6, CHST2, CLDN2, COL12A1, COL15A1, COL1A2, CTHRC1, CYBA, DPEP1, DPP4, F2R, FAP, FOXF2, GLIS1, HAS2, ICAM2, IL6, LAMB3, LOXL1, MFHAS1, MMP11, MMP2, NFATC2, NINJ1, NLGN4X, NOX4, NRG1, NUAK1, PCDH17, PCDHB14, PDGFA, POSTN, PTGFR, PXDN, RARRES2, SEMA3B, SERPINH1, SH3KBP1, SHOX2, SLC11A1, SMPDL3B, TGFB2, TGFBI, THBS2, TMEM119, VAV2, VCAM | |
| miR-335-3p | ADAMTS2, COL1A1, COL1A2, COL4A1, COL4A2, COL5A1, COL5A2, NID2, PDGFA, VCAN | |
| miR-30c-5p | ADAM12, ADAMTS2, ADGRE5, APOE, APP, ARRB2, CCL2, CCL4, COL1A1, COL1A2, COL3A1, COL4A1, COL4A2, COL5A1, COL5A2, DPEP1, DPP4, EMILIN1, F2R, FAT1, FOXF1, HAS2, HGF, IGFBP3, IL6, INHBA, LAMC2, NECTIN3, NFAM1, NID2, NINJ1, PDGFA, PDGFRB, SELP, SERPINH1, TGFB2, TGFBI, THBS1, THBS2, THY1, TNC, TNFRSF1B, VCAN | |
| miR-338-3p | ADAMTS2, COL1A1, COL1A2, COL4A1, COL4A2, COL5A1, COL5A2, NID2, PDGFA, VCAN | |
| miR-10 | ADAM12, ADGRE5, ALPL, APOE, APP, ARRB2, CCL2, CCL3, CCL4, CCN4, CCR1, CCRL2, CLDN2, COL1A2, COL4A1, COL4A2, COL5A2, DPEP1, EMILIN1, F2R, FAT1, FOXF1, GLI1, HGF, IHH, INHBA, ITGB3, LAMB3, LAMC2, NECTIN3, NFAM1, NFATC2, NID2, NINJ1, NOX4, PDGFA, PDGFRB, POSTN, SELP, SERPINH1, TGFB2, TGFBI, THBS1, THY1, TNFRSF1B | |
| miR-30 | ADAM12, ADAMTS9, ADGRE5, APOE, APP, ARRB2, CCL11, CCL3, COL1A1, COL3A1, COL4A1, COL4A2, COL5A2, DPEP1, DPP4, EMILIN1, F2R, FAT1, FOXF1, HAS2, HGF, IGFBP3, IL6, INHBA, ITGB3, LAMC2, MFHAS1, MMP2, NECTIN3, NFAM1, NFATC2, NID2, NINJ1, PDGFA, PDGFRB, POSTN, SELP, SERPINH1, TGFB2, TGFBI, THBS1, THBS2, THY1, TNC, TNFRSF1B, VCAM1, VCAN | |
| miR-630 | ADAM12, ADGRE5, APOE, APP, ARRB2, CCL2, CCL4, COL1A1, COL3A1, COL4A1, COL4A2, COL5A2, DPEP1, DPP4, EMILIN1, F2R, FAT1, FOXF1, HAS2, HGF, IGFBP3, INHBA, LAMC2, NECTIN3, NFAM1, NID2, NINJ1, PDGFA, PDGFRB, SELP, SERPINH1, TGFB2, TGFBI, THBS1, THBS2, THY1, TNC, TNFRSF1B, VCAN | |
| miR-338 | ADAM12, ADGRE5, ALPL, APP, BMP6, CCL3, CCN4, CLDN2, COL6A3, CYBA, DAB2, F2R, FOXF2, GLI1, GLIS1, HGF, IL6, INHBA, LAMB3, LAMC2, LUM, NFATC2, NINJ1, PDGFA, THBS2, TNFRSF1B | |
| miR-450a-5p | COL1A2, COL3A1, COL5A2, HGF, PDGFRB, TGFB2 | |
| miR-29b-3p | ADAMTS2, COL15A1, COL1A1, COL1A2, COL3A1, COL4A1, COL4A2, COL5A1, COL5A2, NID2, PDGFA, VCAN | |
|
Table 3b, continued | ||
|---|---|---|
| Inactivated Causal Network miR-DEG Relationships | ||
| ASSOCIATED WITH INACTIVATED NETWORK | DEGS (LOG2 | DEGS (LOG2 |
| miR-2392 | – | |
| miR-200 | ADAM12, ALPL, COL1A1, COL1A2, COL3A1, FAT1, FOXF2, IL6, LAMC2, MMP2, SERPINH1, TGFB2, TGFBI, THBS1, VCAM1 | |
| miR-128 | IL6 | |
| let-7a-5p | ADAMTS2, COL1A1, COL1A2, COL3A1, COL4A1, COL4A2, COL5A1, COL5A2, IL6, ITGB3, NID2, PDGFA, PXDN, THBS1, TLR4, VCAN | |
| miR-1 | ADAM12, CCL2, IL6, PDGFA | |
| miR-124-3p | CCL2, PLOD3 | |
| let-7 | COL1A1, COL1A2, COL3A1, COL4A1, COL5A2, IL6, ITGB3, THBS1, TLR4 | |
| miR-219a-5p | CD14, TNFRSF1B | |
| miR-218-5p | COL1A1, LAMB3 | |
| miR-182 | FOXF2 | |
| miR-491-5p | MMP2 | |
| MIR99A-LET7C-MIR125B2 | CCL2, COL1A1, COL1A2, COL3A1, COL4A1, COL5A2, GLI1, IL6, ITGB3, NOX4, THBS1, TLR4, ADAM12, ADAM8, ADAMTS9, ADGRE5, AMH, APOE, APP, ARRB2, BMP6, CCR1, CCRL2, CLDN2, COL4A2, COL6A3, DPEP1, EMILIN1, F2R, FAT1, FOXF1, HGF, IHH, INHBA, LAMB3, LAMC2, LUM, MFHAS1, NECTIN3, NFAM1, NFATC2, NID2, NINJ1, PCDH18, PDGFA, PDGFRB, SELP, SERPINH1, SMPDL3B, TGFB2, TGFBI, THEMIS2, THY1, TNFRSF12A, TNFRSF1B | |
| MIR100-LET7A2-MIR125B1 | ADAM12, ADAM8, ADAMTS9, ADGRE5, AMH, APOE, APP, ARRB2, BMP6, CCL2, CCR1, CCRL2, CLDN2, COL1A1, COL1A2, COL3A1, COL4A1, COL4A2, COL5A2, COL6A3, DPEP1, EMILIN1, F2R, FAT1, FOXF1, GLI1, HGF, IHH, IL6, INHBA, ITGB3, LAMB3, LAMC2, LUM, MFHAS1, NECTIN3, NFAM1, NFATC2, NID2, NINJ1, NOX4, PCDH18, PDGFA, PDGFRB, SELP, SERPINH1, SMPDL3B, TGFB2, TGFBI, THBS1, THEMIS2, THY1, TLR4, TNFRSF12A, TNFRSF1B | |
| MIR17HG | ALPL, APP, COL5A1 | |
| MIRLET7 | COL1A1, COL1A2, COL5A2, IL6 | |
MCODE analysis of the PPI revealed four significant modules. The most significant module, Module 1, contained 27 nodes and 271 edges (k-score
Table 4a
Identified miR in activated network indicated through Upstream Regulator analysis (esophageal adenocarcinoma vs. healthy adjacent tissue). miR-DEG targets are divided into upregulated (log2 FC
| Activated Upstream Regulator miR-DEG Relationships | ||
|---|---|---|
| ASSOCIATED WITH ACTIVATED NETWORK | DEGS (LOG2 | DEGS (LOG2 |
| miR-223 | CCR3, CD180, IL6, POSTN, TGFBI, TLR4 | |
Table 4b
Identified microRNAs in inactivated networks indicated through Upstream Regulator analysis (esophageal adenocarcinoma vs. healthy adjacent tissue). miR-DEG targets are divided into upregulated (log2 FC
| Inactivated Upstream Regulator miR-DEG Relationships | ||
|---|---|---|
| ASSOCIATED WITH INACTIVATED NETWORK | DEGS (LOG2 | DEGS (LOG2 |
| miR-335-3p | ADAMTS2, COL1A1, COL1A2, COL4A1, COL4A2, COL5A1, COL5A2, NID2, PDGFA, VCAN | |
| miR-338-3p | ADAMTS2, COL1A1, COL1A2, COL4A1, COL4A2, COL5A1, COL5A2, NID2, PDGFA, VCAN | |
| miR-30c-5p | ADAMTS2, COL1A1, COL1A2, COL4A1, COL4A2, COL5A1, COL5A2, IL6, NID2, PDGFA, VCAN | |
| miR-450a-5p | COL1A2, COL3A1, COL5A2, HGF, PDGFRB, TGFB2 | |
| miR-29b-3p | ADAMTS2, COL15A1, COL1A1, COL1A2, COL3A1, COL4A1, COL4A2, COL5A1, COL5A2, NID2, PDGFA, VCAN | |
| miR-2392 | – | |
| let-7a-5p | ADAMTS2, COL1A1, COL1A2, COL3A1, COL4A1, COL4A2, COL5A1, COL5A2, IL6, ITGB3, NID2, PDGFA, PXDN, THBS1, TLR4, VCAN | |
| miR-124-3p | CCL2, PLOD3 | |
| miR-1 | ADAM12, CCL2, IL6, PDGFA | |
| let-7 | COL1A1, COL1A2, COL3A1, COL4A1, COL5A2, IL6, ITGB3, THBS1, TLR4 | |
| miR-29 | ADAM12, ADAMTS9, COL1A1, COL1A2, COL3A1, COL4A2, COL5A2, ITGA11, MMP2, PDGFA, PDGFRB, THBS1 | |
| miR-182 | FOXF2 | |
| miR-199a-5p | COL1A1, COL4A1, ITGB3, LAMC2, NEDD9 | |
| miR-1-3p | THBS1 | |
| miR-125b-5p | IGFBP3, PCDHB10 | |
| miR-27a-3p | – | |
| miR-193 | CCL2, FAT1 | MAPT |
| miR-155-5p | AMIGO2, CCL18, CCL3, CCL4, IL6 | |
| miR-291a-3p | APP, CCL3, IL6 | |
| miR-205-5p | – | |
| miR-296-5p | COL1A1, TNC | |
| miR-8 | ADAM12, FAT1, FOXF2, IL6, TGFB2 | |
| miR-335-3p | CCL2, CCL3, IL6, MMP2, TLR4 | |
4.5miRs
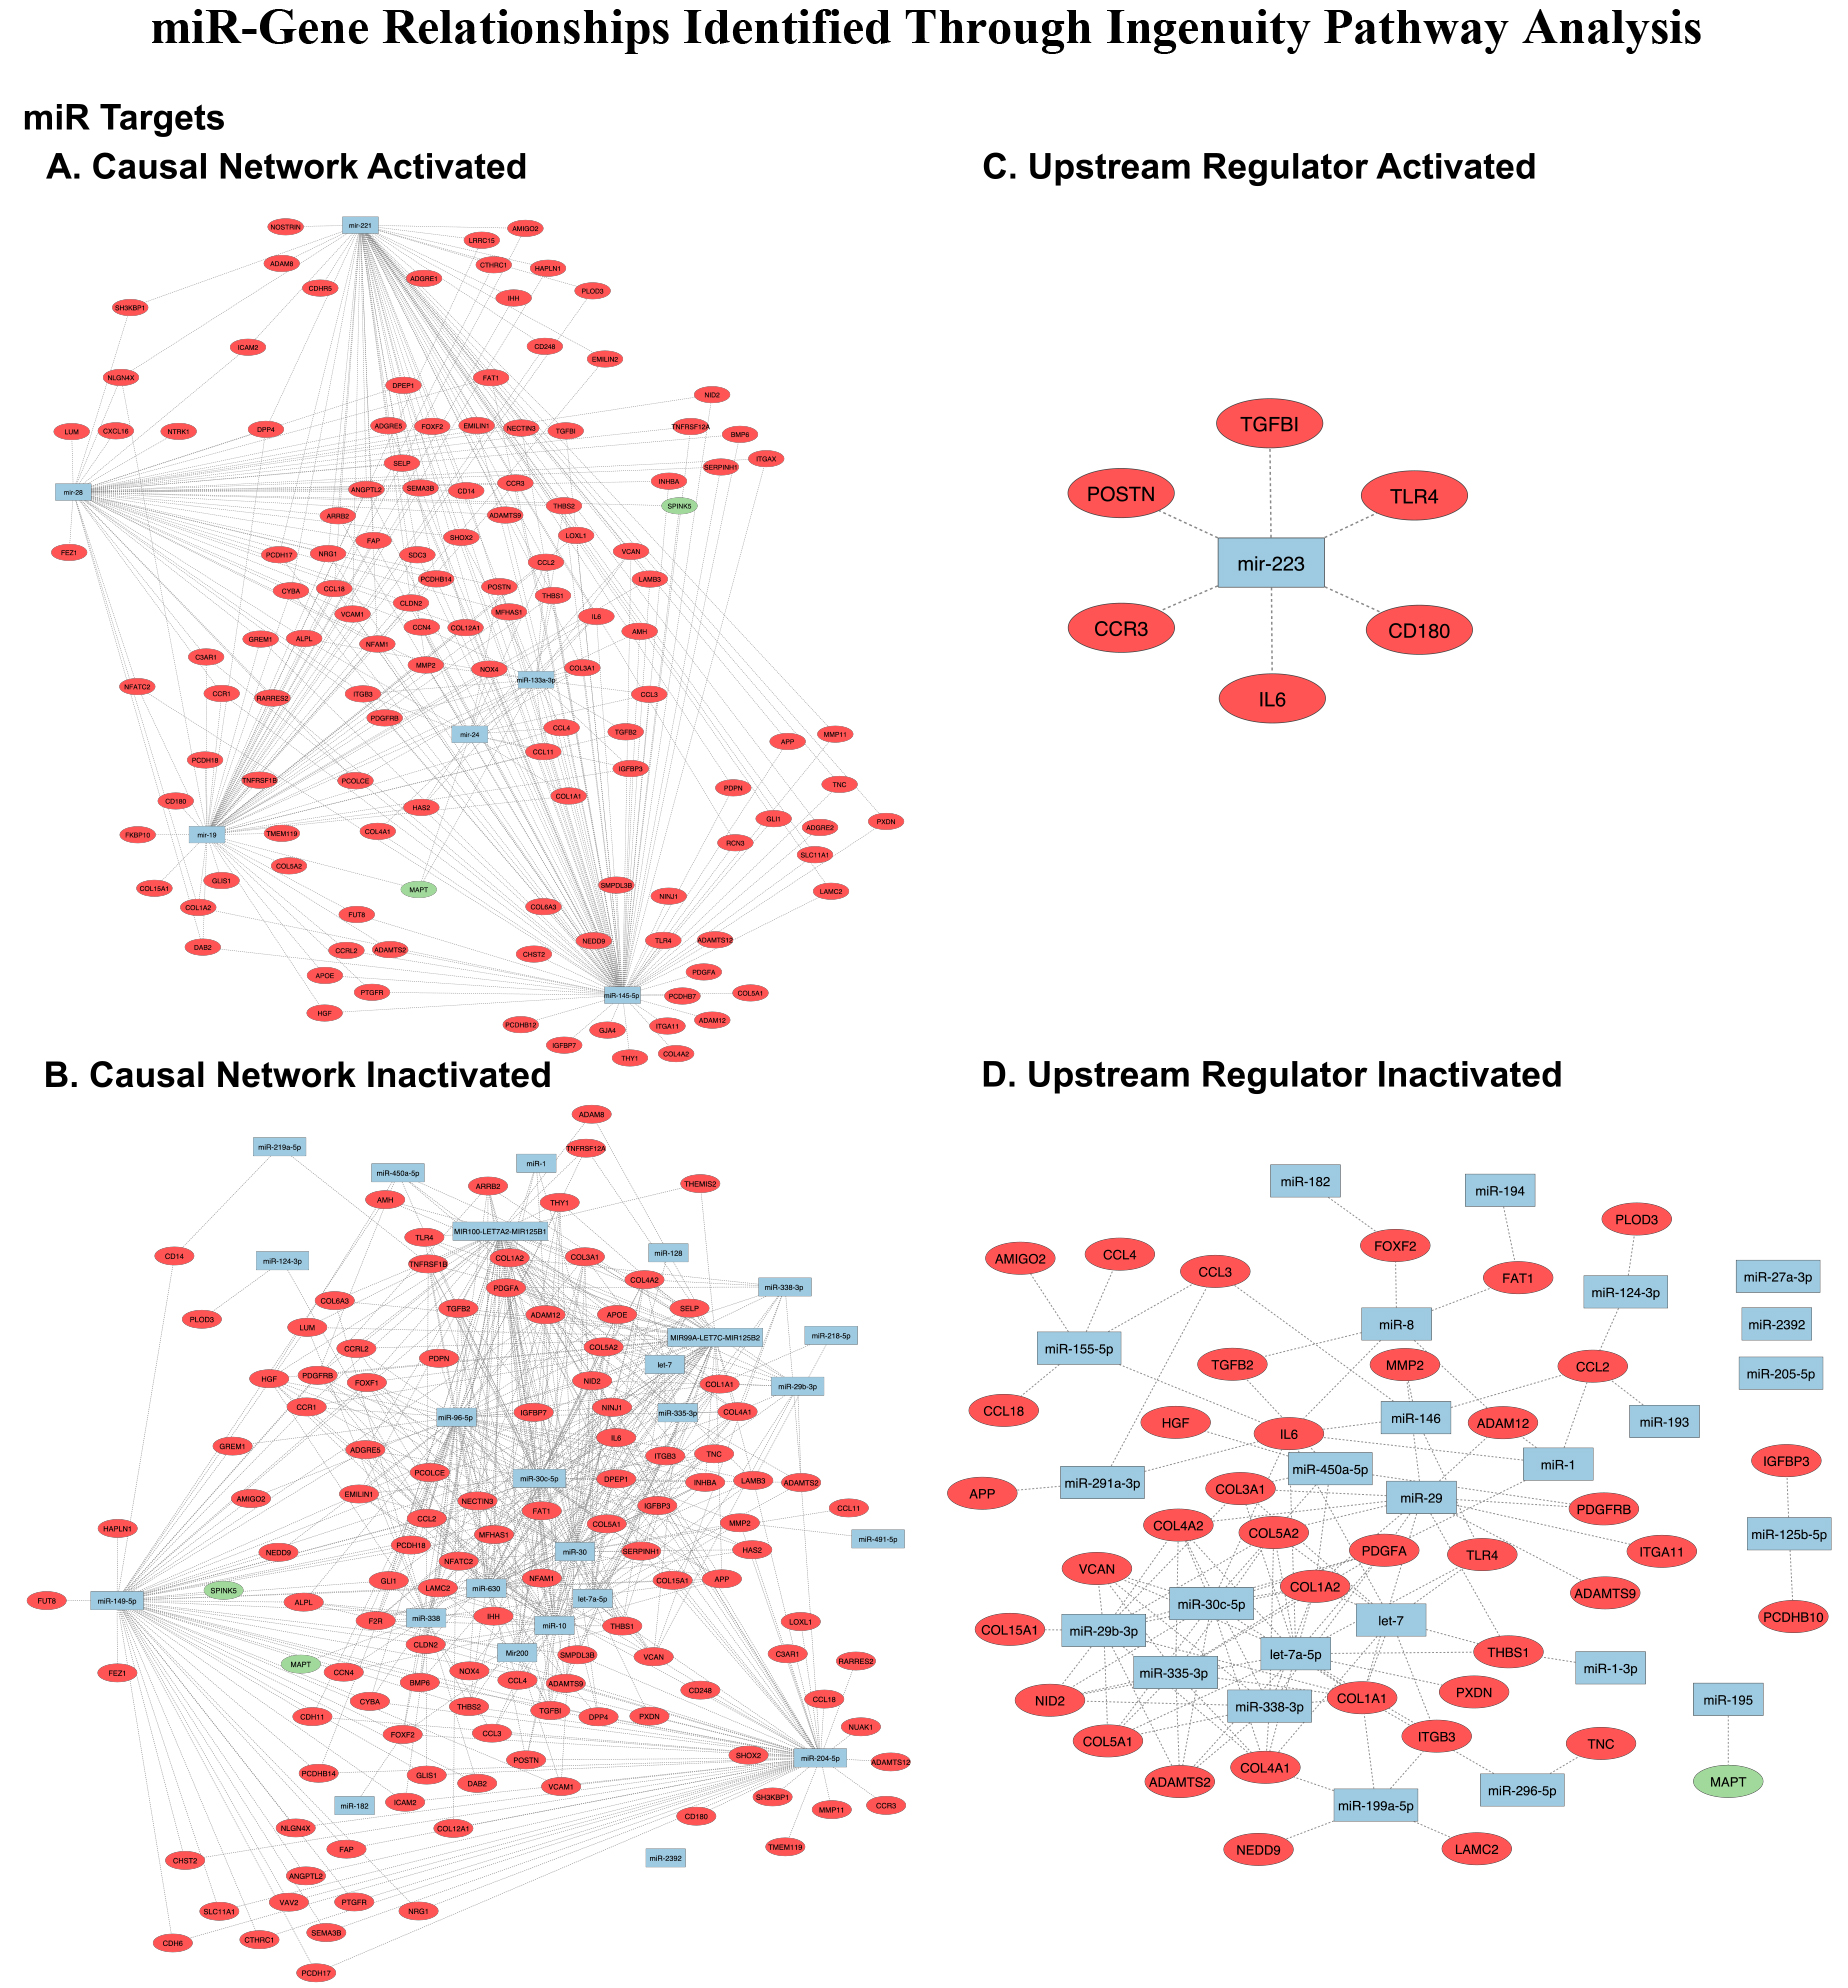
Ingenuity Pathway Analysis of our samples demonstrated the presence of both activated and inhibited networks. Causal network analysis revealed 33 total miRNA; 6 associated with activated networks (mir-28, miR-145-5p, mir-19, mir-221, miR-133a-3p, and mir-24) and 27 associated with inhibited networks (miR-149-5p, miR-96-5p, miR-204-5p, miR-335-3p, miR-30c-5p, miR-338-3p, mir-10, mir-30, mir-630, miR-30c-5p, mir-338, miR-450a-5p, miR-29b-3p, miR-2392, Mir200, mir-128, let-7a-5p, mir-1, miR-124-3p, let-7, miR-219a-5p, miR-218-5p, mir-182, miR-491-5p, MIR100-LET7A2-MIR125B1, MIR17HG, MIR99A-LET7C-MIR125B2, and MIRLET7). Upstream Regulator Analysis revealed 24 total miRNA; one was associated with activated networks (miR-223) and 23 were associated with inhibited networks (miR-335-3p, miR-338-3p, miR-30c-5p, miR-450a-5p, miR-29b-3p, miR-2392, let-7a-5p, miR-124-3p, miR-1, let-7, miR-29, miR-182, miR-199a-5p, miR-1-3p, miR-125b-5p, miR-27a-3p, mir-193, miR-155-5p, miR-291a-3p, miR-205-5p, miR-296-5p, miR-8, and miR-146). All miRs were associated with DEGs within the complete dataset. The miR-DEG relationships identified through Causal Network Analysis are displayed in Table 3a and 3b and Fig. 6A and 6B. Relationships obtained through Upstream Regulator Analysis are depicted in Table 4a and 4b and Fig. 6C and 6D. The complete list of gene targets identified using IPA can be found in Supplemental File 1.
Figure 6.
miRs identified through IPA analysis (esophageal adenocarcinoma vs. healthy adjacent tissue). A) Causal Network Activated; B) Causal Network Inactivated; C) Upstream Regulator Activated; D) Upstream Regulator Inactivated. Red circles: upregulated genes, green circles: downregulated genes, blue squares: microRNAs, dotted line: predicted miR-gene interaction. Nodes without predicted activity were removed. Image generated using Cytoscape (https://cytoscape.org/).
We thoroughly reviewed the literature and found 18 miRs previously described in relation to EAC compared to normal epithelium. These include let-7, miR-1-3p, miR-145-5p, miR-149-5p, miR-199a-5p, miR-27a-3p, MIR200, miR-221, miR-223, miR-335-3p, miR-338-3p, miR-133a-3p, miR-30c-5p, miR-630, MIR17HG, MIR99A-LET7C-MIR125B2, and MIRLET [22, 31, 32, 33, 34, 35, 36, 37, 38, 39, 40, 41, 42]. In addition, mir-218-5p has been described to be elevated in the serum of EAC patients but has yet to be described in tissue biopsy analysis [43]. The moderate overlap between our findings and those already reported serves to validate the dysregulation of previously reported miRs in EAC.
To our knowledge, the remaining 26 miRs identified in this study have yet to be reported concerning EAC compared with normal epithelium and have unknown pathologic implications. These include let-7a-5p, miR-10, miR-124-3p, miR-125b-5p, miR-128, mir-146, miR-155-5p, miR-19, mir-193, miR-204-5p, miR-205-5p, miR-219a-5p , miR-2392, miR-24, miR-28, miR-29, miR-291a-3p, miR-296-5p, miR-29b-3p, miR-30, miR-338, miR-450a-5p, miR-491-5p, miR-8, miR-96-5p, and MIR100-LET7A2-MIR125B1.
4.6qPCR of DEGS for RNA sequencing validation
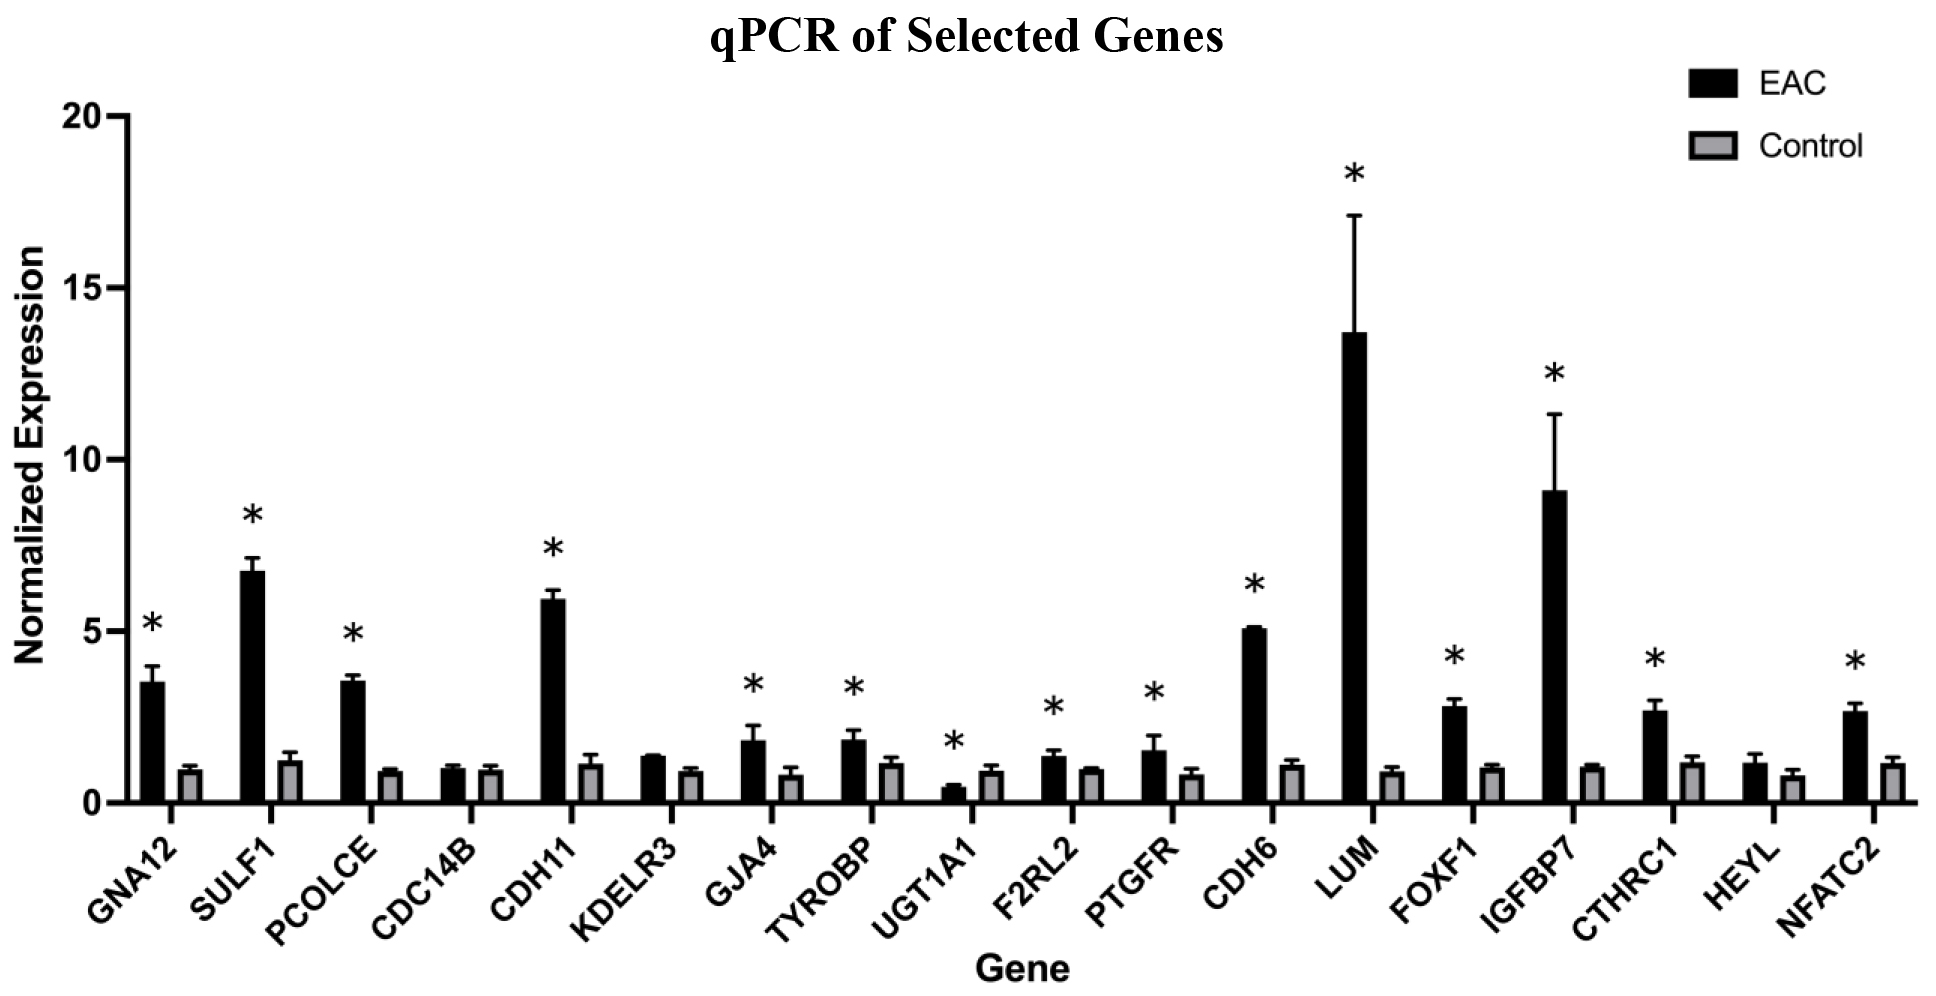
We conducted qPCR analysis on 18 genes from our list of 588 DEGs to verify the results of RNA sequencing. The 18 genes were selected based on a literature review. We selected 11 genes that have not been extensively studied in EAC (PCOLCE, SULF1, GJA4, LUM, CDH6, GNA12, PTGFR, F2RL2, CTSZ, CDC14B, KDELR3, UGT1A1) and seven genes previously identified to be associated with EAC: (CDH11, IGFBP7, FOXF1, CTHRC1, TYROBP, NFATC2, HEYL). qPCR analysis (Fig. 7) confirmed significant dysregulation in 15 of the 18 selected DEGs in EAC compared to control (CDH11, PCOLCE, SULF1, GJA4, LUM, CDH6, GNA12, F2RL2, CTSZ, TYROBP, KDELR3, and UGT1A1). We compared our results to The Human Protein Atlas (https://www.proteinatlas.org/) to determine whether each respective gene has been reported in esophageal tissue. Of the 15 significantly dysregulated genes confirmed through qPCR, we identified F2RL2 as “not detected in esophageal tissue” in The Human Protein Atlas but has been shown to relate to overall prognosis in esophageal carcinoma in general [44].
Figure 7.
Graph representing normalized expression of qPCR product for selected genes (
5.Discussion
The results of this study delineated 46 unique miRs associated with both activated and inhibited pathways. Seven total miRs were detected to be associated with activated pathways: mir-28, miR-145-5p, mir-19, mir-221, miR-133a-3p, mir-24, and miR-223. Inhibited pathways were influenced by a total of 39 miRs, including miR-149-5p, miR-96-5p, miR-204-5p, miR-10, miR-30, miR-630, miR-338, miR200, miR-128, miR-219a-5p, miR-218-5p, miR-491-5p, MIR100-LET7A2-MIR125B1, MIR17HG, MIR99A-LET7C-MIR125B2, MIRLET7, miR-29, miR-199a-5p, miR-1-3p, miR-125b-5p, miR-27a-3p, miR-193, miR-155-5p, miR-291a-3p, miR-205-5p, miR-296-5p, miR-8, miR-146, miR-335-3p, miR-30c-5p, miR-338-3p, miR-450a-5p, miR-29b-3p, miR-2392, let-7a-5p, miR-1, miR-124-3p, let-7, and miR-182. We found no miRs with activity in both activated and inhibited pathways. Comparative analysis revealed that 11 miRs were found to regulate inactivated pathways in both causal network and upstream regulator analyses (miR-335-3p, miR-30c-5p, miR-338-3p, miR-450a-5p, miR-29b-3p, miR-2392, let-7a-5p, miR-1, miR-124-3p, let-7, and miR-182). Further, the dysregulation of DEG expression confirmed through qPCR provides insight into the potential oncogenic role of miRs in EAC. We verified mRNA expression in esophageal tissue for genes CDH11, PCOLCE, SULF1, GJA4, LUM, CDH6, GNA12, CTSZ, TYROBP, KDELR3, and UGT1A1. We found that the protein expression of F2RL2 has not been reported in The Human Protein Atlas but has been associated with prognosis in esophageal carcinoma [44]. This bolsters the notion that aberrant expression of F2RL2 is associated with EAC pathogenesis and thus warrants future investigation.
In this study, we identified significant upregulation in the expression of genes and gene pathways that play a critical role in mediating and maintaining the extracellular matrix and cellular adhesion. Disorganization of the extracellular matrix (ECM) plays an essential role in tumorigenesis. In healthy tissues, the ECM comprises scaffolded collagen, non-collagen, and proteoglycan molecules that serve various functions in cell signaling and structural support [45]. Tumorigenic stimuli disrupt the normal function and makeup of the ECM through extensive modification that favorably supports rapidly expanding dysplastic cell lines [46]. Additionally, alteration in the makeup of ECM proteins appears to increase cell migration to favor metastasis [46, 47]. In the present study, multiple genes and gene pathways related to the ECM were identified as significantly expressed. One crucial component of the ECM is the proteoglycan Lumican (LUM) which functions to provide structural organization of extracellular collagen fibrils [48]. Dysregulation of LUM has been identified to influence the progression of multiple cancers, including gastric, breast, and colon [49, 50, 51]. In gastric cancer, increased LUM expression has been associated with poorer histologic evaluation, metastasis, and worsened overall survival [52]. Our current data support an increased expression of LUM in EAC tissue compared to control. We identified significant Lumican overexpression in RNA-sequencing and qPCR methods of analysis. We also found Lumican to be a highly connected hub gene in hub gene analysis, displaying overlap between both methodologies. Further, GO Term enrichment identified LUM in the highly enriched process of Collagen Fibril Organization. Together, these findings suggest its importance in the protein-protein networks underlying EAC pathophysiology. miR-28, associated with inactivated networks, appears to play a role in the upregulation of LUM expression. miR-28 expression has been shown to promote carcinogenesis in gastric tissue and in non-small cell lung cancer, both through PTEN-mediated pathways that promote cell proliferation and/or invasion [53, 54]. In EAC, miR-28-mediated increased expression of LUM may confer a tendency for transitional tissues to become malignant through similar mechanisms which ultimately promote cell proliferation and invasion by modification of the ECM. The pathway by which this occurs is of interest but requires further study to be fully characterized.
Procollagen C-endopeptidase enhancer (PCOLCE) is another gene found within the separate but highly related collagen biosynthetic process GO Term that we found to be significantly upregulated in EAC samples compared to the control. Members of the PCOLCE family of proteins engage in enhancing the function of procollagen C proteinases in the construction of collagen fibrils [55]. Dysregulation of this mechanism can lead to carcinogenesis and has been documented to be related to increased PCOLCE levels in multiple cancers. According to an analysis of The Cancer Genome Atlas, increased expression of PCOLCE can confer poor prognosis in esophageal cancers, although the frequency in which PCOLCE becomes dysregulated is relatively low [56]. Additionally, The Cancer Genome Atlas groups all types of esophageal cancers together, making its exact relationship to EAC difficult to identify. In gastric cancer, increased expression of PCOLCE was shown to relate directly to increased immunoinfilitrate and is associated with unfavorable prognosis [57]. In addition to its significant upregulation, we identified PCOLCE to be a highly connected hub gene in our samples, providing evidence that it plays a vital role in the EAC carcinogenic process. We found that PCOLCE was influenced by miR-133a-3p in activated networks by causal network analysis. In esophageal squamous cell carcinoma, miR-133a-3p has been identified to suppress the expression of collagen type 1 alpha 1, leading to decreased proliferation and migration [58]. In a variety of other cancers, members of the miR-133a family of microRNAs have been described to play a variety of roles and participate in a range of cellular signaling pathways, though the bulk of evidence suggests miR-133a-related species protect against carcinogenesis [59]. To the best of our knowledge, no relationship between PCOLCE and miR-133a-3p has been established in the literature. However, it appears that miR-133a-3p dysregulation leads, either directly or indirectly, to an increase in PCOLCE expression and ultimately influences the construction of collagen fibrils. Our results suggest an important role for this relationship in EAC development and deserves further study to delineate the exact mechanism by which this occurs.
We also identified the most significantly enriched pathway in our samples as cell adhesion. Within this pathway, we uncovered that cadherin 11 (CDH11) is significantly upregulated. CDH11 has a well-defined role in carcinogenesis and is frequently cited as tumor-suppressive, achieving this function through promoting apoptosis by increasing promotor methylation. Upregulation of CDH11 has been shown to reduce tumorigenicity of cell lines, including in those of esophageal squamous cell carcinoma [60, 61]. In this study, we identified that CDH11 was part of a group of highly connected hub genes identified through both cytoHubba and MCODE analysis, suggesting its importance as a gene related to the underlying pathophysiology in EAC. We further discovered through causal network analysis that the increase in CDH11 observed in this study is related to inactivated networks downstream of miR-96-5p. Application of a conventional understanding of the role of CDH11 would suggest that increased expression should correlate with decreased incidence of carcinogenesis, and this may be related to the staging of our samples, which we did not include in our analysis. Increased CDH11 may confer more favorable histologic staging of EAC samples, though this relationship is not yet studied and serves as an interesting question to be answered in future analysis.
Furthermore, heparan sulfate proteoglycans (HSPGs) within the ECM serve as co-receptors for various ECM ligands, including cytokines, chemokines, and growth factors. HSPGs undergo extensive enzymatic modification, leading to a diversity of binding sites to facilitate cell-surface signaling. 6-O-endosulfatases are one class of HSPG-modifying enzymes that includes sulfatase-1 (SULF1) [62]. SULF1 dysregulation has been attributed to both tumorigenic and tumor-suppressive roles in the literature, suggesting a complicated network of interactions between many of its associated modulators. As a tumorigenic focus, elevated SULF1 expression has been associated with poor prognosis in hepatocellular carcinoma by promoting the progression of EMT (epithelial-mesenchymal transition) and tumor invasion. In this capacity, SULF1 is thought to upregulate transforming growth factor beta (TGF
In this study, we further identified significant upregulation in the expression of genes and gene pathways that play a critical role in mediating inflammation. Chronic inflammatory stimulus within the esophageal mucosa is a well-established risk factor for developing EAC by promoting cell proliferation, growth, and migration [66, 67, 68]. The inflammatory microenvironment is also marked by the recruitment of numerous immune-associated cells, including T-cells, Natural Killer cells, and macrophages [69]. In multiple cancers, including EAC, the phenotypic makeup of immune cells within the inflammatory microenvironment has been shown to correlate with tumorigenicity [70, 71]. Of these cells, macrophages recruited to the area of inflammation promote the formation of extracellular matrix, perform phagocytosis, and provide positive feedback for further cell recruitment through cytokine/chemokine release. Macrophage infiltration into the affected tissue subsequently follows with polarization into subtypes that specialize in different features [72, 73]. For example, circulating macrophages recruited to the site of early tumor formation polarize into primarily M1 tumor-associated macrophages (TAMs). M1 TAMs promote an anti-tumorigenic microenvironment in part through enhancing inflammation and antigen presentation [72, 74, 75]. Over time, macrophages polarize into predominantly M2 TAMs due to exposure to inflammatory cytokines [73]. M2 macrophage predominance has been associated with pro-tumor activity and resistance to anti-tumor therapy [73, 76, 77, 78, 79, 80]. In esophageal squamous carcinoma, M2 macrophage infiltration has been shown to promote tumor cell expansion, invasion, and migration by suppressing the anti-tumorigenic activities of neighboring cells [81]. In EAC, M2 macrophage polarization appears to occur in response to tumor upregulation of Th2 pathways, leading to increased IL-4 and IL-13 [82]. Like other cancers, EAC treatment success is partially dictated by relatively low levels of infiltrating macrophages compared to other immune constituents [83]. Taken together, M2 macrophages may become an attractive target in the emerging treatment of EAC. One putative marker of tumor-associated macrophages is TREM2 [84, 85, 86]. TREM2 signaling is complex and involves a variety of modulating proteins, such as TYRO protein tyrosine kinase-binding protein (TYROBP), one of the central hub genes identified during this study. TYROBP expression has been identified to correlate with M2 macrophage infiltration and prognosis in ESCC [87]. In addition, the TREM2-TYROBP axis has been implicated through small interfering RNA experiments to promote EAC development [88]. In the present study, we identified a significant increase in TYROBP through RNA sequencing and qPCR. In conjunction, we identified the miR cluster MIR100-LET7A2-MIR125B1 to influence inactivated networks upstream of the increased expression of TYROBP. This miR-cluster has been identified to regulate the magnitude of transforming growth factor
6.Conclusion
Correlation of IPA, qPCR, and RNA-sequencing analysis reveals a novel profile of miRs that occur in the setting of EAC. miRs regulating upregulated genes were found to be associated with inhibited pathways through IPA. miRs associated with downregulated genes were discovered to be activated in IPA analysis. While miR influence on gene expression is likely complex, this association bolsters our hypothesis that miRs regulate gene expression and contribute to EAC pathogenesis. Based on these findings, it is evident that the miRs discovered in this study may be used as biomarkers for EAC. However, comparative analysis and correlation with BE tissues will be essential in establishing diagnostic miR profiles.
Further, significantly increased mRNA expression of CDH11, PCOLCE, SULF1, GJA4, LUM, CDH6, GNA12, F2RL2, CTSZ, TYROBP, and KDELR3 and decreased expression of UGT1A1 in EAC tissues suggest that aberrant expression of specific genes play a role in EAC pathogenesis that may guide future research efforts.
In this study, we also identified 32 candidate hub genes associated with EAC and identified the top 10 significantly enriched GO Terms based on our panel of dysregulated genes, which included processes involved in cell adhesion, extracellular matrix, inflammation, cell signaling and cell migration, amongst others.
Limitations
There are a few notable limitations to this study that warrant further investigation. For one, we limited our sample size to four patients. Beyond this, we did not include samples of Barrett’s esophagus for comparative analysis. In addition, we did not include histology grading, staging information, or immunohistochemical analysis of sample tissues to evaluate for protein expression. Despite these limitations, this study delineated novel miRs, reported for the first time, in association with aberrant genes detected in EAC.
Author contributions
Conception: Kalyana Nandipati, MD, and Vikrant Rai.
Interpretation or analysis of data: Ryan Corlett, Vikrant Rai, and Swati Agrawal.
Preparation of the manuscript: Ryan Corlett, Vikrant Rai, Sydney Scheel, and Charles Button.
Revision for important intellectual content: Ryan Corlett, Kalyana Nandipati, MD, and Vikrant Rai.
Supervision: Kalyana Nandipati, MD, and Vikrant Rai.
Data availability
IPA predicted miRs, qPCR, and comparative analysis of genes available in Supplemental File 1. The RNA sequences generated and analyzed during the current study are available in the NCBI Sequence Read Archive repository, https://www.ncbi.nlm.nih.gov/bioproject/?term=PRJNA945944.
Glossary of Abbreviations
| Abbreviation | Definition |
|---|---|
| DEG | Differentially Expressed Gene |
| EAC | Esophageal adenocarcinoma |
| ECM | Extracellular Matrix |
| EMT | Epithelial-Mesenchymal Transition |
| FC | Fold Change |
| FDR | False Discovery Rate |
| FPKM | Fragments Per Kilobase of transcript per Million mapped reads |
| GO | Gene Ontology |
| GPCR | G-Protein Coupled Receptor |
| HSPG | Heparan sulfate proteoglycan |
| IPA | Ingenuity Pathway Analysis |
| miR | microRNA |
| mRNA | Messenger RNA |
| PPI | Protein-Protein Interaction |
| qPCR | Real-time polymerase chain reaction |
| RNA | Ribonucleic acid |
| STRING | Search Tool for Retrieval of Interacting Genes |
| TAM | Tumor-Associated Macrophage |
| TGF | transforming growth factor beta |
|---|---|
| TPM | Transcripts Per Kilobase Million |
| UNMC | University of Nebraska Medical Center |
Supplementary data
The supplementary files are available to download from http://dx.doi.org/10.3233/CBM-230170.
Acknowledgments
No funding.
Conflict of interest
The authors have declared no conflict of interest.
References
[1] | D.J. Uhlenhopp, E.O. Then, T. Sunkara and V. Gaduputi, Epidemiology of esophageal cancer: update in global trends, etiology and risk factors, Clinical Journal of Gastroenterology 13: ((2020) ), 1010–1021. |
[2] | M.J. Domper Arnal, Á. Ferrández Arenas and Á. Lanas Arbeloa, Esophageal cancer: Risk factors, screening and endoscopic treatment in Western and Eastern countries, World Journal of Gastroenterology 21: ((2015) ), 7933–43. |
[3] | R.L. Siegel, K.D. Miller, N.S. Wagle and A. Jemal, Cancer statistics, 2023, CA: A Cancer Journal for Clinicians 73: ((2023) ), 17–48. |
[4] | H. He, et al., Trends in the incidence and survival of patients with esophageal cancer: A SEER database analysis, Thoracic Cancer 11: ((2020) ), 1121–1128. |
[5] | Z. Haiyu, et al., Incidence and Survival Changes in Patients with Esophageal Adenocarcinoma during 1984–2013, BioMed Research International ((2019) ), 7431850. |
[6] | E. Corona, et al., Trends in Esophageal Cancer Mortality and Stage at Diagnosis by Race and Ethnicity in the United States, Cancer Causes Control 32: ((2021) ), 883–894. |
[7] | M.R. Gillespie, V. Rai, S. Agrawal and K.C. Nandipati, The Role of Microbiota in the Pathogenesis of Esophageal Adenocarcinoma, Biology (Basel) 10: ((2021) ). |
[8] | J.E. Bradner, D. Hnisz and R.A. Young, Transcriptional Addiction in Cancer, Cell 168: ((2017) ), 629–643. |
[9] | G. di Leva, M. Garofalo and C.M. Croce, MicroRNAs in cancer, Annual Review of Pathology 9: ((2014) ), 287–314. |
[10] | Y.S. Lee and A. Dutta, MicroRNAs in cancer, Annual Review of Pathology 4: ((2009) ), 199–227. |
[11] | W.C.S. Cho, OncomiRs: the discovery and progress of microRNAs in cancers, Molecular Cancer 6: ((2007) ), 60. |
[12] | A. Vishnoi and S. Rani, miRNA Biogenesis and Regulation of Diseases: An Updated Overview, Methods in Molecular Biology 2595: ((2023) ), 1–12. |
[13] | Z. Ali Syeda, et al., Regulatory Mechanism of MicroRNA Expression in Cancer, International Journal of Molecular Sciences 21: ((2020) ). |
[14] | M.V. Iorio and C.M. Croce, MicroRNA dysregulation in cancer: diagnostics, monitoring and A comprehensive review, EMBO Molecular Medicine 4: ((2012) ), 143–59. |
[15] | M.D. Jansson and A.H. Lund, MicroRNA and cancer, Molecular Oncology 6: ((2012) ), 590–610. |
[16] | M. Budakoti, et al., Micro-RNA: The darkhorse of cancer, Cellular Signaling 83: ((2021) ), 109995. |
[17] | J.L.V. Maag, et al., Novel Aberrations Uncovered in Barrett’s Esophagus and Esophageal Adenocarcinoma Using Whole Transcriptome Sequencing, Molecular Cancer Research 15: ((2017) ), 1558–1569. |
[18] | J.L. Petrick, et al., Circulating MicroRNAs in Relation to Esophageal Adenocarcinoma Diagnosis and Survival, Digestive Diseases and Sciences 66: ((2021) ), 3831–3841. |
[19] | D. Matsui et al., Primary tumor microRNA signature predicts recurrence and survival in patients with locally advanced esophageal adenocarcinoma, Oncotarget 7: ((2016) ), 81281–81291. |
[20] | H. Yang, et al., MicroRNA expression signatures in Barrett’s esophagus and esophageal adenocarcinoma, Clinical Cancer Research 15: ((2009) ), 5744–52. |
[21] | A. Feber, et al., MicroRNA expression profiles of esophageal cancer, The Journal of Thoracic and Cardiovascular Surgery 135: ((2008) ), 255–60; discussion 260. |
[22] | J. Drahos, et al., MicroRNA Profiles of Barrett’s Esophagus and Esophageal Adenocarcinoma: Differences in Glandular Non-native Epithelium, Cancer Epidemiology, Biomarkers & Prevention 25: ((2016) ), 429–37. |
[23] | S. Andrews, FastQC: A Quality Control Tool for High Throughput Sequence Data, ((2015) ). Available online at: http://www.bioinformatics.babraham.ac.uk/projects/fastqc. |
[24] | A. Dobin, et al., STAR: ultrafast universal RNA-seq aligner, Bioinformatics 29: ((2013) ), 15–21. |
[25] | B. Li and C.N. Dewey, RSEM: accurate transcript quantification from RNA-Seq data with or without a reference genome, BMC Bioinformatics 12: ((2011) ), 323. |
[26] | Y. Benjamini and Y. Hochberg, Controlling the False Discovery Rate: A Practical and Powerful Approach to Multiple Testing, Journal of the Royal Statistical Society Series B (Methodological) 57: ((1995) ), 289–300. |
[27] | P. Langfelder, P.S. Mischel and S. Horvath, When is hub gene selection better than standard meta-analysis? PLoS One 8: ((2013) ), e61505. |
[28] | C.H. Chin, et al., cytoHubba: identifying hub objects and sub-networks from complex interactome, BMC Systems Biology 8: (Supplement 4) ((2014) ), S11. |
[29] | H. Ma, et al., Identifying of biomarkers associated with gastric cancer based on 11 topological analysis methods of CytoHubba, Scientific Reports 11: ((2021) ), 1331. |
[30] | G.D. Bader and C.W.V Hogue, An automated method for finding molecular complexes in large protein interaction networks, BMC Bioinformatics 4: ((2003) ), 2. |
[31] | M. Amin and A.K. Lam, Current perspectives of mi-RNA in oesophageal adenocarcinoma: Roles in predicting carcinogenesis, progression and values in clinical management, Experimental Molecular Pathology 98: ((2015) ), 411–8. |
[32] | X. Wu, et al., MicroRNA expression signatures during malignant progression from Barrett’s esophagus to esophageal adenocarcinoma, Cancer Prevention Research (Philadelphia) 6: ((2013) ), 196–205. |
[33] | J. Matsuzaki and H. Suzuki, Circulating microRNAs as potential biomarkers to detect transformation of Barrett’s oesophagus to oesophageal adenocarcinoma, BMJ Open Gastroenterology 4: ((2017) ), e000160. |
[34] | C.H. Lai, et al., Study on miRNAs in Pan-Cancer of the Digestive Tract Based on the Illumina HiSeq System Data Sequencing, BioMed Research International ((2019) ), 8016120. |
[35] | L. Zhang, et al., c-Myb facilitates immune escape of esophageal adenocarcinoma cells through the miR-145-5p/SPOP/PD-L1 axis, Clinical and Translational Medicine 11: ((2021) ), e464. |
[36] | U. Warnecke-Eberz, et al., Exosomal onco-miRs from serum of patients with adenocarcinoma of the esophagus: comparison of miRNA profiles of exosomes and matching tumor, Tumour Biology 36: ((2015) ), 4643–53. |
[37] | S. Tang, et al., Stratification of Digestive Cancers with Different Pathological Features and Survival Outcomes by MicroRNA Expression, Scientific Reports 6: ((2016) ), 24466. |
[38] | J. Matsuzaki and H. Suzuki, Role of MicroRNAs-221/222 in Digestive Systems, Journal of Clinical Medicine 4: ((2015) ), 1566–77. |
[39] | A.K. Eichelmann, et al., Mutant p53 Mediates Sensitivity to Cancer Treatment Agents in Oesophageal Adenocarcinoma Associated with MicroRNA and SLC7A11 Expression, International Journal of Molecular Sciences 22: ((2021) ). |
[40] | C. Zhan, et al., Landscape of expression profiles in esophageal carcinoma by The Cancer Genome Atlas data, Diseases of the Esophagus: official journal of the International Society for Diseases of the Esophagus/I.S.D.E 29: ((2016) ), 920–928. |
[41] | P.S. Plum, et al., Upregulation of miR-17-92 cluster is associated with progression and lymph node metastasis in oesophageal adenocarcinoma, Scientific Reports 9: ((2019) ), 12113. |
[42] | C.M. Smith, et al., miR-200 family expression is downregulated upon neoplastic progression of Barrett’s esophagus, World Journal of Gastroenterology 17: ((2011) ), 1036–44. |
[43] | A.A. van Zweeden, et al., The prognostic impact of circulating miRNAs in patients with advanced esophagogastric cancer during palliative chemotherapy, Cancer Treatment and Research Communications 27: ((2021) ), 100371. |
[44] | C. Li, et al., Identification of an Immune-Related Gene Signature Associated with Prognosis and Tumor Microenvironment in Esophageal Cancer, BioMed Research International 2022: ((2022) ), 7413535. |
[45] | C. Frantz, K.M. Stewart and V.M. Weaver, The extracellular matrix at a glance, Journal of Cell Science 123: ((2010) ), 4195–200. |
[46] | J. Winkler, A. Abisoye-Ogunniyan, K.J. Metcalf and Z. Werb, Concepts of extracellular matrix remodeling in tumour progression and metastasis, Nature Communications 11: ((2020) ), 5120. |
[47] | J.M. Powers, J.C. Roberts and R.G. Craig, Surface failure of commercial and experimental restorative resins, Journal of Dental Research 55: ((1976) ), 432–6. |
[48] | S. Chakravarti, et al., Lumican regulates collagen fibril assembly: skin fragility and corneal opacity in the absence of lumican, The Journal of Cell Biology 141: ((1998) ), 1277–86. |
[49] | X. Wang, et al., Cancer-associated fibroblast-derived Lumican promotes gastric cancer progression via the integrin β1-FAK signaling pathway, International Journal of Cancer 141: ((2017) ), 998–1010. |
[50] | K. Karamanou, M. Franchi, D. Vynios and S. Brézillon, Epithelial-to-mesenchymal transition and invadopodia markers in breast cancer: Lumican a key regulator, Seminars in Cancer Biology 62: ((2020) ), 125–133. |
[51] | A. Radwanska, et al., Overexpression of lumican affects the migration of human colon cancer cells through up-regulation of gelsolin and filamentous actin reorganization, Experimental Cell Research 318: ((2012) ), 2312–23. |
[52] | E.M. Giatagana, et al., Lumican in Carcinogenesis-Revisited, Biomolecules 11: ((2021) ). |
[53] | F. Cui, Q. Zhou, K. Xiao and H. Qian, MicroRNA-28 promotes the proliferation of non-small-cell lung cancer cells by targeting PTEN, Molecular Medicine Reports 21: ((2020) ), 2589–2596. |
[54] | L. Li, et al., MicroRNA-28 promotes cell proliferation and invasion in gastric cancer via the PTEN/PI3K/AKT signaling pathway, Molecular Medicine Reports 17: ((2018) ), 4003–4010. |
[55] | B.M. Steiglitz, et al., Procollagen C proteinase enhancer 1 genes are important determinants of the mechanical properties and geometry of bone and the ultrastructure of connective tissues, Molecular and Cellular Biology 26: ((2006) ), 238–49. |
[56] | H. Gao and Q. Li, A pan-cancer analysis of the oncogenic role of procollagen C-endopeptidase enhancer (PCOLCE) in human, Medicine 101: ((2022) ), e32444. |
[57] | A. Xiang, et al., PCOLCE Is Potent Prognostic Biomarker and Associates With Immune Infiltration in Gastric Cancer, Frontiers in Molecular Biosciences 7: ((2020) ), 544895. |
[58] | Y. Yin, et al., miR-133a-3p suppresses cell proliferation, migration, and invasion and promotes apoptosis in esophageal squamous cell carcinoma, Journal of Cellular Physiology 234: ((2019) ), 12757–12770. |
[59] | Y.T. Hua, W.X. Xu, H. Li and M. Xia, Emerging roles of MiR-133a in human cancers, Journal of Cancer 12: ((2021) ), 198–206. |
[60] | L. Li, et al., The human cadherin 11 is a pro-apoptotic tumor suppressor modulating cell stemness through Wnt/β-catenin signaling and silenced in common carcinomas, Oncogene 31: ((2012) ), 3901–12. |
[61] | X. Chen, et al., Research progress in the role and mechanism of Cadherin-11 in different diseases, Journal of Cancer 12: ((2021) ), 1190–1199. |
[62] | E. Hammond, A. Khurana, V. Shridhar and K. Dredge, The Role of Heparanase and Sulfatases in the Modification of Heparan Sulfate Proteoglycans within the Tumor Microenvironment and Opportunities for Novel Cancer Therapeutics, Frontiers in Oncology 4: ((2014) ), 195. |
[63] | R. Dhanasekaran, et al., Activation of the transforming growth factor-β/SMAD transcriptional pathway underlies a novel tumor-promoting role of sulfatase 1 in hepatocellular carcinoma, Hepatology 61: ((2015) ), 1269–83. |
[64] | Y. Hao, D. Baker and P.T. Dijke, TGF-β-Mediated Epithelial-Mesenchymal Transition and Cancer Metastasis, International Journal of Molecular Sciences 20: ((2019) ). |
[65] | M. Khordadmehr, R. Shahbazi, S. Sadreddini and B. Baradaran, miR-193: A new weapon against cancer, Journal of Cellular Physiology 234: ((2019) ), 16861–16872. |
[66] | T. Fujimura, et al., Inflammation-related carcinogenesis and prevention in esophageal adenocarcinoma using rat duodenoesophageal reflux models, Cancers (Basel) 3: ((2011) ), 3206–24. |
[67] | M.M.M. Abdel-Latif, S. Duggan, J.V. Reynolds and D. Kelleher, Inflammation and esophageal carcinogenesis, Current Opinion in Pharmacology 9: ((2009) ), 396–404. |
[68] | M.E. Kavanagh, et al., The esophagitis to adenocarcinoma sequence; the role of inflammation, Cancer Letters 345: ((2014) ), 182–9. |
[69] | L.M. Schiffmann, et al., Tumor Microenvironment of Esophageal Cancer, Cancers (Basel) 13: ((2021) ). |
[70] | F. Pagès, et al., Immune infiltration in human tumors: a prognostic factor that should not be ignored, Oncogene 29: ((2010) ), 1093–102. |
[71] | R. Haddad, et al., Tumor Lymphocyte Infiltration Is Correlated with a Favorable Tumor Regression Grade after Neoadjuvant Treatment for Esophageal Adenocarcinoma, Journal of Personalized Medicine 12: ((2022) ). |
[72] | C.D. Mills, M1 and M2 Macrophages: Oracles of Health and Disease, Critical Reviews in Immunology 32: ((2012) ), 463–88. |
[73] | A.J. Boutilier and S.F. Elsawa, Macrophage Polarization States in the Tumor Microenvironment, International Journal of Molecular Sciences 22: ((2021) ). |
[74] | S.D. Jayasingam, et al., Evaluating the Polarization of Tumor-Associated Macrophages Into M1 and M2 Phenotypes in Human Cancer Tissue: Technicalities and Challenges in Routine Clinical Practice, Frontiers in Oncology 9: ((2019) ), 1512. |
[75] | X. Zheng, et al., Redirecting tumor-associated macrophages to become tumoricidal effectors as a novel strategy for cancer therapy, Oncotarget 8: ((2017) ), 48436–48452. |
[76] | A. Mantovani, et al., Macrophage polarization: tumor-associated macrophages as a paradigm for polarized M2 mononuclear phagocytes, Trends in Immunology 23: ((2002) ), 549–55. |
[77] | F.J. van Dalen, et al., Molecular Repolarisation of Tumour-Associated Macrophages, Molecules 24: ((2018) ). |
[78] | F. Pantano, et al., The role of macrophages polarization in predicting prognosis of radically resected gastric cancer patients, Journal of Cellular and Molecular Medicine 17: ((2013) ), 1415–21. |
[79] | C. Yang, et al., Increased drug resistance in breast cancer by tumor-associated macrophages through IL-10/STAT3/bcl-2 signaling pathway, Medical Oncology 32: ((2015) ), 352. |
[80] | R. Hughes, et al., Perivascular M2 Macrophages Stimulate Tumor Relapse after Chemotherapy, Cancer Research 75: ((2015) ), 3479–91. |
[81] | X. Yuan, et al., Tumor-associated macrophage polarization promotes the progression of esophageal carcinoma, Aging 13: ((2020) ), 2049–2072. |
[82] | J. Gao, et al., Infiltration of alternatively activated macrophages in cancer tissue is associated with MDSC and Th2 polarization in patients with esophageal cancer, PLoS One 9: ((2014) ), e104453. |
[83] | S.J.M. Hoefnagel, et al., Identification of Novel Molecular Subgroups in Esophageal Adenocarcinoma to Predict Response to Neo-Adjuvant Therapies, Cancers (Basel) 14: ((2022) ). |
[84] | K. Nakamura and M.J. Smyth, TREM2 marks tumor-associated macrophages, Signal Transduction and Targeted Therapy 5: ((2020) ), 233. |
[85] | M. Binnewies, et al., Targeting TREM2 on tumor-associated macrophages enhances immunotherapy, Cell Reports 37: ((2021) ), 109844. |
[86] | A. Deczkowska, A. Weiner and I. Amit, The Physiology, Pathology, and Potential Therapeutic Applications of the TREM2 Signaling Pathway, Cell 181: ((2020) ), 1207–1217. |
[87] | J. Yao, et al., Development and Validation of a Prognostic Gene Signature Correlated With M2 Macrophage Infiltration in Esophageal Squamous Cell Carcinoma, Frontiers in Oncology 11: ((2021) ), 769727. |
[88] | S.P. Duggan, et al., siRNA Library Screening Identifies a Druggable Immune-Signature Driving Esophageal Adenocarcinoma Cell Growth, Cellular and Molecular Gastroenterology and Hepatology 5: ((2018) ), 569–590. |
[89] | P. Papoutsoglou, et al., The noncoding MIR100HG RNA enhances the autocrine function of transforming growth factor β signaling, Oncogene 40: ((2021) ), 3748–3765. |
[90] | F. Zhang, et al., TGF-β induces M2-like macrophage polarization via SNAIL-mediated suppression of a pro-inflammatory phenotype, Oncotarget 7: ((2016) ), 52294–52306. |


