
The combined detection of hematological indicators is used for the differential diagnosis of colorectal cancer and benign-colorectal lesions
Abstract
OBJECTIVE:
This article aims to investigate the clinical value of hemoglobin/red cell distribution width ratio (Hb/RDW), C-reactive protein/albumin ratio (CAR) and plateletcrit (PCT) combined with carcinoembryonic antigen (CEA) in colorectal cancer (CRC) auxiliary diagnosis.
METHODS:
We retrospectively analyzed in 718 subjects (212 with CRC, 209 with benign colorectal lesions (BCL), 111 with other cancers, and 186 healthy controls).
RESULTS:
The CAR, PCT, and CEA in the CRC group were higher than those in the BCL, other cancers, and the healthy control group. However, Hb/RDW in the CRC group was lower than the other three groups. Moreover, there were significant differences in Hb/RDW and CEA among different T-N-M stages (all
CONCLUSIONS:
Hb/RDW, CAR, PCT, and CEA are independent risk factors for CRC. Hb/RDW, CAR, and PCT combined with CEA have significant value for auxiliary differential diagnosis of CRC and BCL.
1.Introduction
Colorectal cancer (CRC) is a common malignancy of the digestive system [1]. Inflammation is involved in the development and progression of cancer [2], with at least 15% of tumors being caused by inflammations [3]. As a commonly used indicator of inflammation, C-reactive protein (CRP) is widely used in the diagnosis of inflammation-related diseases and prognostic evaluation of tumors. Meanwhile, serum albumin (Alb) is commonly used to evaluate the patient’s nutritional status and the prognosis of malignant tumors in inflammation-related diseases. C-reactive protein/albumin ratio (CAR), a ratio of CRP to Alb, offers a more accurate and comprehensive assessment for postoperative recovery in patients with malignant tumors [4]. As one of the platelet (PLT) parameters, plateletcrit (PCT) is closely related to inflammation [5]. Meanwhile, carcinoembryonic antigen (CEA) is a kind of polysaccharide protein complex that is a hematological index for monitoring CRC. Although it has a diagnostic value in CRC, it has low specificity [6]. To date, pathological diagnosis remains the most accurate method for diagnosing CRC, but it is invasive. Inflammatory markers have the advantages of small trauma and low cost. CAR and PCT are all indicators of inflammation that play an important role in the development and prognosis of malignant tumors.
Hemoglobin (Hb) is a known prognostic marker for CRC, the effect of anemia on prognosis has been shown in CRC and other cancers [7]. Currently, red cell distribution width ratio (RDW), a parameter to evaluate the heterogeneity of red blood cell size, has been also used to diagnose cancer such as CRC [8]. A recent study [9] found that the Hb/RDW, a ratio of Hb to RDW, was a more powerful indicator of prognosis above Hb or RDW alone in esophageal cancer. Tham et al. [10] has evaluated prognostic utility of Hb/RDW in head and neck tumors. Therefore, this study aimed to explore the clinical value of Hb/RDW, CAR, PCT, and CEA in the diagnosis of CRC, and this is the first study to explore the diagnostic value of Hb/RDW in CRC.
2.Patients and methods
2.1Patients
This retrospective study analyzed four patient groups from the First Affiliated Hospital of Guangxi Medical University in China: (1) those who were first diagnosed with CRC from April 2015 to December 2020; (2) those who were diagnosed with benign colorectal lesions (BCL) such as colorectal polyps and colorectal adenoma in the same period; and (3) those diagnosed as malignant tumors other than colorectal cancer, such as nasopharyngeal carcinoma, thyroid carcinoma, etc. (4) healthy controls. All patients with cancer were diagnosed after finding cancer cells or tissues by pathological biopsy. Patients with CRC had no treatment were included, while those who had trauma, pregnancy, diabetes mellitus, autoimmune diseases, inflammation, cardiovascular disease, kidney disease, liver disease, blood disease were excluded. Staging was according to the 7th edition of the American Joint Committee on Cancer tumor-node-metastasis criteria. The study protocol (Approval Number: 2021 (KY-E-339)) was approved by the Ethics Committee of the First Affiliated Hospital of Guangxi Medical University, and all the participants were orally informed and agreed.
2.2Detection of related inflammatory indicators
Blood samples were collected before patients underwent colorectal cancer resection, and they had not been treated before. Fasting venous blood samples from each patient were collected in the morning and placed in an EDTA-K2 anticoagulation tube (2 mL) or in a non-anticoagulated tube (5 mL). The levels of whole blood cell parameters, including hemoglobin (Hb), red cell distribution width (RDW), PLT, and PCT, were determined using a Beckman Coulter LH780 (Beckman Coulter Inc., Brea, CA, USA). Serum levels of CRP and Alb were measured using a Hitachi 7600 automatic biochemical analyzer (Hitachi High-Technologies Corp., Tokyo, Japan). Serum CEA levels were determined using a Roche E600 (Roche Diagnostics, Basel, Switzerland).
2.3Statistical analysis
All data were analyzed using SPSS 19.0 (IBM Corp., Armonk, NY, USA). Measurement data were expressed as mean
Table 1
Comparison of laboratory indicators among the four groups
| Indicator | CRC group | BCL group | Other cancers | Healthy controls |
|
|---|---|---|---|---|---|
|
| 212 | 209 | 111 | 186 | |
| Sex (male, %) | 134 (63.21%) | 137 (65.55%) | 69 (62.16%) | 121 (65.05%) | |
| Age (year) | 58.89 | 56.54 | 55.88 | 55.92 | 0.068 |
| Hb (g/L) | 119 (105–133) | 127 (119–140)a | 125 (116–136)b | 134 (126–141)c | |
| PLT (109/L) | 289 (226–347) | 199 (183–278)a | 263 (225–312)b | 216 (184–243)c | |
| CRP (mg/L) | 4.62 (1.70–11.98) | 2.96 (1.54–6.62)a | 1.65 (0.95–2.99)b | 1.40 (0.90–2.60)c | |
| Alb (g/L) | 38.0 (35.5–40.4) | 41.9 (39.2–43.9)a | 40.2 (37.1–43.4)b | 42.4 (41.3–43.8)c | |
| RDW | 0.14 (0.13–0.16) | 0.13 (0.12–0.14)a | 0.14 (0.13–0.15)b | 0.13 (0.12–0.13)c | |
| CAR | 0.12 (0.04–0.32) | 0.07 (0.04–0.16)a | 0.04 (0.02–0.07)b | 0.03 (0.02–0.06)c | |
| PCT | 0.26 (0.20–0.32) | 0.20 (0.16–0.24)a | 0.23 (0.19–0.27)b | 0.22 (0.19–0.25)c | |
| Hb/RDW | 872 (686–1015) | 1008 (870–1148)a | 931 (805–1015)b | 1068 (969–1140)c | |
| CEA (ng/ml) | 25.91 | 2.77 | 4.05 | 1.86 |
Notes: Data are expressed as mean
Figure 1.
The levels of Hb/RDW (A), CAR (B), PCT (C) and CEA (D) in CRC, BCL, Other cancers, and healthy controls groups. Abbreviations: BCL, benign colorectal lesions; CAR, C-reactive protein to leukocyte ratio; CEA, carcinoembryonic antigen; CRC, colorectal cancer; Hb/RDW, hemoglobin/red cell distribution width ratio; PCT, plateletcrit.
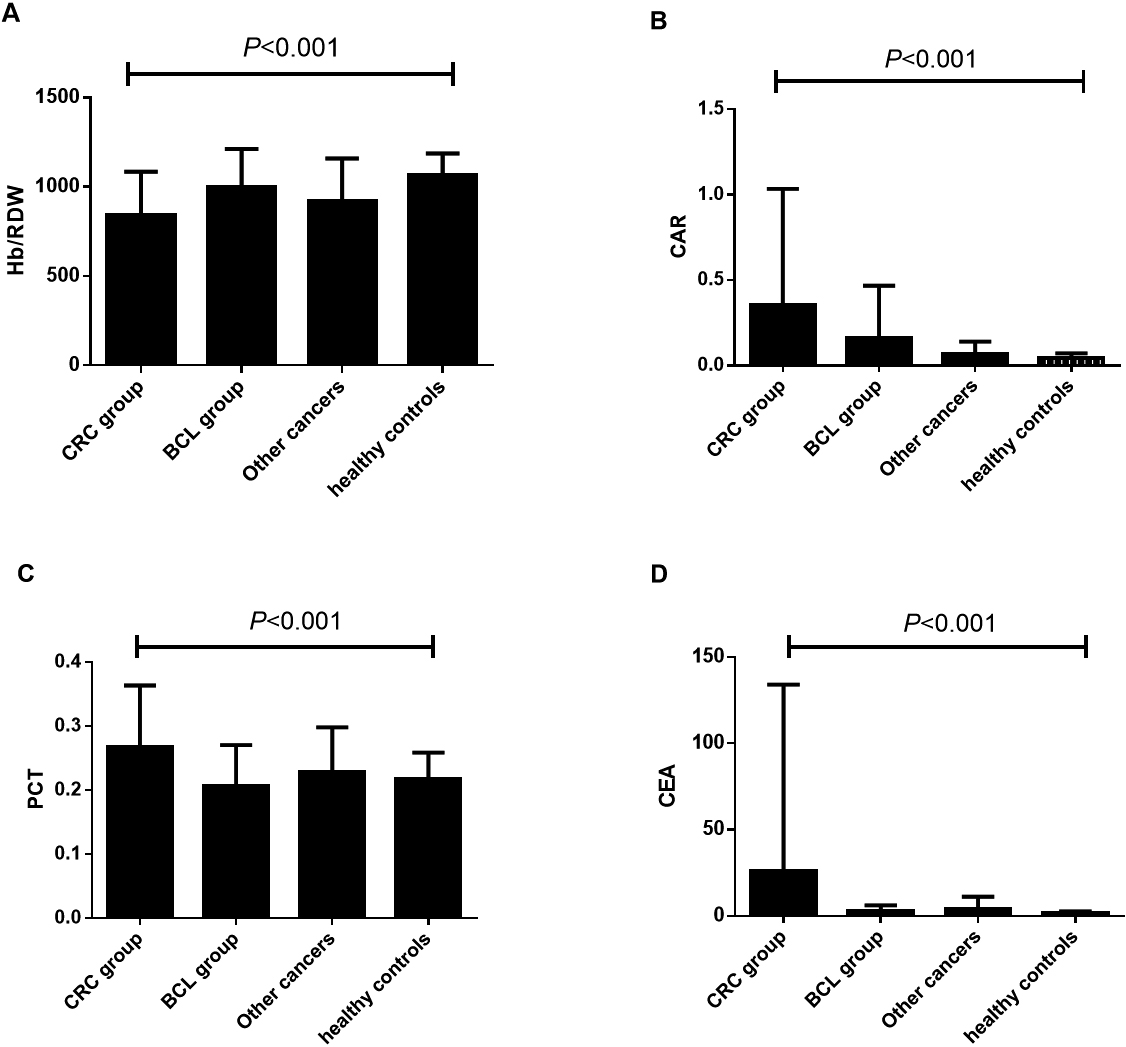
Table 2
Differential analysis of Hb/RDW, CAR, PCT, CEA and tumor, node, metastasis in colorectal cancer group
| T-N-M |
| Hb/RDW |
| CAR |
| PCT |
| CEA |
|
|---|---|---|---|---|---|---|---|---|---|
| Tumor | |||||||||
| T1 | 42 | 941 (760–1098) | 0.040 | 0.09 (0.04–0.21) | 0.120 | 0.24 | 0.009 | 2.86 (1.62–5.23) | 0.001 |
| T3 | 170 | 854 (668–1001) | 0.14 (0.05–0.36) | 0.28 | 5.16 (2.26–13.99) | ||||
| Node | |||||||||
| N0 | 99 | 933 (731–1042) | 0.038 | 0.09 (0.04–0.21) | 0.23 | 0.948 | 3.13 (1.84–8.20) | ||
| N1–N4 | 113 | 822 (632–981) | 0.17 (0.07–0.43) | 0.27 | 6.23 (2.62–15.69) | ||||
| Metastasis | |||||||||
| M0 | 179 | 921 (740–1021) | 0.11 (0.04–0.22) | 0.23 | 3.71 (2.06–9.34) | ||||
| M1 | 33 | 700 (574–831) | 0.37 (0.16–0.92) | 0.31 | 23.11 (5.33–96.23) |
Notes: Data are expressed as mean
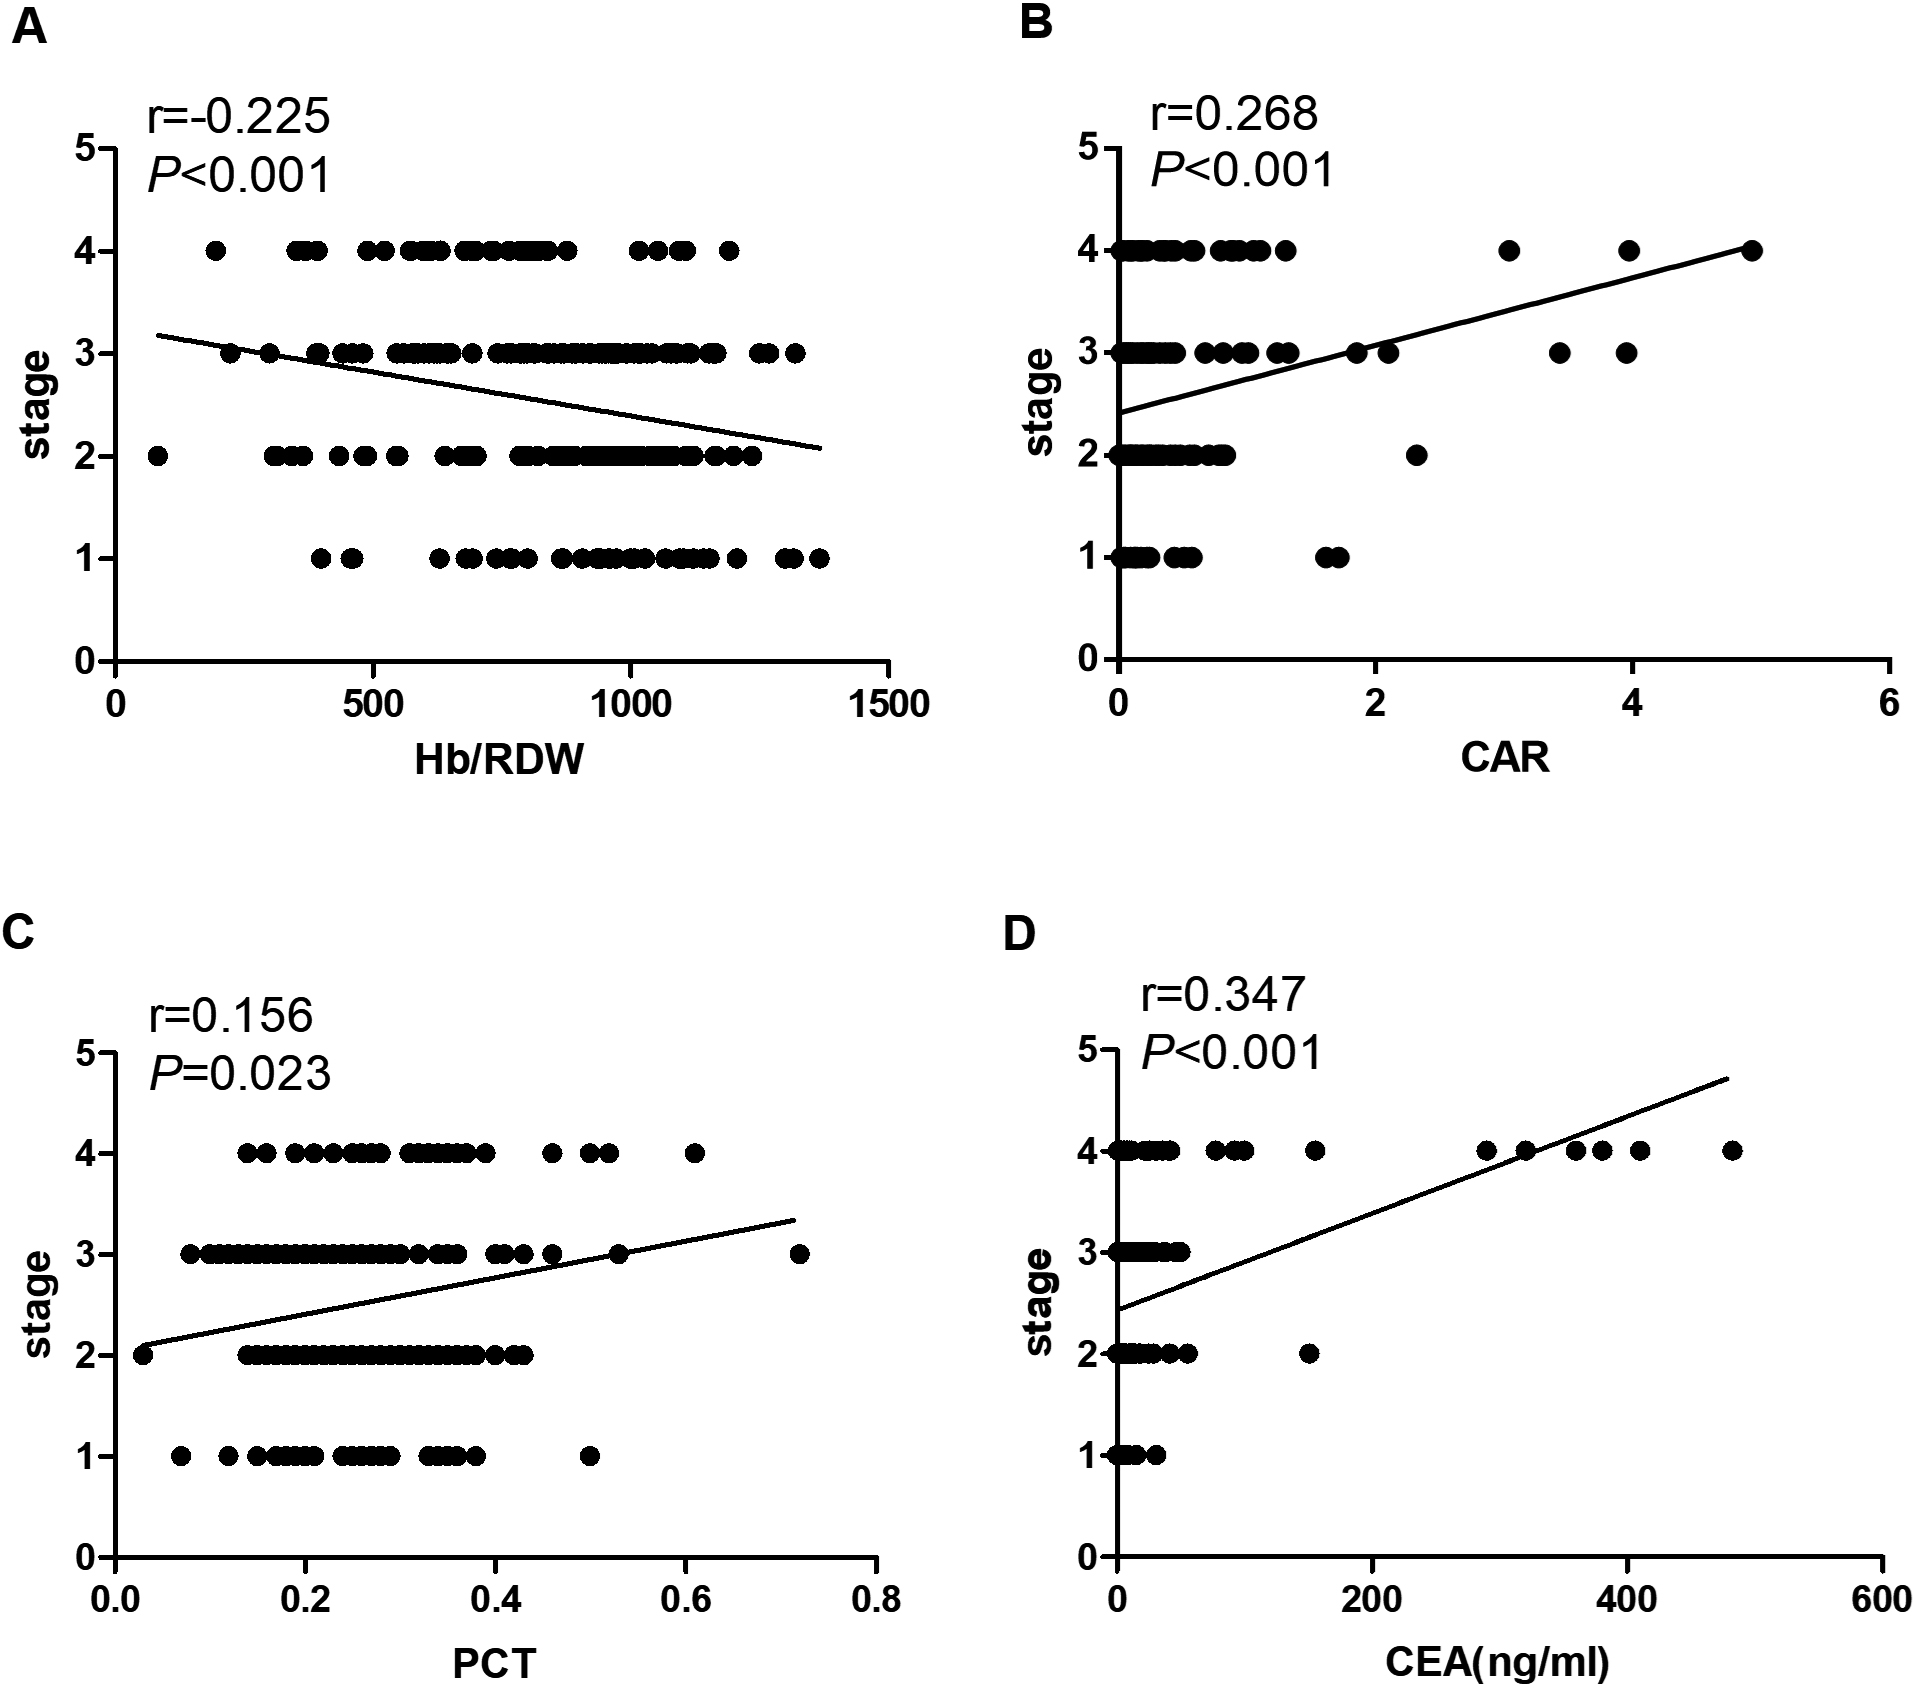
Figure 2.
Correlation analysis between Hb/RDW (A), CAR (B), PCT (C), CEA (D) and stages. The number 1, 2, 3, 4 in the stage represents the TNM stage of CRC: I II III IV. Abbreviations: CAR, C-reactive protein to leukocyte ratio; CEA, carcinoembryonic antigen; Hb/RDW, hemoglobin/red cell distribution width ratio; PCT, plateletcrit.
3.Results
The CRC group comprised 212 patients (134 men (63.21%) and 78 women (36.79%)) with a mean age of 58.89
3.1The relationship between Hb/RDW, CAR, PCT, CEA and clinicopathological features in CRC
Hb/RDW, CAR, PCT, and CEA were significantly different among the four groups (all
Table 3
Univariate and multivariate logistic regression analyses of risk factors
| Univariate analysis | Multivariate analysis | |
|---|---|---|
| Parameters |
|
|
| Hb/RDW | ||
| CAR | ||
| PCT | ||
| CEA |
Abbreviations: CAR, C-reactive protein/albumin ratio; CEA, carcinoembryonic antigen; Hb/RDW, hemoglobin/red cell distribution width ratio; PCT, plateletcrit.
Table 4
Diagnostic efficiency of single and combed use CAR, Hb/RDW, PCT and CEA for distinguishing CRC from other cancers, BCL or healthy controls
| CRC vs. BCL | CRC vs. other cancers | CRC vs. healthy controls | |||||||
|---|---|---|---|---|---|---|---|---|---|
| Indicators | Sen | Sp | AUC | Sen | Sp | AUC | Sen | Sp | AUC |
| Hb/RDW | 77.83 | 23.44 | 0.503 | 28.77 | 87.39 | 0.567 | 52.36 | 96.77 | 0.792 |
| Hb/RDW | 46.23 | 92.82 | 0.735 | 55.66 | 78.38 | 0.693 | 74.06 | 95.97 | 0.892 |
| CAR | 59.91 | 60.77 | 0.614 | 59.91 | 85.59 | 0.755 | 58.02 | 98.39 | 0.816 |
| CAR | 58.49 | 79.90 | 0.748 | 74.06 | 75.68 | 0.790 | 69.81 | 98.92 | 0.893 |
| PCT | 58.02 | 77.51 | 0.713 | 44.34 | 77.48 | 0.623 | 39.15 | 100 | 0.672 |
| PCT | 51.42 | 96.17 | 0.807 | 57.55 | 81.08 | 0.710 | 67.45 | 94.09 | 0.857 |
Abbreviations: AUC, area under the receiver operating characteristic curve; BCL, benign colorectal lesions; CAR, C-reactive protein/albumin ratio; CEA, carcinoembryonic antigen; CRC, colorectal cancer; Hb/RDW, hemoglobin/red cell distribution width ratio; PCT, plateletcrit; Sen, Sensitivity; Sp, Specificity.
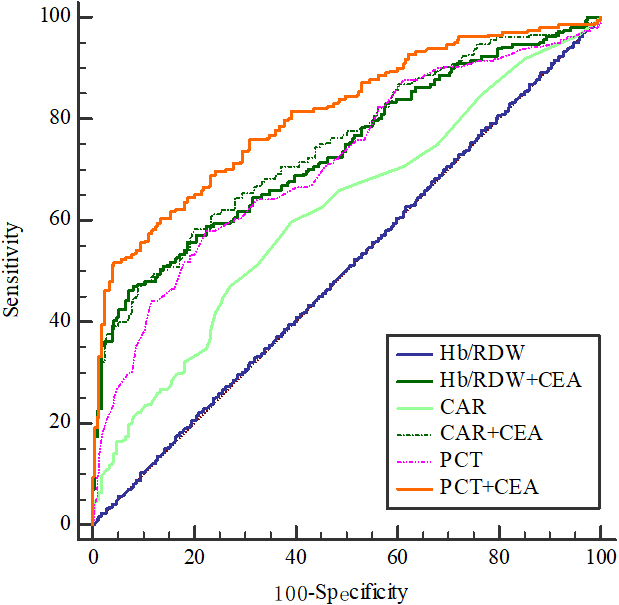
Figure 3.
Hb/RDW, CAR and PCT combined with CEA for distinguishing CRC from BCL as analyzed using the ROC curve analysis. Abbreviations: BCL, benign colorectal lesions; CAR, C-reactive protein to leukocyte ratio; CEA, carcinoembryonic antigen; CRC, colorectal cancer; Hb/RDW, hemoglobin/red cell distribution width ratio; PCT, plateletcrit.
Moreover, there were significant differences in Hb/RDW, CAR among different stages, and T-N-M stages in the CRC group (all
3.2Multivariate logistic regression analysis was used to analyze the parameters of colorectal cancer and healthy subjects
Multivariate logistic regression showed that low level of Hb/RDW (
3.3Diagnostic value of Hb/RDW, CAR and PCT combined with CEA for distinguishing CRC from other cancers, BCL or healthy controls
The AUC of Hb/RDW
The AUC of Hb/RDW
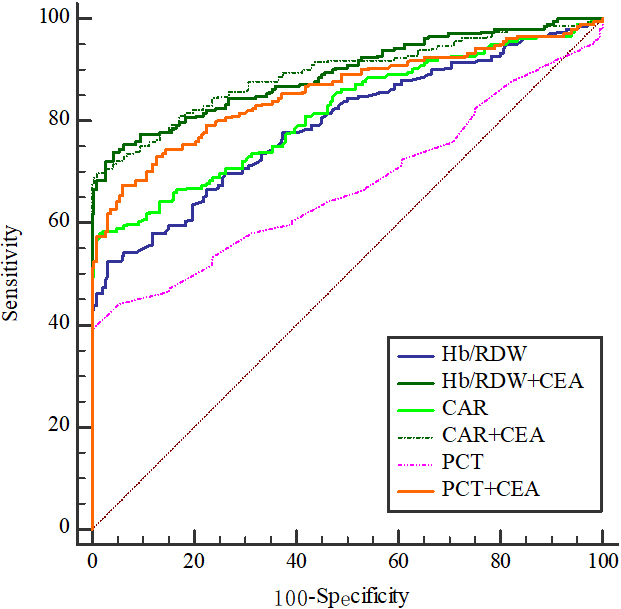
Figure 4.
Hb/RDW, CAR and PCT combined with CEA for distinguishing CRC from healthy controls as analyzed using the ROC curve analysis. Abbreviations: CAR, C-reactive protein to leukocyte ratio; CEA, carcinoembryonic antigen; CRC, colorectal cancer; Hb/RDW, hemoglobin/red cell distribution width ratio; PCT, plateletcrit.
Additionally, the AUC of Hb/RDW
4.Discussion
The annual incidence of CRC has continuously increased [11]. Given that patients are generally asymptomatic during the early stage of the disease, CRC diagnosis is usually delayed, and most patients are diagnosed at an advanced stage. In such cases, the survival rate is less than 28% [12]. However, the 5-year survival rate is higher than 60% for patients with early diagnosed CRC.
Studies have shown that inflammation is closely related to malignant tumors, and some inflammatory indicators, such as CAR and PCT, can be used for prognostic assessment of CRC [13, 14, 15]. Other inflammatory indicators such as CRP have also been reported to be closely associated with tumor size [16]. Inflammatory cells play an important role in the proliferation and development of tumors and reflect the progression of tumors by increasing the secretion of cytokines.
CRP increases markedly during infections; it can enhance the function of phagocytic cells to remove dead cells and tumor cells. Alb is an indicator of nutritional status. In CRC patients, excessive consumption of nutrients in the body and interactions between tumors and inflammation mediators lead to accelerated catabolism, decreased Alb levels, and poor nutritional status [17]. Therefore, CAR is used in combination with CRP and Alb to monitor the prognosis of digestive tract malignancies [4, 18, 19]. In this study, CAR was higher in the CRC group than that in the BCL, other cancers, and healthy control groups. CAR was positively correlated with staging of CRC, and showed differences in lymph node metastasis and distant metastasis, which is similar to the findings of Meng and Ishizuka et al. [19, 20].
A study by Connolly et al. [21] reported that thrombosis is an important cause of progression in most cancers. PCT is a PLT indicator closely associated with inflammation-related diseases and can be used to monitor changes in the disease state of ulcerative colitis [22]. Studies have shown that PCT is helpful in the assessment of cancer-related pathological conditions [23], and can also be used as a diagnostic indicator of autoimmune gastritis, functional dyspepsia [24], and benign and malignant thyroid diseases [25]. Ma et al. [26] and Ozaksit et al. [27] showed that high levels of PCT have certain significance in distinguishing ovarian cancer tumors patients from benign lesions.
In this study, the PCT was higher in the CRC group than that in the other three groups, which is consistent with the previous view that the levels of inflammatory factors are elevated in cancer onset. We also found that PCT was positively correlated with staging; PCT was significantly different in varying tumor stages, depth of invasion, distant metastasis, and these findings are similar to those reported by Mahdavi-Zafarghandi et al. [26] and Ozaksit et al. [27]. This suggests that PCT may be a potential marker of CRC progression.
Hb/RDW has been used to evaluate the prognosis of head and neck tumors and esophageal squamous cell carcinoma [9, 10]. In our study, Hb/RDW in the CRC group was significantly lower than that in the other three groups. Hb/RDW was also significantly different in varying tumor stages, depth of invasion, lymph node metastasis, and distant metastasis. We also found Hb/RDW was negatively correlated with staging of CRC, decreased Hb/RDW ratio was associated with advanced CRC, which was similar to Sun et al. [9]. Obviously, a low Hb/RDW was indicative of aggressive tumor behavior and advanced tumor stage. Low levels of Hb may accelerate tumor angiogenesis by causing hypoxia, and is associated with tumor invasion, metastasis [28]. Increased RDW is reportedly associated with systemic inflammation, which might be mediated by inflammation [29, 30]. All of which suggest that Hb/RDW has higher value for clinical pathological staging of CRC. Additionally, among these indicators, Hb/RDW has the highest sensitivity for distinguishing CRC from BCL (77.83%); Hb/RDW combined with CEA has the highest sensitivity for distinguishing CRC from healthy controls (74.06%).
CEA is a glycosylated protein expressed on the surface of tumor cells and is often used as a diagnostic marker for gastrointestinal tumors, such as CRC and gastric cancer [31, 32, 33]. In this study, the CEA level in the CRC group was significantly higher than that in the BCL and healthy control group. This finding is similar to the results reported by Rao et al. [34].
In addition, multivariate logistic regression showed that low level of Hb/RDW and high level of CAR, CEA, PCT were risk factors for CRC. To sum up, Hb/RDW, CAR, and PCT combined with CEA yielded a greater AUC than that of Hb/RDW, CAR, and PCT alone in distinguishing CRC from BCL or healthy controls, and their specificity have increased. Furthermore, Hb/RDW, CAR, PCT, CEA are all related to the pathological stage of CRC, indicating that changes in their values are closely associated to the progress of CRC. Therefore, Hb/RDW, CAR, and PCT combined with CEA have significant value for differential diagnosis of CRC and BCL, and the specificity of Hb/RDW, CAR and PCT combined with CEA were improved in the diagnosis of CRC.
This study has some limitations, including its single-center, retrospective design. However, this study is valuable in that it explored the value of Hb/RDW, CAR, and PCT combined with CEA in the auxiliary differential diagnosis of CRC. All of them are easy to detect clinically, and their combination has better auxiliary diagnostic efficacy than used alone, especially with Hb/RDW. Moreover, Hb/RDW was used for the first study to diagnostically evaluate CRC.
Ethical approval
The study protocol (Approval Number: 2021 (KY-E-339)) was approved by the Ethics Committee of the First Affiliated Hospital of Guangxi Medical University, and all the participants were orally informed and agreed.
Funding statement
This study did not receive any funding in any form.
Competing interest
The authors have declared that no competing interest exists.
Availability of data and materials
The data generated in the present study are included in the figures and/or tables of this article.
Patient consent for publication
The manuscript did not contain the patient’s identity information, and all participants agreed to publish.
Authors’ contributions
Conception: ZX, LFQ.
Interpretation or analysis of data: ZX, WYY, QYY.
Preparation of the manuscript: WYY, QYY.
Revision for important intellectual content: ZX, WYY, QYY, LFQ.
Supervision: LFQ.
Abbreviations
Alb, albumin; AUC (95% CI), Area under the ROC curve (95% Confidence interval); BCL, benign colorectal lesions; CAR, C-reactive protein/albumin ratio; CEA, carcinoembryonic antigen; CRC, colorectal cancer; CRP, C-reactive protein; Hb, Hemoglobin; Hb/RDW, hemoglobin/red cell distribution width ratio; PCT, plateletcrit; PLT, platelet; RDW, red cell distribution width.
Acknowledgments
We would like to thank Key Laboratory of Clinical Laboratory Medicine of Guangxi Department of Education, Department of Clinical Laboratory, The First Affiliated Hospital of Guangxi Medical University, China.
Conflict of interest
The authors declare that they have no conflict of interest.
References
[1] | E. Dekker, P.J. Tanis, J.L.A. Vleugels et al., Colorectal cancer, Lancet 394: (10207) ((2019) ), 1467–1480. |
[2] | R. Khandia and A. Munjal, Interplay between inflammation and cancer, Adv Protein Chem Struct Biol 119: ((2020) ), 199–245. |
[3] | H. Kuper, H.O. Adami and D. Trichopoulos, Infections as a major preventable cause of human cancer, J Intern Med 248: (3) ((2000) ), 171–183. |
[4] | L. Yue, Y. Lu, Y. Li et al., Prognostic value of c-reactive protein to albumin ratio in gastric cancer: A meta-analysis, Nutr Cancer 73: (10) ((2021) ), 1864–1871. |
[5] | S. Martin, T. Mustata, O. Enache et al., Platelet activation and inflammation in patients with papillary thyroid cancer, Diagnostics (Basel) 11: (11) ((2021) ). |
[6] | P. Wang, Y. Piao, X. Zhang et al., The concentration of CYFRA 21-1, NSE and CEA in cerebro-spinal fluid can be useful indicators for diagnosis of meningeal carcinomatosis of lung cancer, Cancer Biomark 13: (2) ((2013) ), 123–130. |
[7] | S.T. Mcsorley, M. Johnstone, C.W. Steele et al., Normocytic anaemia is associated with systemic inflammation and poorer survival in patients with colorectal cancer treated with curative intent, Int J Colorectal Dis 34: (3) ((2019) ), 401–408. |
[8] | C. Shi, M. Xie, L. Li et al., The association and diagnostic value of red blood cell distribution width in colorectal cancer, Medicine (Baltimore) 98: (19) ((2019) ), e15560. |
[9] | P. Sun, F. Zhang, C. Chen et al., The ratio of hemoglobin to red cell distribution width as a novel prognostic parameter in esophageal squamous cell carcinoma: A retrospective study from southern China, Oncotarget 7: (27) ((2016) ), 42650–42660. |
[10] | T. Tham, C. Olson, M. Wotman et al., Evaluation of the prognostic utility of the hemoglobin-to-red cell distribution width ratio in head and neck cancer, Eur Arch Otorhinolaryngol 275: (11) ((2018) ), 2869–2878. |
[11] | F. Baidoun, K. Elshiwy, Y. Elkeraie et al., Colorectal cancer epidemiology: Recent trends and impact on outcomes, Curr Drug Targets 22: (9) ((2021) ), 998–1009. |
[12] | S. Liu, R. Zheng, M. Zhang et al., Incidence and mortality of colorectal cancer in China, 2011, Chin J Cancer Res 27: (1) ((2015) ), 22–28. |
[13] | W. Qian, X.X. Ge, J. Wu et al., Prognostic evaluation of resectable colorectal cancer using platelet-associated indicators, Oncol Lett 18: (1) ((2019) ), 571–580. |
[14] | J. Zhou, W. Wei, H. Hou et al., Prognostic value of c-reactive protein, glasgow prognostic score, and c-reactive protein-to-albumin ratio in colorectal cancer, Front Cell Dev Biol 9: ((2021) ), 637650. |
[15] | C.K. Liao, Y.L. Yu, Y.C. Lin et al., Prognostic value of the c-reactive protein to albumin ratio in colorectal cancer: An updated systematic review and meta-analysis, World J Surg Oncol 19: (1) ((2021) ), 139. |
[16] | M. Shibutani, K. Maeda, H. Nagahara et al., Prognostic significance of the preoperative serum c-reactive protein level in patients with stage IV colorectal cancer, Surg Today 45: (3) ((2015) ), 315–321. |
[17] | M. Yamamoto, H. Saito, C. Uejima et al., Combination of serum albumin and cholinesterase levels as prognostic indicator in patients ith colorectal cancer, Anticancer Res 39: (2) ((2019) ), 1085–1090. |
[18] | Y. Bao, J. Yang, Y. Duan et al., The c-reactive protein to albumin ratio is an excellent prognostic predictor for gallbladder cancer, Biosci Trends 14: (6) ((2021) ), 428–435. |
[19] | Y. Meng, C. Long, X. Huang et al., Prognostic role and clinical significance of c-reactive protein-lymphocyte ratio in colorectal cancer, Bioengineered 12: (1) ((2021) ), 5138–5148. |
[20] | M. Ishizuka, H. Nagata, K. Takagi et al., Clinical significance of the c-reactive protein to albumin ratio for survival after surgery for colorectal cancer, Ann Surg Oncol 23: (3) ((2016) ), 900–907. |
[21] | G.C. Connolly, R.P. Phipps and C.W. Francis, Platelets and cancer-associated thrombosis, Semin Oncol 41: (3) ((2014) ), 302–310. |
[22] | Z.A. Ozturk, M.S. Dag, M.E. Kuyumcu et al., Could platelet indices be new biomarkers for inflammatory bowel diseases? Eur Rev Med Pharmacol Sci 17: (3) ((2013) ), 334–341. |
[23] | R.P. Roop, M.J. Naughton, C. Van Poznak et al., A randomized phase II trial investigating the effect of platelet function inhibition on circulating tumor cells in patients with metastatic breast cancer, Clin Breast Cancer 13: (6) ((2013) ), 409–415. |
[24] | A. Tuzun, O. Keskin, M. Yakut et al., The predictive value of mean platelet volume, plateletcrit and red cell distribution width in the differentiation of autoimmune gastritis patients with and without type I gastric carcinoid tumors, Platelets 25: (5) ((2014) ), 363–366. |
[25] | O. Dincel and C. Bayraktar, Evaluation of platelet indices as a useful marker in papillary thyroid carcinoma, Bratisl Lek Listy 118: (3) ((2017) ), 153–155. |
[26] | R. Mahdavi-Zafarghandi, B. Shakiba, M.R. Keramati et al., Platelet volume indices in patients with varicocele, Clin Exp Reprod Med 41: (2) ((2014) ), 92–95. |
[27] | G. Ozaksit, A. Tokmak, H. Kalkan et al., Value of the platelet to lymphocyte ratio in the diagnosis of ovarian neoplasms in adolescents, Asian Pac J Cancer Prev 16: (5) ((2015) ), 2037–2041. |
[28] | Y. Gon, D. Kabata, T. Kawano et al., Hematological abnormalities and malnutrition mediate pathway between cancer and outcomes in ischemic stroke patients, J Stroke Cerebrovasc Dis 29: (8) ((2020) ), 104943. |
[29] | X. Fan, H. Deng, X. Wang et al., Association of red blood cell distribution width with severity of hepatitis B virus-related liver diseases, Clin Chim Acta 482: ((2018) ), 155–160. |
[30] | H.S. Seth, P. Mishra, J.V. Khandekar et al., Relationship between high red cell distribution width and systemic inflammatory response syndrome after extracorporeal circulation, Braz J Cardiovasc Surg 32: (4) ((2017) ), 288–294. |
[31] | N.N. Mahmoud, Colorectal cancer: Preoperative evaluation and staging, Surg Oncol Clin N Am 31: (2) ((2022) ), 127–141. |
[32] | Y. Miki, M. Yashiro, K. Kuroda et al., Circulating CEA-positive and EpCAM-negative tumor cells might be a predictive biomarker for recurrence in patients with gastric cancer, Cancer Med 10: (2) ((2021) ), 521–528. |
[33] | R. Jing, M. Cui, S. Ju et al., The Changes and Clinical Significance of Preoperative and Postoperative Serum CEA and CA19-9 in Gastric Cancer, Clin Lab 66: (4) ((2020) ). |
[34] | H. Rao, H. Wu, Q. Huang et al., Clinical Value of Serum CEA, CA24-2 and CA19-9 in Patients with Colorectal Cancer, Clin Lab 67: (4) ((2021) ). |


