
Analysis of clinical significance and molecular characteristics of methionine metabolism and macrophage-related patterns in hepatocellular carcinoma based on machine learning
Abstract
BACKGROUND:
Increasing evidence has indicated that abnormal methionine metabolic activity and tumour-associated macrophage infiltration are correlated with hepatocarcinogenesis. However, the relationship between methionine metabolic activity and tumour-associated macrophage infiltration is unclear in hepatocellular carcinoma, and it contributes to the occurrence and clinical outcome of hepatocellular carcinoma (HCC). Thus, we systematically analysed the expression patterns of methionine metabolism and macrophage infiltration in hepatocellular carcinoma using bioinformatics and machine learning methods and constructed novel diagnostic and prognostic models of HCC.
METHODS:
In this study, we first mined the four largest HCC mRNA microarray datasets with patient clinical data in the GEO database, including 880 tissue mRNA expression datasets. Using GSVA analysis and the CIBERSORT and EPIC algorithms, we quantified the methionine metabolic activity and macrophage infiltration degree of each sample. WGCNA was used to identify the gene modules most related to methionine metabolism and tumour-associated macrophage infiltration in HCC. The KNN algorithm was used to cluster gene expression patterns in HCC. Random forest, logistic regression, Cox regression analysis and other algorithms were used to construct the diagnosis and prognosis model of HCC. The above bioinformatics analysis results were also verified by independent datasets (TCGA-LIHC, ICGC-JP and CPTAC datasets) and immunohistochemical fluorescence based on our external HCC panel. Furthermore, we carried out pancancer analysis to verify the specificity of the above model and screened a wide range of drug candidates.
RESULTS:
We identified two methionine metabolism and macrophage infiltration expression patterns, and their prognoses were different in hepatocellular carcinoma. We constructed novel diagnostic and prognostic models of hepatocellular carcinoma with good diagnostic efficacy and differentiation ability.
CONCLUSIONS:
Methionine metabolism is closely related to tumour-associated macrophage infiltration in hepatocellular carcinoma and can help in the clinical diagnosis and prognosis of HCC.
1.Introduction
In 2021, the number of new cases of liver cancer in China ranked fifth among tumours, with approximately 410,000 and 320,000 deaths [1]. Most of the early clinical symptoms of liver cancer are hidden, and 70% of liver cancer is diagnosed at advanced stages. The targeted treatment scheme is limited, the nonresponse rate is high, and there are many side effects of drugs [2]. Hepatocellular carcinoma (HCC) is the most common type of liver cancer. Therefore, it is urgent to further explore the occurrence and mechanism of development of HCC, to identify molecular patterns of HCC, and to formulate hierarchical management methods for HCC [3].
Metabolic reprogramming is one of the basic characteristics of most tumours, including HCC [4]. Initially, scientific researchers found that due to the need for rapid metabolism and the use of metabolites to support various biosynthesis pathways, tumours showed dependence on glycolysis [5]. Researchers have successively found that the metabolism of other biological macromolecules also plays an important role in the cancer process. Fatty acid metabolism is involved in intracellular signal transduction and cytoskeleton formation and plays a key role in the processes of tumour drug resistance and ferroptosis [6]. Glutamine metabolism is regarded as another major energy source of tumours in addition to glucose [7]. By competing with T lymphocytes for glutamine, tumour cells not only promote their own growth but also inhibit the normal function of immune cells. Even some small molecules regarded as metabolic waste in previous studies, such as lactic acid and
The life activities of tumour cells in vivo cannot be separated from the support provided in the tumour microenvironment. Tumour-associated macrophages (TAMs) have been regarded as the most critical immune microenvironment component in tumors [11]. Tumour-associated macrophages can play various roles through the secretion of soluble cytokines and metabolic substrates and direct antigen receptor binding, and recent studies have found that their secreted exosomes are important [12]. Current studies have found that tumour-associated macrophages are involved in almost all malignant behaviours of tumors [13]. Scientists and our previous studies have revealed that metabolism, such as glycolysis and m6A and other methyl donor-dependent apparent modifications, is involved in the regulation of TAMs in HCC [14]. These studies suggest a correlation between methionine metabolism and tumour-associated macrophages. However, there are few studies on the relationship between methionine metabolism and TAMs in HCC, which still needs to be further explored.
In this study, we combined more than 1000 HCC samples from multiple datasets in the GEO, TCGA and ICGC databases and used machine learning K-means to identify two HCC patterns related to macrophage and methionine metabolism. Based on bioinformatics analysis, we explored the molecular characteristics of these two patterns and found that they are related to tumour prognosis. Finally, we also used random forest, SVM and multivariate Cox regression analyses to construct the diagnosis and prognosis model of HCC, which further enriched the clinical value of this study.
2.Material and methods
2.1Data acquisition and processing
mRNA expression and patient clinical data were downloaded from the gene expression omnibus (GEO) database (GSE14520, GSE54236, GSE76427, and GSE116174), The Cancer Genome Atlas (TCGA) database [15] (TCGA-LIHC dataset), Genotype-Tissue Expression (GTEX) database (GTEX liver dataset) [16], and International Cancer Genome Consortium (ICGC) database (ICGC-JP dataset) [17]. Batch calibration of different datasets was accomplished using the “SVA” (3.1.1) R package. Gene difference analysis was performed in the form of count data and corrected using the limma software package. Downstream function analysis utilized the form of TPM data. Differential expression analysis was performed using the “LIMMA” (3.54.1) R software package. The protein expression data of HCC patients were downloaded from the Clinical Proteomic Tumor Analysis Consortium (CPTAC) database [18].
2.2Identification of methionine metabolism- and macrophage-related gene modules
The methionine metabolic pathway score was based on the Kyoto Encyclopedia of Genes and Genomes (KEGG) downloaded dataset (Table S1) and the “GSVA” (1.46.0) R package for quantitative scoring [20]. Tumour-associated macrophages in the HCC group were quantified using the previously published “EPIC” and “CIBERSORT” algorithms [20]. The “WGCNA” (1.68) R package was used for weighted correlation network analysis (WGCNA), and an appropriate soft threshold was chosen to cluster genes with similar coexpression in the same module [19]. Methionine metabolism and macrophage infiltration data were combined with the above modules to identify related gene clusters.
2.3Recognition of methionine metabolism- and macrophage-related gene expression patterns in hepatocellular carcinoma
The aforementioned identified gene sets were subjected to prognostic correlation analysis, and the critical value of p was less than 0.05. Then, the K-means algorithm was used to identify the above gene expression patterns in GEO meta-datasets using the “ConsensusClusterPlus” (1.58.0) R software package [19]. The same algorithm was used to verify the above results in the TCGA-LIHC dataset.
2.4Functional prediction analysis of the different gene patterns
In the different gene patterns identified above, the differences in signalling pathways and immune cell infiltration among different subgroups were evaluated by using the “clusterProfiler” (4.2.2) R package and “CIBERSORT” algorithm 20. The “survival” (3.5-0) R package was used for survival analysis [19].
2.5Construction of the diagnostic and prognostic model
The aforementioned 47 related genes used for genotyping were further analysed for differences, and the cut-off value was an absolute value of logFC greater than 1. Based on 5x cross validation, a diagnosis model was constructed by using random forest and logistic regression, and a ROC curve was used for diagnosis efficiency. We verified the above built models in the independent TCGC-LIHC, ICGC-JP and CPTAC datasets. The prognostic model was used to analyse the prognosis of the aforementioned 47 genes in the TCGA-LIHC dataset, and a total of 21 prognostic genes were identified. Screening of important variables was accomplished with lasso regression analysis. Multivariate Cox regression analysis was used to construct a prognostic model, and the aforementioned model was validated in the TCGA-LIHC dataset and the independent ICGC-JP dataset [21].
2.6Evaluation of drug effects
The CTRP2.0 database, which contains the sensitivity data for 481 compounds over 835 CCLs, and the PRISM database, which contains the sensitivity data for 1448 compounds over 482 CCLs, were used to evaluate the efficacy of compounds according to K-nearest neighbour (KNN) imputation. The top and bottom 20% of the high and low subgroups were used as cut-off points. The specific methods were described by Shixue Dai et al. [22].
2.7Immunohistofluorescence
Samples were prepared through gradient dehydration of paraffin sections and EDTA antigen thermal repair. Primary antibody (MAT1A, affinity cat. DF12210, dilution 1:200 with TBST; and CD68, Proteintech cat. 3A9A7, dilution 1:300 with TBST) was incubated overnight. After three washes with PBS, immunofluorescence secondary antibody (FITC Anti-Mouse, cat. Ab6785, dilution 1:500; Alexa Fluor® 647 Anti-Rabbit, cat. ab150083, dilution 1:500) was incubated at room temperature for 1Â h. The nuclei were stained with DAPI. All tissues were observed under a fluorescence microscope with the same intensity light source and exposure time for quantitative comparison.
2.8Statistical analysis
SPSS (22.0), R (4.1.0) and Python (3.4) software were used for statistical analysis. Unless otherwise indicated, a
Figure 1.
Identify genes related to methionine metabolism and macrophage infiltration. A. Flow chart of identification of genes related to macrophage and methionine metabolism. B. Identification of differentially expressed genes in hepatocellular carcinoma based on geo meta data set, the absolute value of FC was greater than 1.5, and the
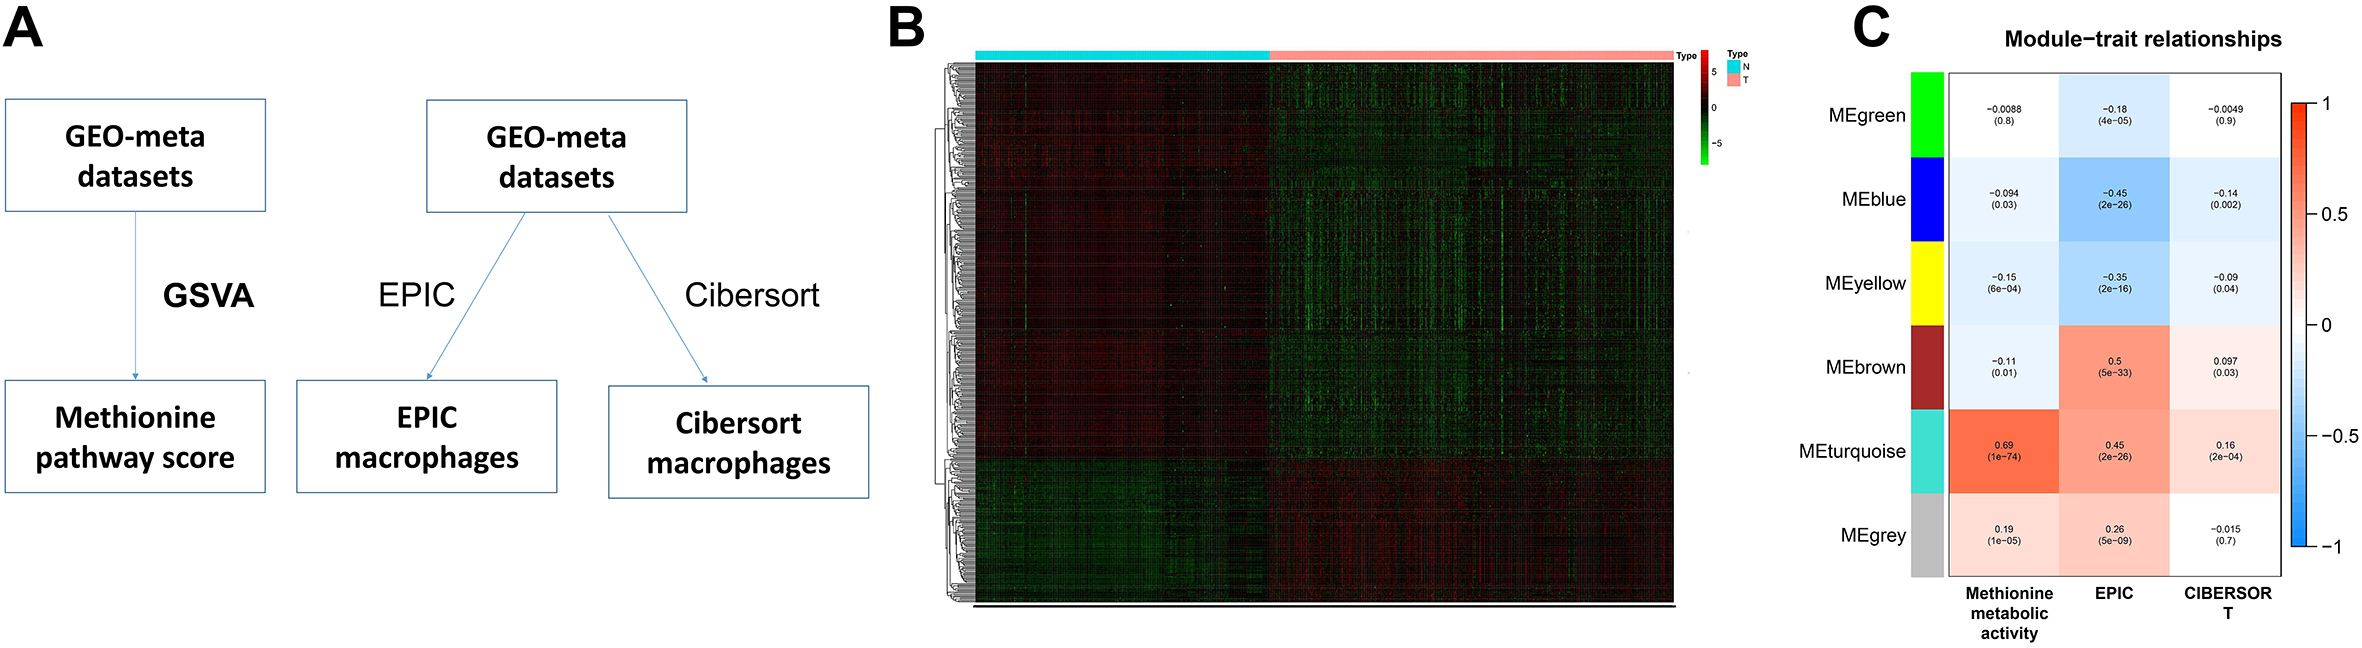
Figure 2.
Pattern recognition of tumor gene expression. A. Based on the 47 genes related to prognosis identified above, two gene expression patterns were identified by KNN analysis. B. PCA analysis further verified the aforementioned typing based on the expression of all genes. C. To analyze the difference of prognosis between the two models of HCC patients. D. In the TCGA-LIHC dataset, PCA analysis was used to verify the aforementioned typing results. E. In the TCGA-LIHC dataset, survival analysis verified the difference in the prognosis of the different modes mentioned above.
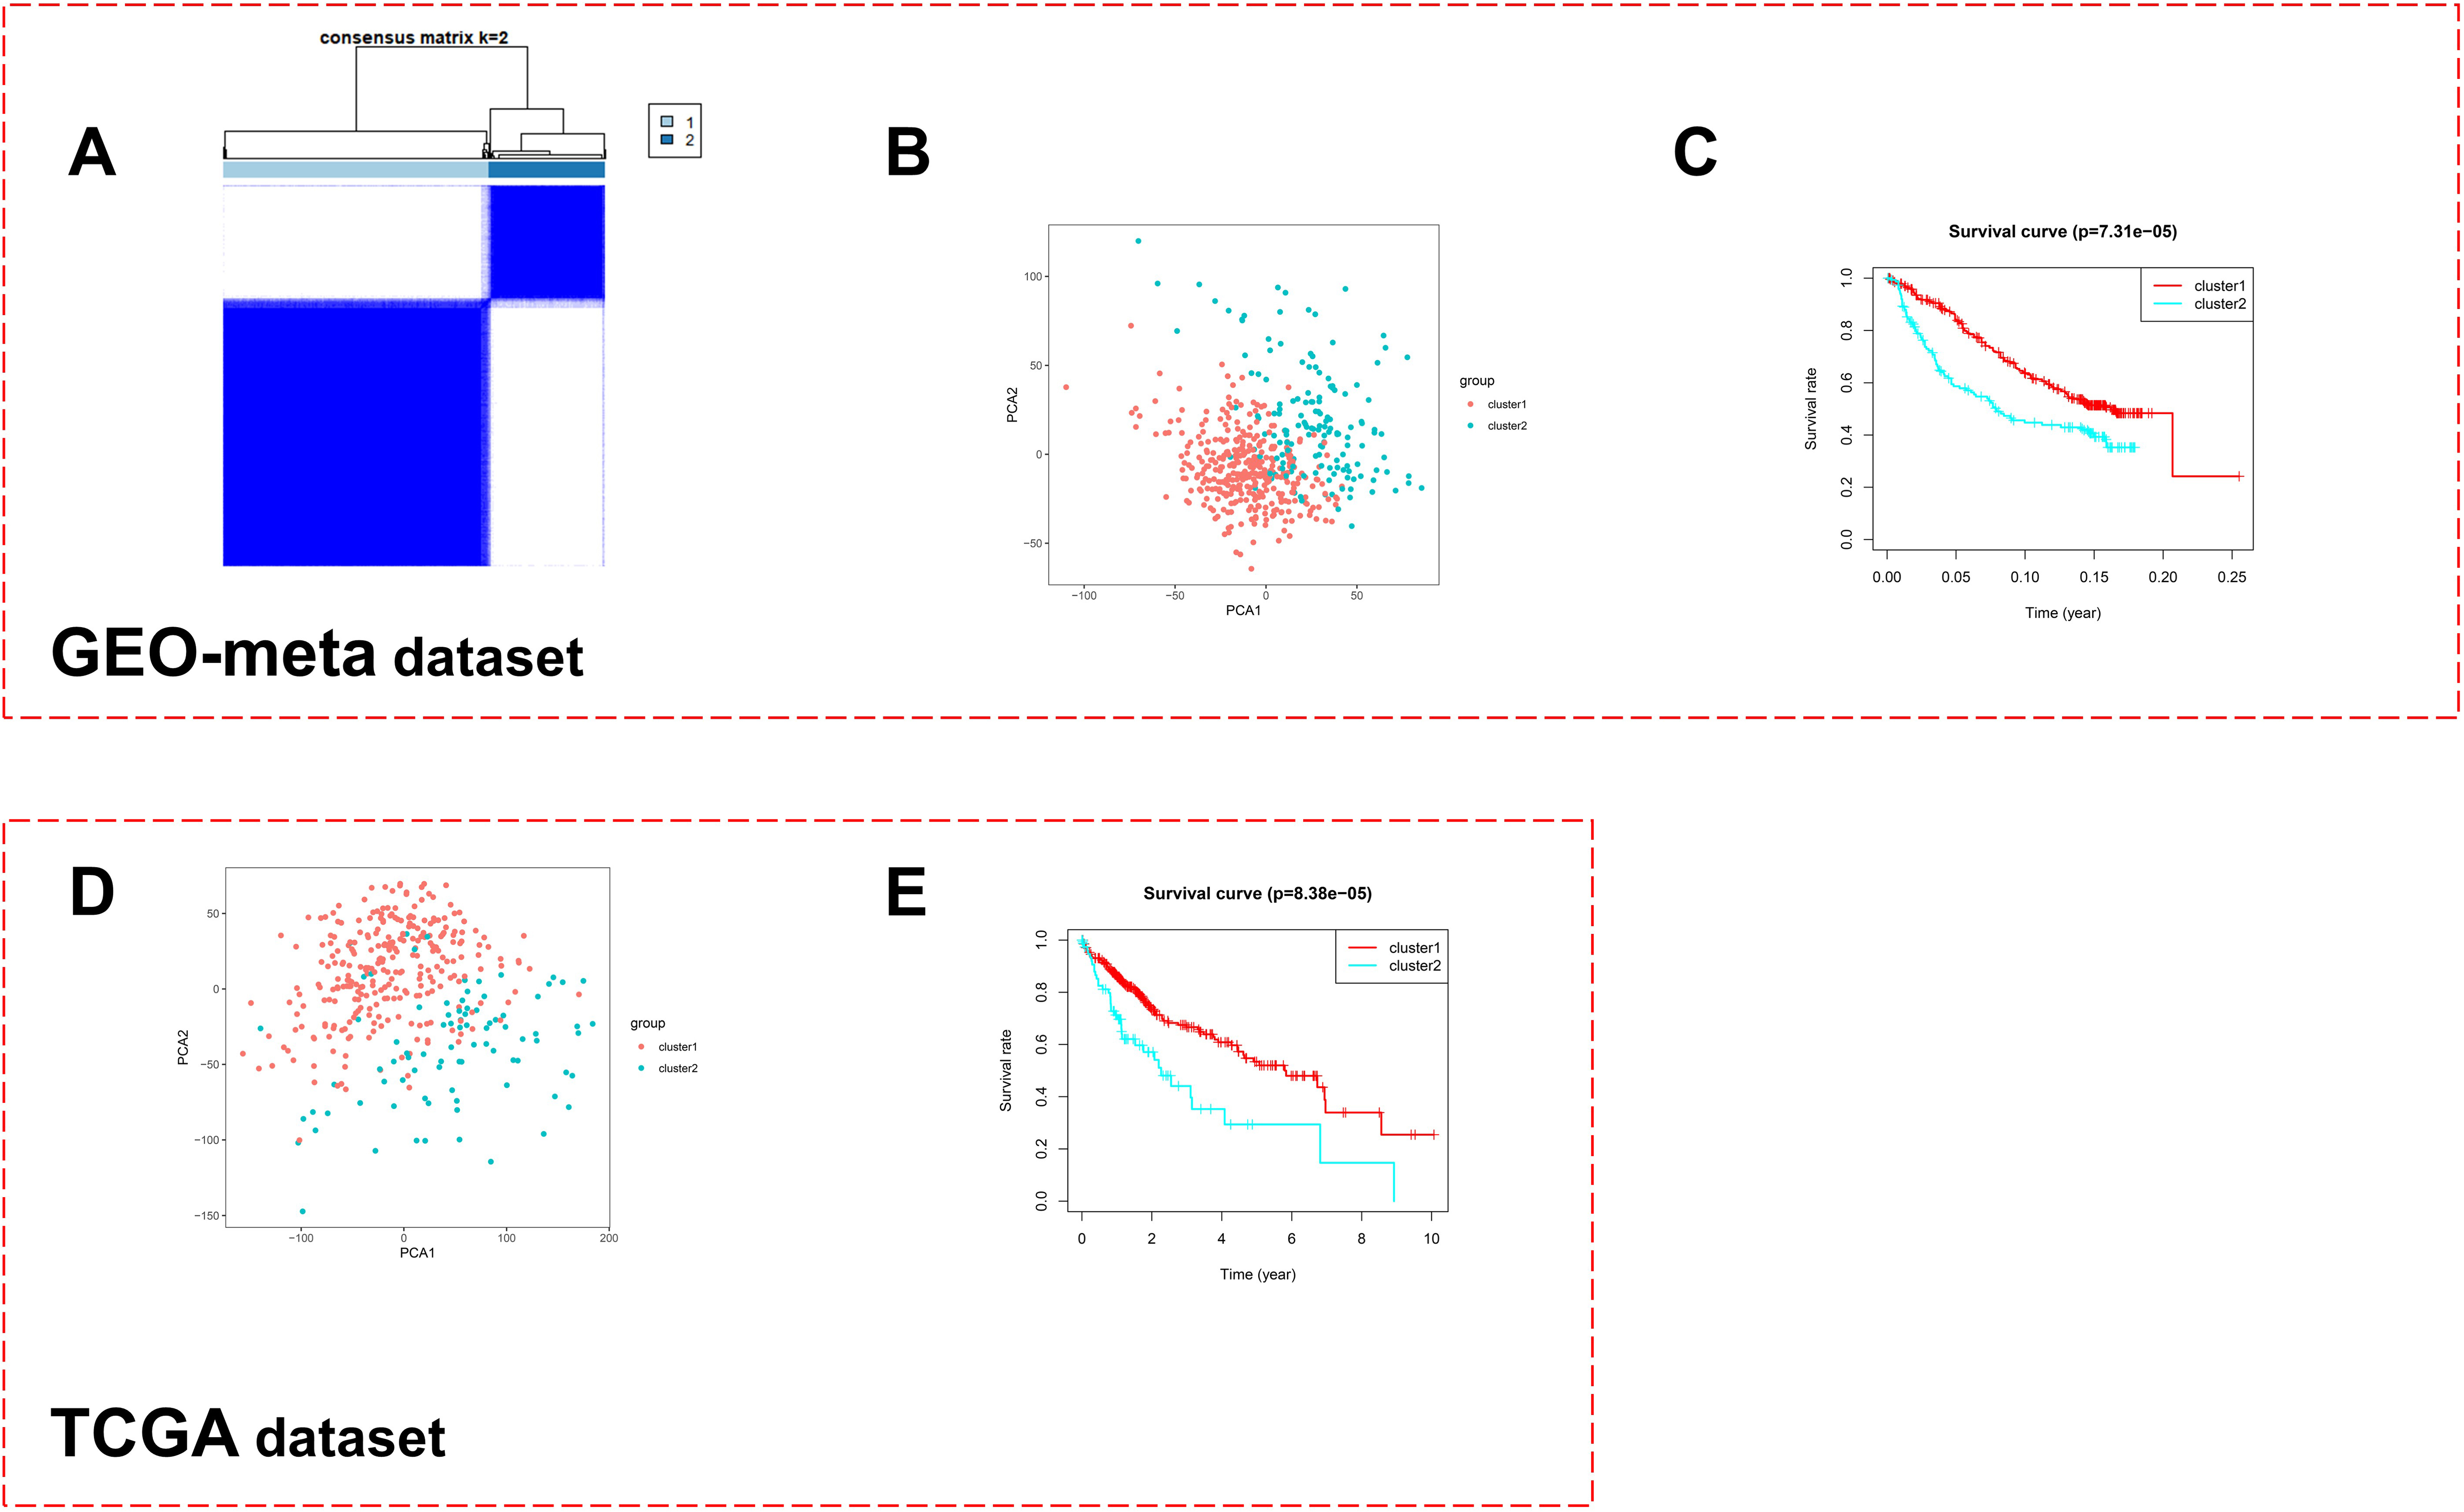
Figure 3.
Molecular characteristics of two expression patterns. A. Correlation analysis between two molecular expression patterns and clinical features in GEO-meta dataset. B. Difference of immune cell infiltration in hepatocellular carcinoma between two molecular expression patterns based on CIBESORT algorithm in GEO-meta dataset. C. Difference analysis of methionine metabolism activity and related gene expression between two molecular expression patterns in hepatocellular carcinoma in GEO-meta dataset. D. Analysis of the difference of KEGG signal pathway between two molecular expression patterns in hepatocellular carcinoma in GEO-meta dataset. E. Difference of immune cell infiltration in hepatocellular carcinoma between two molecular expression patterns based on CIBESORT algorithm in TCGA-LIHC dataset. F. Difference analysis of methionine metabolism activity and related gene expression between two molecular expression patterns in hepatocellular carcinoma in TCGA-LIHC dataset. G. Analysis of the difference of KEGG signal pathway between two molecular expression patterns in hepatocellular carcinoma in TCGA-LIHC dataset. H. Immunohistochemical fluorescence identifies the aforementioned gene expression pattern in the external HCC Panel (
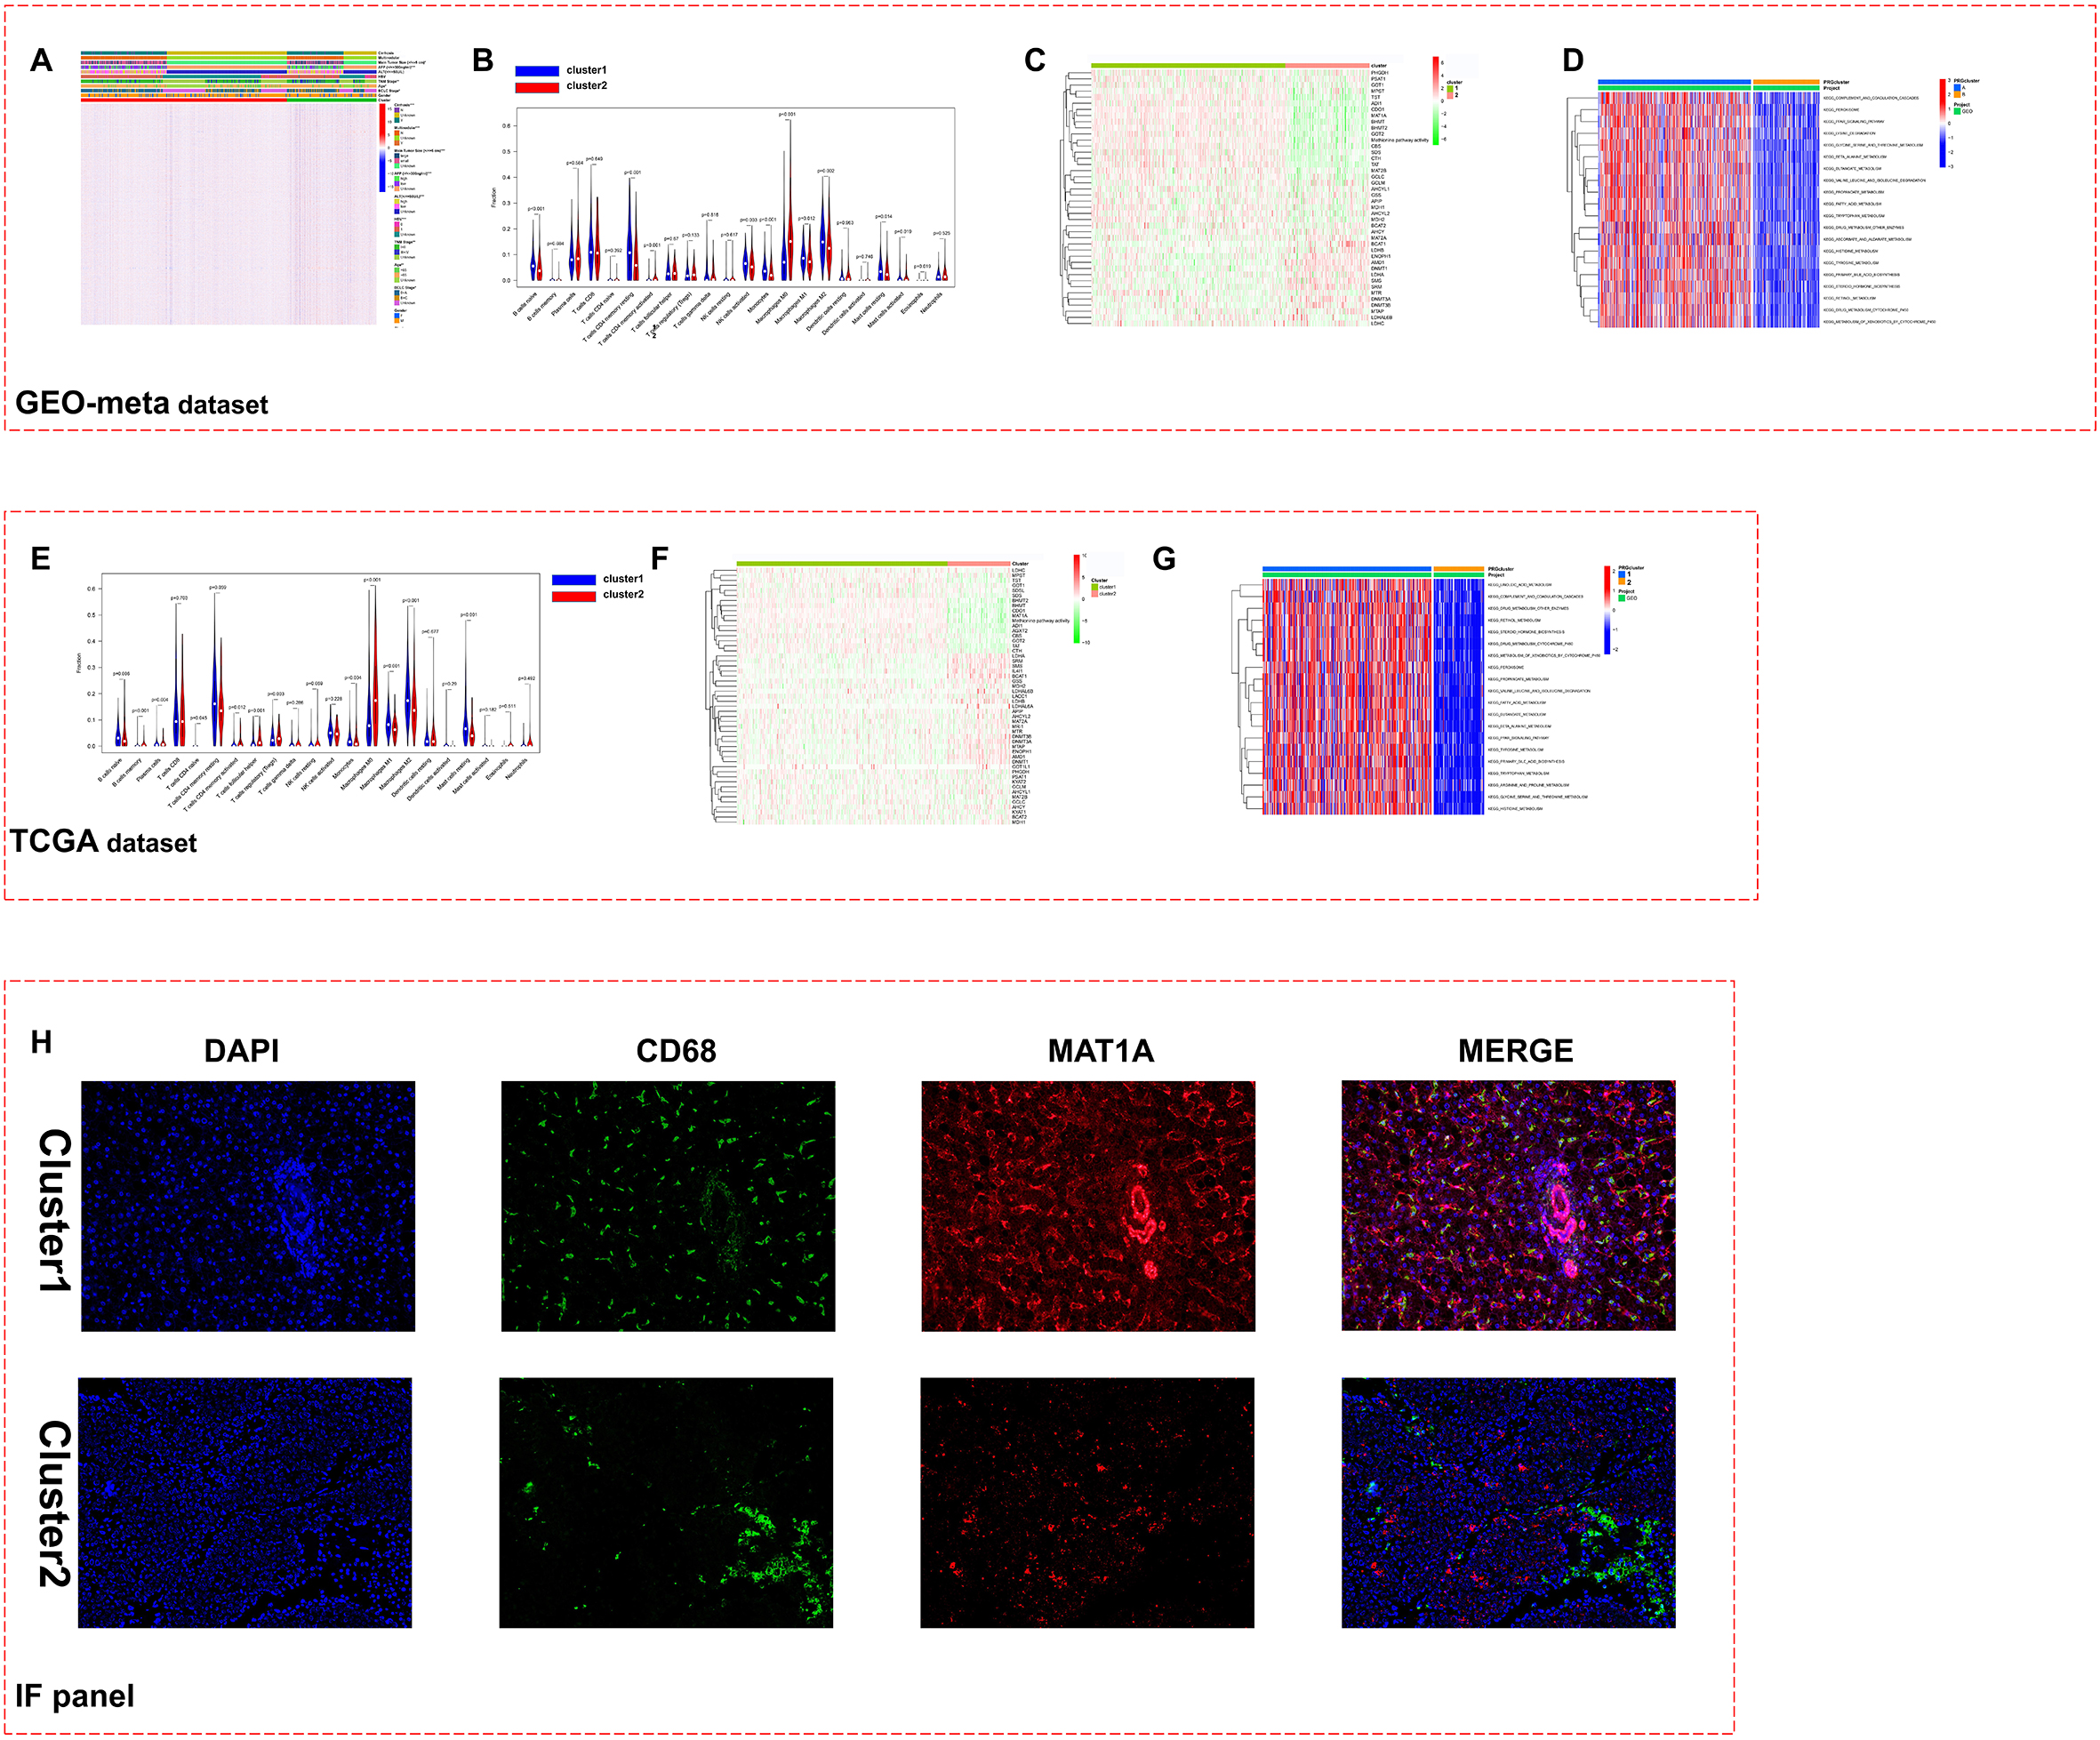
Figure 4.
Construct and validate the diagnosis model of HCC. A. Flow chart of diagnosis model construction and verification. B. The cutoff value is logfc greater than 1, and the differentially expressed genes are further identified in the aforementioned 47 genes. C. The diagnostic model was constructed by random forest and logistic regression, and the ROC curve was used to evaluate the diagnostic efficiency. D. Verify the above model in TCGA-LIHC dataset. E. Verify the above model in ICGC-JP dataset. F. Verify the above model in CPTAC dataset.
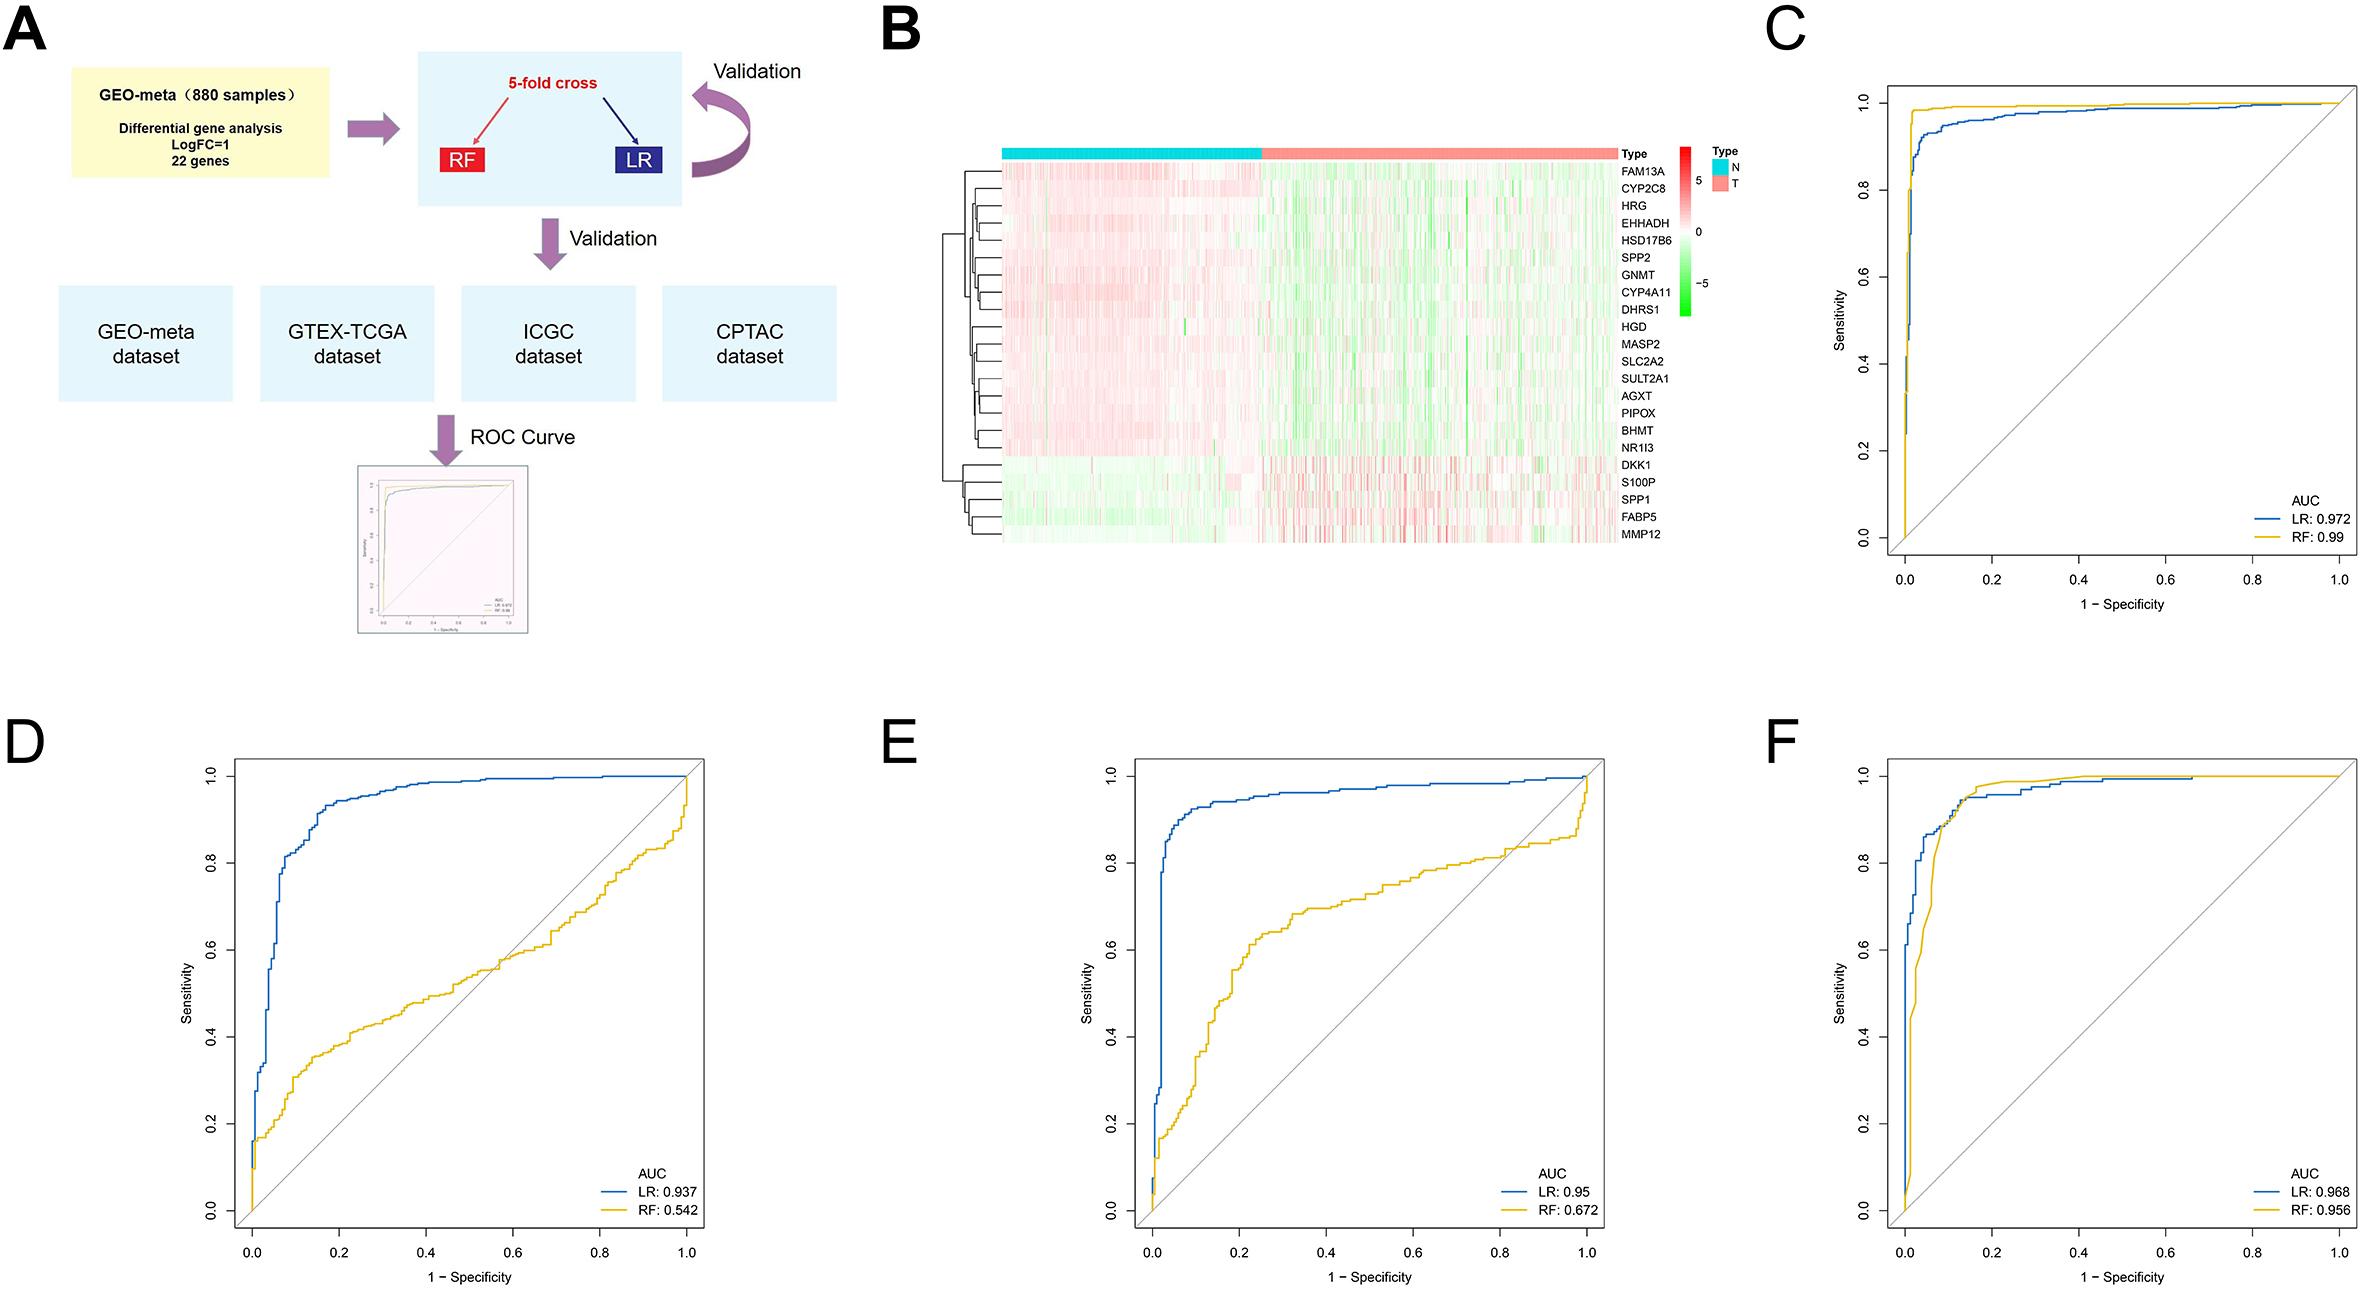
Figure 5.
Construct and validate the prognosis model of HCC. A. In the TCGA-LIHC dataset, the prognostic significance of 47 genes was further identified and analyzed. B. Using lasso regression analysis, identify important prognostic related genes in the GEO-meta dataset. C. Multivariate Cox regression was used to construct a prognostic model, and ROC curve was used to evaluate the discrimination efficiency. D. Verify the above model in TCGA-LIHC dataset. E. Verify the above model in ICGC-JP dataset.
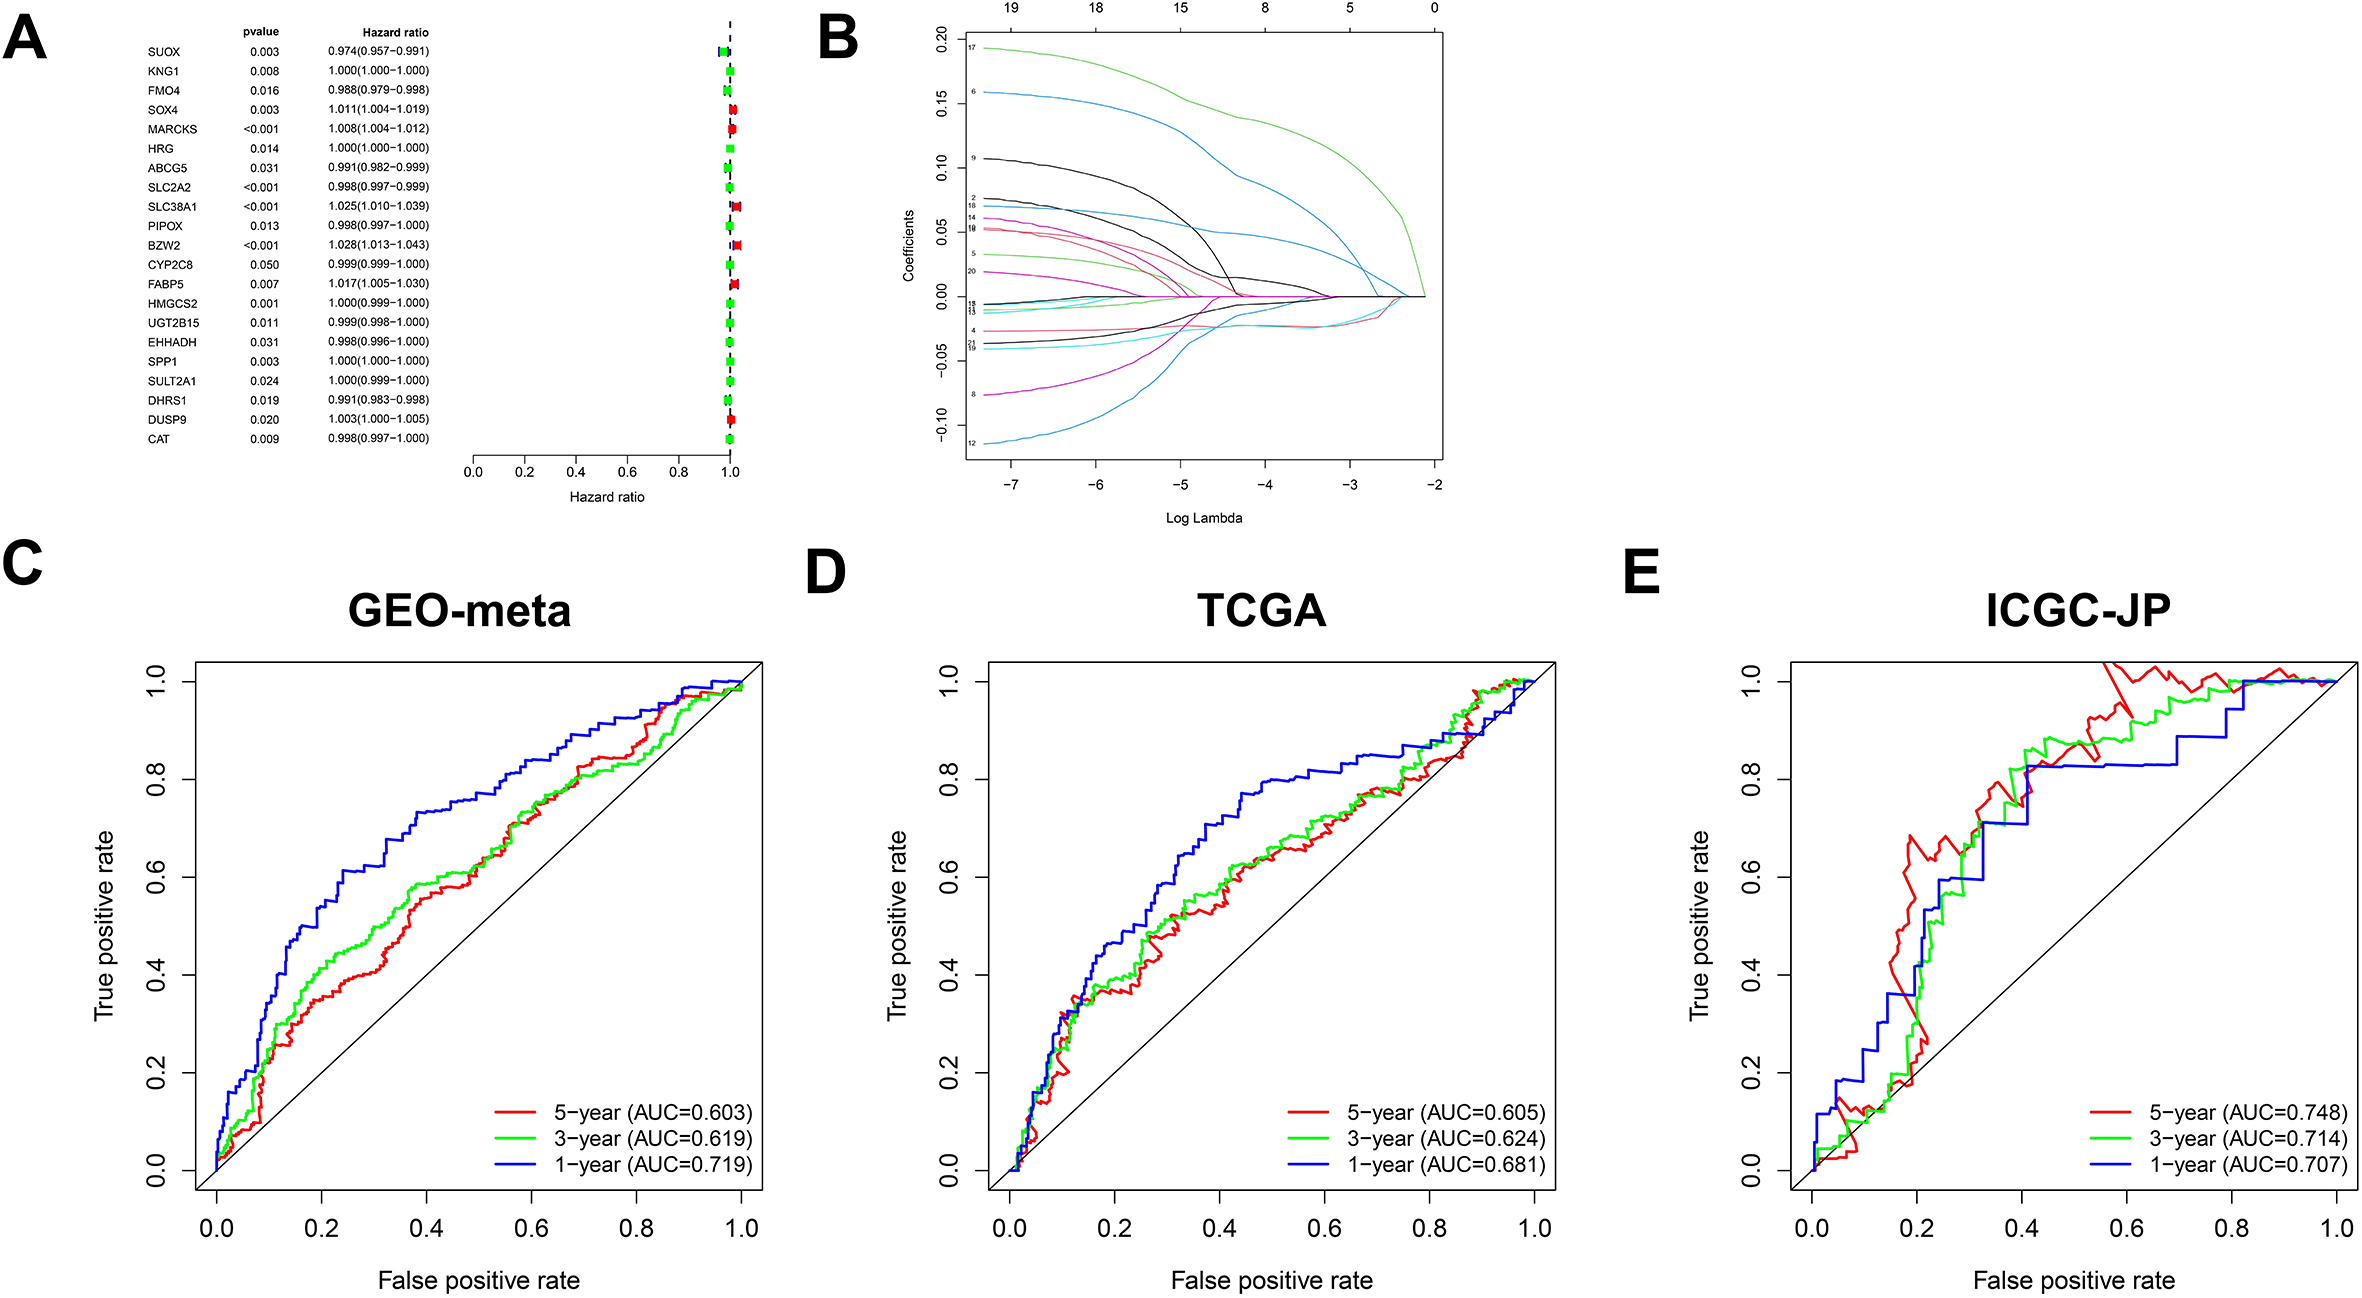
Figure 6.
Combined prognostic models and current clinical prognostic indicators. A. Prognostic significance of risk score detected by univariate Cox regression analysis. B. Prognostic significance of risk score by multivariate Cox regression analysis. C. Nomogram was constructed to combine the above risk score with TNM stage and BCLC stage. D. ROC curve predicts the discrimination efficiency of nomogram in the first year. E. ROC curve predicts the discrimination efficiency of nomogram in the third year. F. ROC curve predicts the discrimination efficiency of nomogram in the fifty year.
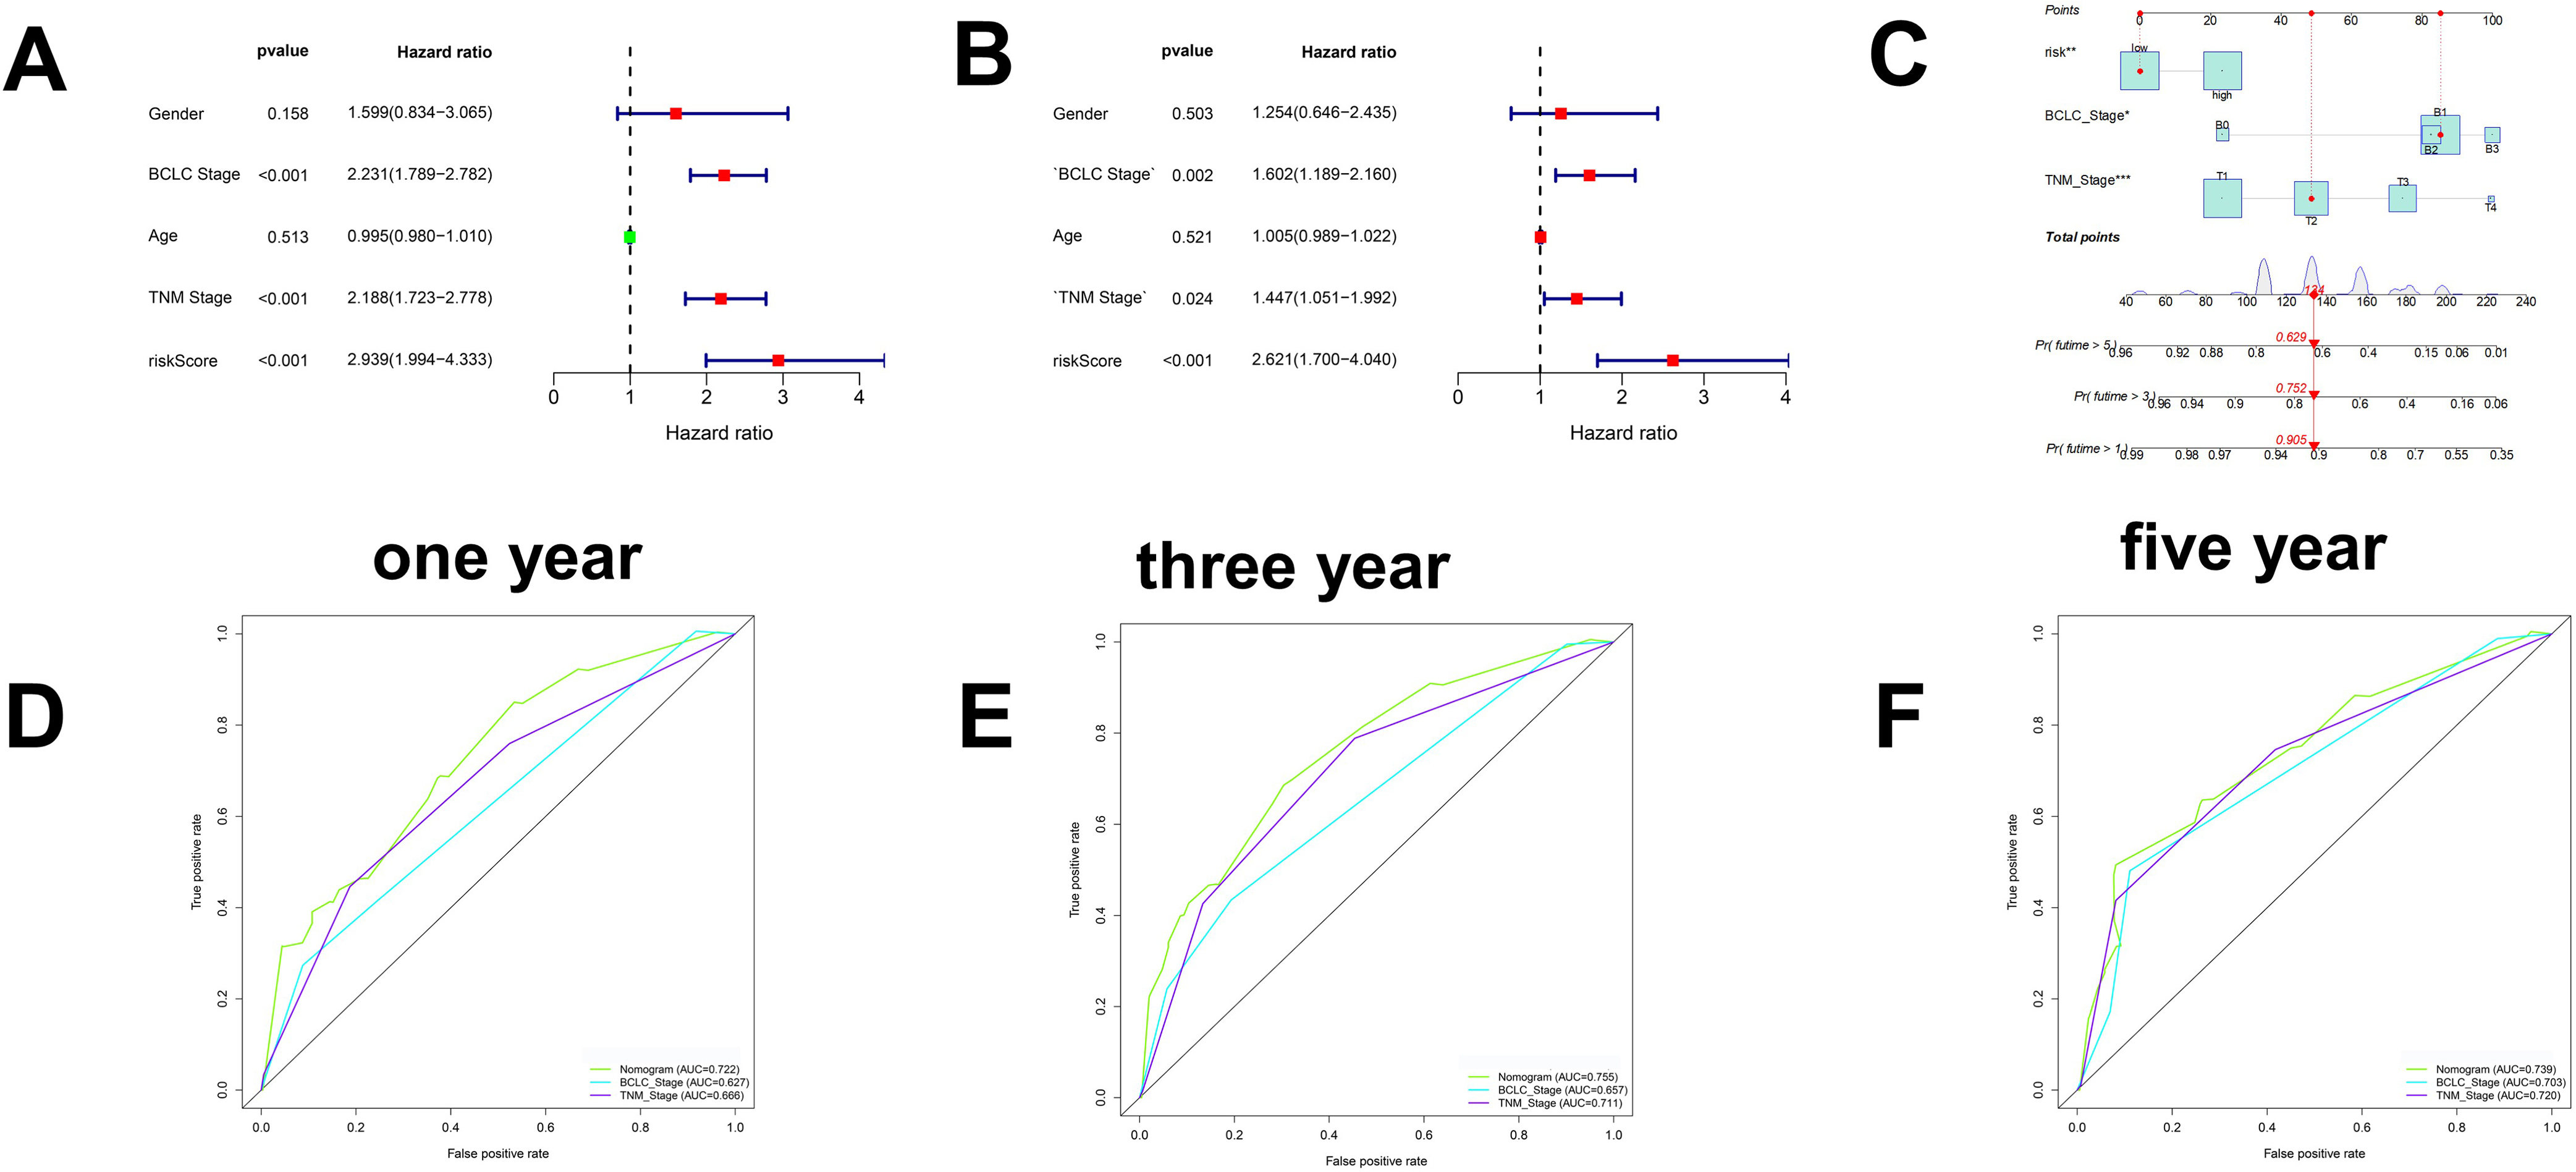
Figure 7.
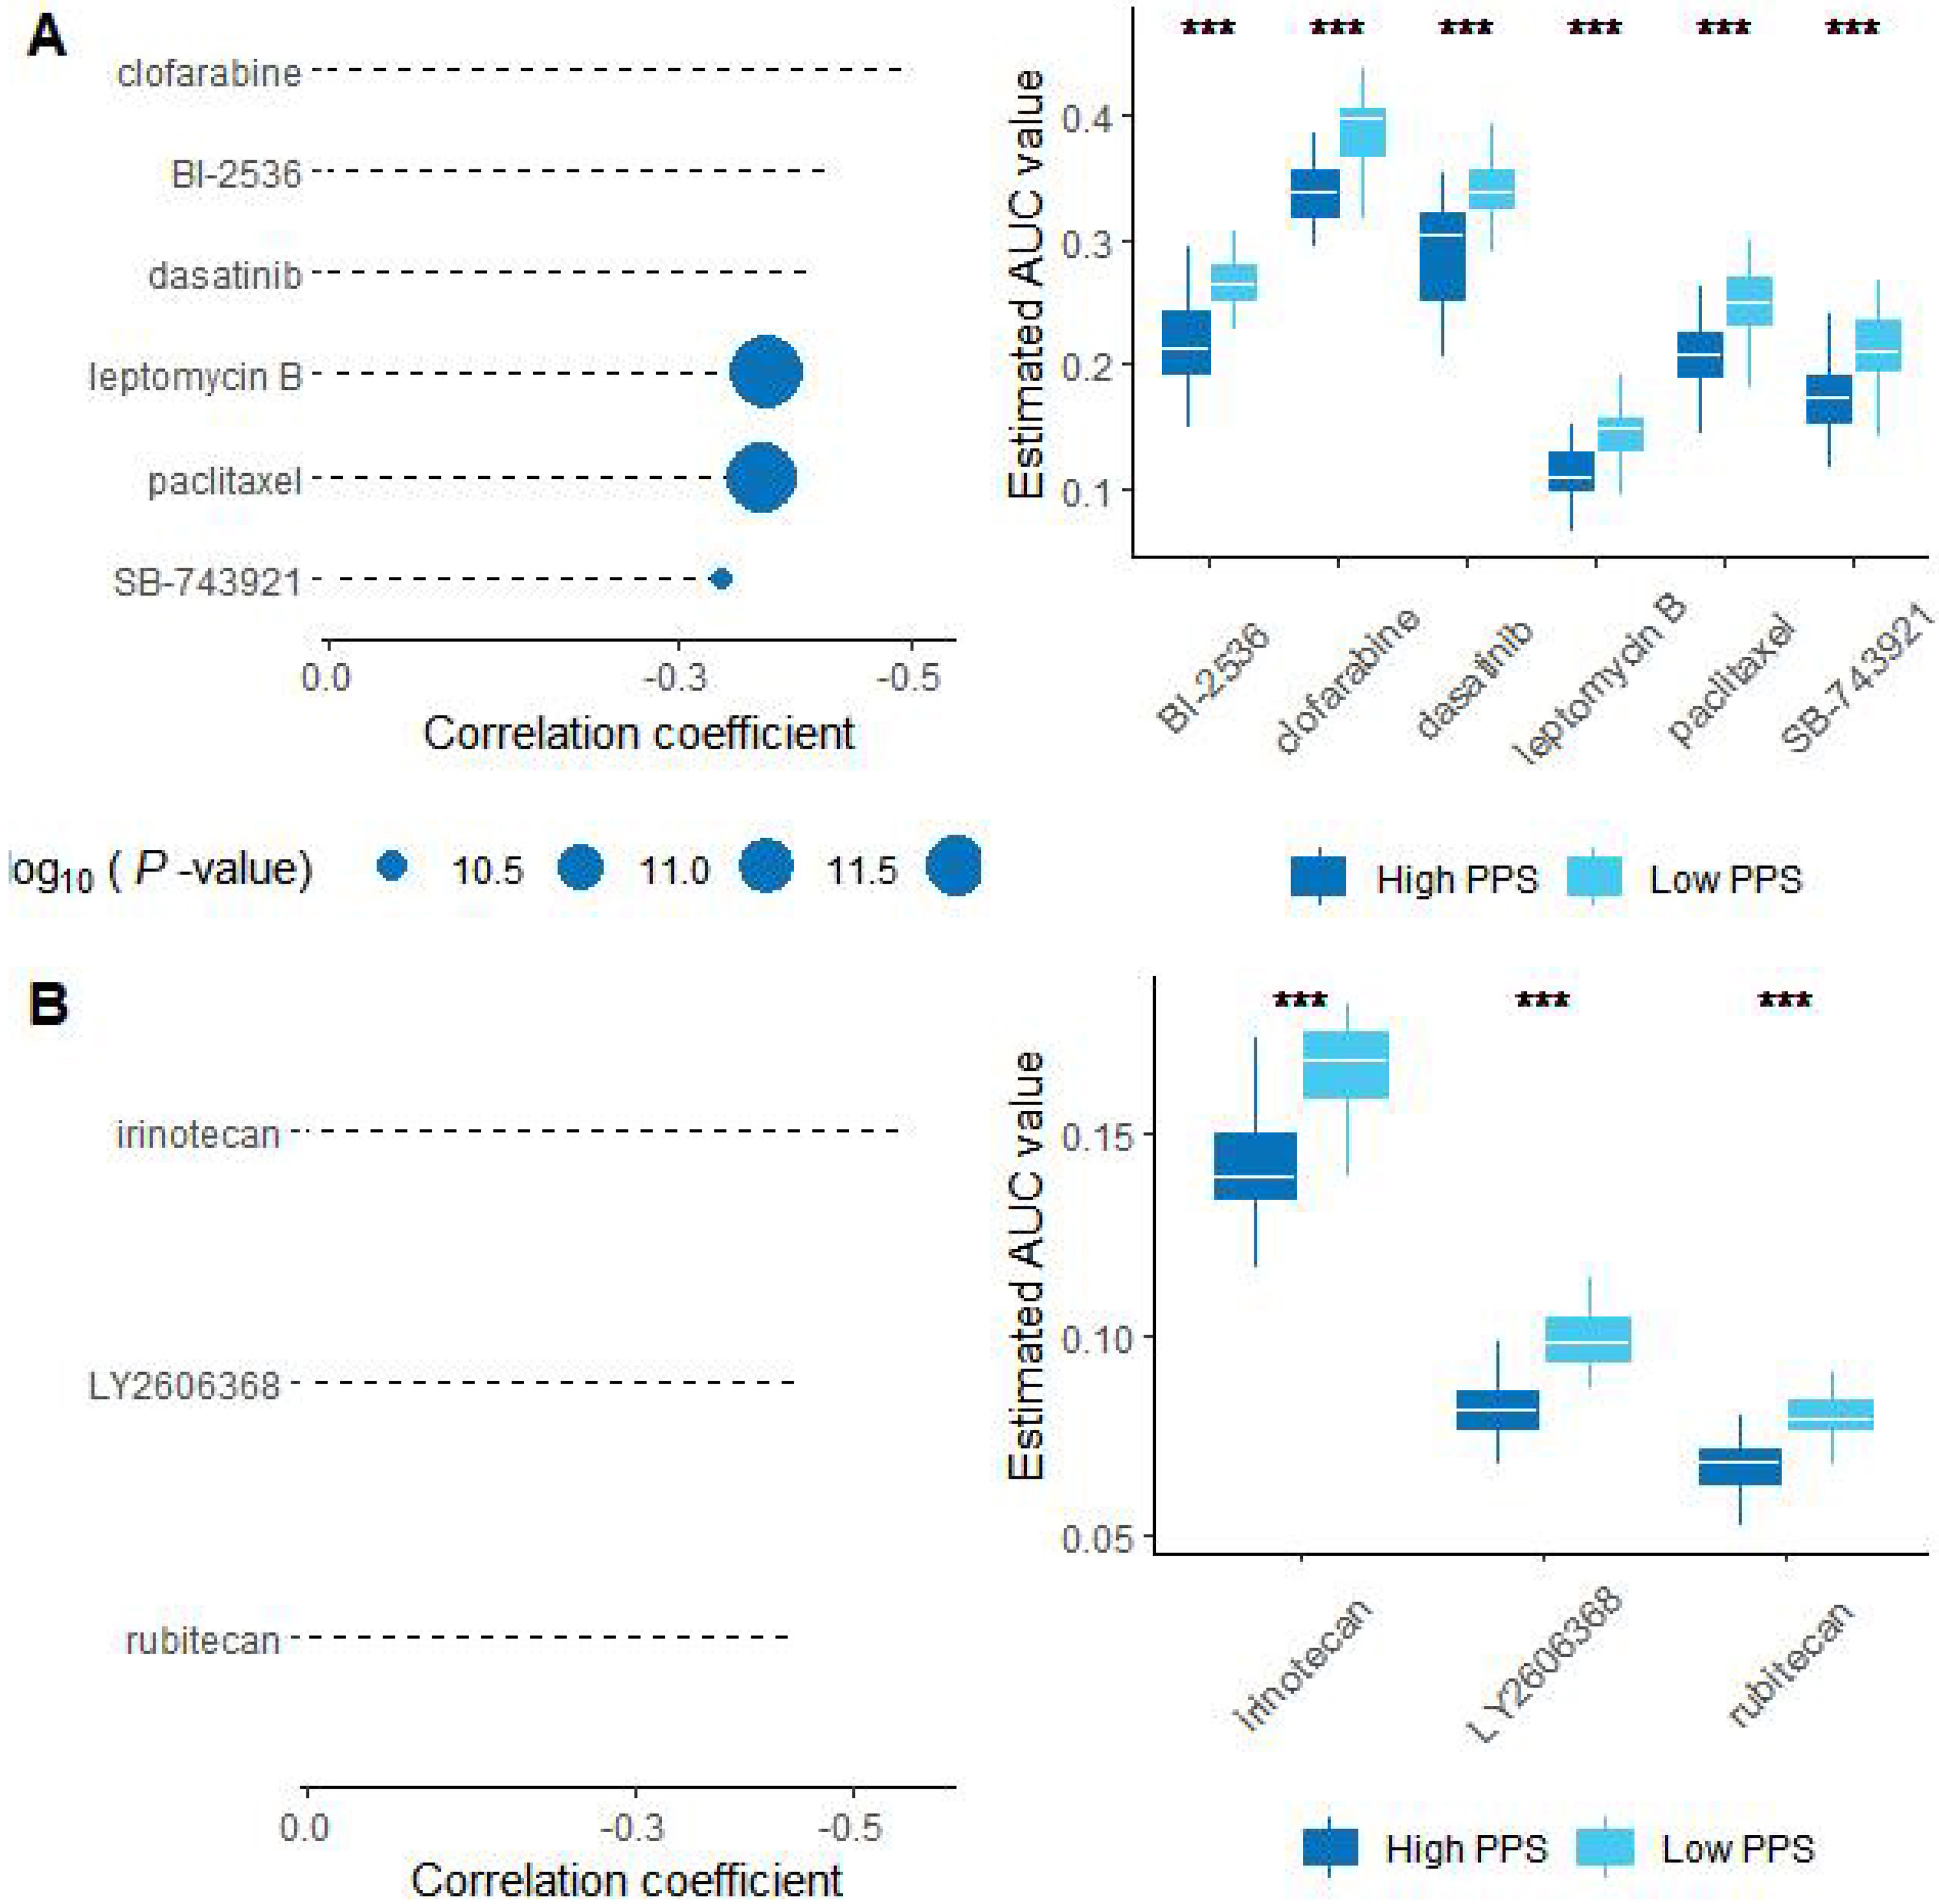
Evaluation of drug effects. A. The results of Spearman’s correlation analysis and differential drug response analysis of three CTRP-derived compounds. B. The results of Spearman’s correlation analysis and differential drug response analysis of one PRISM-derived compounds. Note that lower values on the y-axis of boxplots represented greater drug sensitivity. *< 0.05, ***< 0.001.
3.Results
3.1Screening methionine- and macrophage-related gene modules in hepatocellular carcinoma
Based on the four large human HCC datasets (GSE14520, GSE54236, GSE76427, and GSE116174), which were named the GEO meta-dataset in the GEO database, we used GSVA to score the methionine metabolic pathway of each HCC sample as previously reported and used EPIC and CIBERSORT, which are currently the most widely used, to quantify tumour tissue macrophages (Fig. 1A). Furthermore, we used the GEO meta-dataset to identify differentially expressed genes. The critical values were an absolute value of logFC greater than 0.585 and P less than 0.05. A total of 1314 differentially expressed genes were identified, including 650 downregulated genes and 664 upregulated genes (Fig. 1B and Table S2). Based on WGCNA, we divided the above 1314 genes into six modules and conducted coexpression analysis with macrophages and methionine metabolic activity. It was found that the turquoise module was the most significantly related to the above, so we focused on it in subsequent research (Fig. 1C).
3.2Identification of two HCC patterns and correlation with prognosis
In the survival analysis, with a cut-off value of p less than 0.05, we identified a total of 47 prognosis-related genes in the aforementioned gene module for downstream analysis (Table S3). Based on the GEO meta-dataset, we used the k-means algorithm to cluster and found that HCC can be divided into two patterns based on macrophage- and methionine metabolism-related genes (Fig. 2A). PCA based on the expression of all genes also showed that the above clustering was obvious (Fig. 2B). Survival analysis showed that the prognosis of Cluster 1 was significantly better than that of Cluster 2 (Fig. 2C). In the independent TCGA-LIHC dataset of HCC, we verified the above results, which suggests the reliability of our above typing (Fig. 2D–F).
3.3Molecular characteristics of the two tumour patterns
The above patterns were matched with clinical traits for correlation analysis. We found that pattern 2, with a worse prognosis, had a later TNM and BCLC stage and a larger tumour volume. These results internally supported the aforementioned survival analysis results (Fig. 3A). Interestingly, in pattern 2, there was less tumour-associated macrophage infiltration and weaker methionine metabolic activity (Fig. 3B and C). KEGG signalling pathway analysis showed that pattern 2 had weaker fatty acid metabolism and PPAR pathway activity and stronger cell cycle activity (Fig. 3D and Table S4). Similar results were obtained based on TCGA dataset analysis (Fig. 3E–G). Using immunofluorescence double labelling, our own HCC cohort also supported our clustering results (Fig. 3H).
3.4Construction of the HCC diagnosis model based on the above methionine- and macrophage-related genes
Although the pathological examination of HCC is the gold standard for the diagnosis of HCC, it is limited by the professional skills of pathologists, especially in some smaller medical institutions. We tried to build a diagnostic model of HCC by using the previously identified genes. First, we raised the differential gene expression threshold to the absolute value of logFC
3.5Construction of a prognostic model for hepatocellular carcinoma based on the above methionine- and macrophage-related genes
We performed univariate Cox regression analysis in the TCGA dataset based on the previously identified methionine- and macrophage-related genes. Twenty-one prognosis-related genes were identified (Fig. 5A). Using lasso regression analysis, we further identified the key variables, and a total of 8 genes were screened and used to construct the prognostic model (Fig. 5B). Using multivariate regression analysis, we constructed a prognostic model for HCC. In the training set GEO meta-dataset and the independent ICGC and TCGA datasets, the ROC curve showed good discrimination efficiency of the model (Fig. 5C–E). Clinical correlation analysis showed that patients in the high-risk group had later BCLC and TNM stages, further supporting the reliability of our model (Table 1).
Table 1
Correlation of clinical characteristics between high and low risk groups based on geo meta dataset
| GEO-meta dataset | |||
|---|---|---|---|
| Characters | Low risk | High risk | |
| Gender | 0.4550 | ||
| Female | 35 | 41 | |
| Male | 216 | 210 | |
| Bclc stage | 0.0068 | ||
| 0–A | 136 | 114 | |
| B–C | 34 | 56 | |
| Age (years) | 0.0050 | ||
| | 132 | 158 | |
| | 79 | 52 | |
| TNM stage | |||
| I–II | 142 | 122 | |
| III–IV | 28 | 47 | |
| ALT (U/L) | 0.1172 | ||
| | 77 | 65 | |
| | 44 | 56 | |
| AFP (ng/ml) | |||
| | 83 | 45 | |
| | 36 | 74 | |
| Tumor size (cm) | 0.0681 | ||
| | 83 | 70 | |
| | 37 | 51 | |
| Multinodular | 0.0284 | ||
| Yes | 19 | 33 | |
| No | 102 | 88 | |
| Cirrhosis | 0.0943 | ||
| Yes | 108 | 115 | |
| No | 13 | 6 | |
3.6Nomogram based on the prognostic model and clinical indicators
To make better use of the above prognostic model in the clinic, we conducted univariate and multivariate Cox regression analyses and found that the above risk score and BCLC and TCGA stages were independent prognostic factors (Fig. 6A and B). A nomogram was constructed based on the TCGA staging, BCLC staging and risk score (Fig. 6C). In the GEO meta-dataset, TCGA dataset, and ICGC dataset, the nomogram above showed a better ability to distinguish prognosis (Fig. 6D–F).
3.7Bioinformatics prediction of drug candidates
To identify candidate drugs for the high-risk group, we comprehensively analysed the PRISM and CTRP2.0 databases and found that four compounds may be effective in the low-risk group based on the KNN algorithm. The results based on PRISM found that six drugs had better responses in the low-risk group (Fig. 7A), and the results based on CTRP2.0 found that three drugs had better responses in the low-risk group (Fig. 7B). These results can provide some guidance for clinical treatment.
4.Discussion
Advanced HCC often lacks surgical indications, and patients can only expect to benefit from systematic treatment. Paradoxically, researchers have reached a consensus that the more advanced the HCC is, the more heterogeneous it is. Therefore, the current commonly used treatment methods such as sorafenib and PD-L1 are only effective for a small number of HCC patients (less than 40%) [23]. In recent years, many factors such as PD-L1 expression, tumor mutation load, macrophages, wnt pathway activation, fatty liver and other factors have been reported to be involved in the efficacy of immunotherapy [24, 25, 26]. Macrophage is an important and critical factor for immunotherapy, because it is closely related to the above influencing factors of immunotherapy [27]. In this study, we first identified methionine and tumour-associated macrophage-related genes. Based on these genes, we identified two HCC expression patterns using the KNN algorithm. Pattern 1 has stronger methionine metabolic activity and immune cell infiltration, such as T cells, than pattern 2. This is also consistent with our and other previous studies showing that methionine metabolism is involved in the regulation of the tumour immune microenvironment. The prognostic correlation analysis showed that the survival time of mode 1 patients was significantly better than that of mode 2 patients. Some studies suggest that increased methionine metabolic activity and macrophage infiltration are often associated with poor prognosis of patients. However, it has also been reported that SAM, an intermediate of methionine metabolism, inhibits the growth of HCC, and macrophages are also considered to have dual roles in the process of HCC progression [28]. For example, M1 type macrophages are considered to activate tumor immunity under certain HCC background [28]. In the independent online TCGA-LIHC dataset, our above results were further confirmed. Furthermore, we detected the presence of two expression patterns in hepatocellular carcinoma using immunofluorescence double labelling experiments.
In the past, researchers have built diagnostic models using logistic regression or machine learning, such as random forest [30]. However, this is often a single data set or only a bioinformatics method is used. It is unclear about the diagnostic efficacy of macrophages and methionine for HCC [31]. Consistent with previous findings, the random forest model is superior to logistic regression in the context of a training set. However, we verified this hypothesis externally in other independent datasets, including protein data and RNA-seq data. Logistic regression has better stability than the random forest model. This may be due to the fact that random forests are more dependent on the stability of a single data set. However, in clinical, a unified sequencing method seems unrealistic [31]. The AUC value was more than 0.95 in all datasets, and its diagnostic efficiency was even higher than that of more AFP currently used in clinical practice. We also screened prognosis-related genes in the aforementioned gene panel. A prognostic model was constructed. It was shown in the TCGA-LIHC, ICGC and GEO meta-dataset that the model was closely related to the prognosis of patients, and the AUC also showed a good ability to distinguish. At present, BCLC stage and TNM stage are the main indices used to judge the prognosis of patients with HCC. Multivariate Cox regression analysis showed that our risk index was an independent prognostic model relative to TNM and BCLC stages. Furthermore, combining BCLC, TNM staging and our risk score can better distinguish the prognosis of HCC patients [2, 32].
Similar to previous studies, our study also has certain limitations. For example, only one GEO meta-dataset is used in the analysis related to BCLC stage. The TCGA-LIHC and ICGC datasets lack the BCLC stage of patients. Drug sensitivity analysis is only based on online database analysis, and we will further verify this information in future studies.
5.Conclusions
In summary, we analysed the landscape related to macrophage and methionine metabolism in HCC. We also attempted to construct diagnostic and prognostic models and predicted potential therapeutic drugs for patients in high-risk groups. To promote the rigor of scientific research and the novelty of the model, we would love to see our results subjected to more thorough validation in well-designed multicentre prospective studies.
Declaration of competing interest
No benefits in any form have been received or will be received from a commercial party related directly or indirectly to the subject of this article.
Funding
This project was supported by the National Science Foundation of China (Nos. 8207034238, 81470899, and 81702357); Natural Science Foundation of Chongqing, China (cstc2020jcyj-msxmX0902; cstc2019jcyj-msxm X0659; cstc2020jcyj-msxmX0655; cstc2021jcyj-bsh X0193.).
Author contributions
Conception: Diguang Wen; Shuling Wang.
Interpretation or analysis of data: Diguang Wen.
Preparation of the manuscript: Diguang Wen.
Revision for important intellectual content: Diguang Wen; Shuling Wang; Ting Yu; Jiajian Yu.
Supervision: Yue Li and Zuojin Liu.
Ethics approval
Clinical tissue samples were collected from the Second Affiliated Hospital of Chongqing Medical University. The study was approved by the ethics committee of the Second Affiliated Hospital of Chongqing Medical University (APPROVAL NUMBER. No. (2022) 579).
Statement of human and animal rights
All procedures in this study were conducted following the protocol approved by the ethics committee of the Second Affiliated Hospital of Chongqing Medical University and complied with the recommendations of the Declaration of Helsinki.
Statement of informed consent
Written informed consent was obtained from the subjects for their anonymized information to be published in this article.
Consent for publication
All authors agree to publish.
Availability of data and materials
All data related to the article can be obtained from the corresponding author upon reasonable request.
Competing interests
The authors have declared that no competing interests exist.
Supplementary data
The supplementary files are available to download from http://dx.doi.org/10.3233/CBM-220421.
Acknowledgments
None.
References
[1] | P. Johnson, Q. Zhou, D.Y. Dao and Y. Lo, Circulating biomarkers in the diagnosis and management of hepatocellular carcinoma, Nat Rev Gastroenterol Hepatol 19: ((2022) ), 670–681. |
[2] | M. Reig and J. Bruix, Reply to: “Correspondence on the <BCLC strategy for prognosis prediction and treatment recommendation: The 2022 update>”, J Hepatol 76: ((2022) ), 1240–1241. |
[3] | L. Molina, J. Zhu, E. Trépo, Q. Bayard, G. Amaddeo, GENTHEP Consortium, J.F. Blanc, J. Calderaro, X. Ma, J. Zucman-Rossi and E. Letouzé, Bi-allelic hydroxymethylbilane synthase inactivation defines a homogenous clinico-molecular subtype of hepatocellular carcinoma, J Hepatol 77: ((2022) ), 1038–1046. |
[4] | X. Chao, S. Wang, S. Fulte, X. Ma, F. Ahamed, W. Cui, Z. Liu, T. Rülicke, K. Zatloukal, W.X. Zong, W. Liu, H.M. Ni and W.X. Ding, Hepatocytic p62 suppresses ductular reaction and tumorigenesis in mouse livers with mTORC1 activation and defective autophagy, J Hepatol 76: ((2022) ), 639–651. |
[5] | Q. Huang, J. Li, J. Xing, W. Li, H. Li, X. Ke, J. Zhang, T. Ren, Y. Shang, H. Yang, J. Jiang and Z. Chen, CD147 promotes reprogramming of glucose metabolism and cell proliferation in HCC cells by inhibiting the p53-dependent signaling pathway, J Hepatol 61: ((2014) ), 859–866. |
[6] | A. Husain, Y.T. Chiu, K.M. Sze, D.W. Ho, Y.M. Tsui, E. Suarez, V.X. Zhang, L.K. Chan, E. Lee, J.M. Lee, T.T. Cheung, C.C. Wong, C.Y. Chung and I.O. Ng, Ephrin-A3/EphA2 axis regulates cellular metabolic plasticity to enhance cancer stemness in hypoxic hepatocellular carcinoma, J Hepatol 77: ((2022) ), 383–396. |
[7] | W. Dai, L. Xu, X. Yu, G. Zhang, H. Guo, H. Liu, G. Song, S. Weng, L. Dong, J. Zhu, T. Liu, C. Guo and X. Shen, OGDHL silencing promotes hepatocellular carcinoma by reprogramming glutamine metabolism, J Hepatol 72: ((2020) ), 909–923. |
[8] | D. Mikami, M. Kobayashi, J. Uwada, T. Yazawa, K. Kamiyama, K. Nishimori, Y. Nishikawa, S. Nishikawa, S. Yokoi, T. Taniguchi and M. Iwano, β-Hydroxybutyrate enhances the cytotoxic effect of cisplatin via the inhibition of HDAC/survivin axis in human hepatocellular carcinoma cells, J Pharmacol Sci 142: ((2020) ), 1–8. |
[9] | J.T. Li, H. Yang, M.Z. Lei, W.P. Zhu, Y. Su, K.Y. Li, W.Y. Zhu, J. Wang, L. Zhang, J. Qu, L. Lv, H.J. Lu, Z.J. Chen, L. Wang, M. Yin and Q.Y. Lei, Correction to: Dietary folate drives methionine metabolism to promote cancer development by stabilizing MAT IIA, Signal Transduct Target Ther 7: ((2022) ), 401. |
[10] | D. Mukha, M. Fokra, A. Feldman, B. Sarvin, N. Sarvin, K. Nevo-Dinur, E. Besser, E. Hallo, E. Aizenshtein, Z.T. Schug and T. Shlomi, Glycine decarboxylase maintains mitochondrial protein lipoylation to support tumor growth, Cell Metab 34: ((2022) ), 775–782.e9. |
[11] | R. Sun, Z. Zhang, R. Bao, X. Guo, Y. Gu, W. Yang, J. Wei, X. Chen, L. Tong, J. Meng, C. Zhong, C. Zhang, J. Zhang, Y. Sun, C. Ling, X. Tong, F.X. Yu, H. Yu, W. Qu, B. Zhao, W. Guo, M. Qian, H. Saiyin, Y. Liu, R.H. Liu, C. Xie, W. Liu, Y. Xiong, K.L. Guan, Y. Shi, P. Wang and D. Ye, Loss of SIRT5 promotes bile acid-induced immunosuppressive microenvironment and hepatocarcinogenesis, J Hepatol 77: ((2022) ), 453–466. |
[12] | J. Wang, Y. Wang, Y. Chu, Z. Li, X. Yu, Z. Huang, J. Xu and L. Zheng, Tumor-derived adenosine promotes macrophage proliferation in human hepatocellular carcinoma, J Hepatol 74: ((2021) ), 627–637. |
[13] | W. Xu, Y. Cheng, Y. Guo, W. Yao and H. Qian, Targeting tumor associated macrophages in hepatocellular carcinoma, Biochem Pharmacol 199: ((2022) ), 114990. |
[14] | Y. Liu, M. Shi, X. He, Y. Cao, P. Liu, F. Li, S. Zou, C. Wen, Q. Zhan, Z. Xu, J. Wang, B. Sun and B. Shen, LncRNA-PACERR induces pro-tumour macrophages via interacting with miR-671-3p and m6A-reader IGF2BP2 in pancreatic ductal adenocarcinoma, J Hematol Oncol 15: ((2022) ), 52. |
[15] | C. Hutter and J.C. Zenklusen, The cancer genome atlas: Creating lasting value beyond its data, Cell 173: ((2018) ), 283–285. |
[16] | GTEx Consortium, Human genomics. The Genotype-Tissue Expression (GTEx) pilot analysis: Multitissue gene regulation in humans, Science 348: ((2015) ), 648–660. |
[17] | J. Zhang, R. Bajari, D. Andric, F. Gerthoffert, A. Lepsa, H. Nahal-Bose, L.D. Stein and V. Ferretti, The international cancer genome consortium data portal, Nat Biotechnol 37: ((2019) ), 367–369. |
[18] | N.J. Edwards, M. Oberti, R.R. Thangudu, S. Cai, P.B. McGarvey, S. Jacob, S. Madhavan and K.A. Ketchum, The CPTAC data portal: A resource for cancer proteomics research, J Proteome Res 14: ((2015) ), 2707–2713. |
[19] | B.A. Martínez, S. Shrotri, K.M. Kingsmore, P. Bachali, A.C. Grammer and P.E. Lipsky, Machine learning reveals distinct gene signature profiles in lesional and nonlesional regions of inflammatory skin diseases, Sci Adv 8: ((2022) ), eabn4776. |
[20] | C.Q. Liu, Q.D. Xia, J.X. Sun, J.Z. Xu, J.L. Lu, Z. Liu, J. Hu and S.G. Wang, Identification and validation of a twelve immune infiltration-related lncRNA prognostic signature for bladder cancer, Aging (Albany NY) 14: ((2022) ), 1492–1507. |
[21] | M. Lu, S. Qiu, X. Jiang, D. Wen, R. Zhang and Z. Liu, Development and validation of epigenetic modification-related signals for the diagnosis and prognosis of hepatocellular carcinoma, Front Oncol 11: ((2021) ), 649093. |
[22] | C. Yang, X. Huang, Y. Li, J. Chen, Y. Lv and S. Dai, Prognosis and personalized treatment prediction in TP53-mutant hepatocellular carcinoma: An in silico strategy towards precision oncology, Brief Bioinform 22: ((2021) ). |
[23] | R.C. Sperandio, R.C. Pestana, B.V. Miyamura and A.O. Kaseb, Hepatocellular carcinoma immunotherapy, Annu Rev Med 73: ((2022) ), 267–278. |
[24] | L. Lu, M. Zhan, X.Y. Li, H. Zhang, D.J. Dauphars, J. Jiang, H. Yin, S.Y. Li, S. Luo, Y. Li and Y.W. He, Clinically approved combination immunotherapy: Current status, limitations, and future perspective, Curr Res Immunol 3: ((2022) ), 118–127. |
[25] | D.S. Mandlik, S.K. Mandlik and H.B. Choudhary, Immunotherapy for hepatocellular carcinoma: Current status and future perspectives, World J Gastroenterol 29: ((2023) ), 1054–1075. |
[26] | N. Yahoo, M. Dudek, P. Knolle and M. Heikenwälder, Role of immune responses in the development of NAFLD-associated liver cancer and prospects for therapeutic modulation, J Hepatol, (2023) . |
[27] | K. Cheng, N. Cai, J. Zhu, X. Yang, H. Liang and W. Zhang, Tumor-associated macrophages in liver cancer: From mechanisms to therapy, Cancer Commun (Lond) 42: ((2022) ), 1112–1140. |
[28] | S.C. Lu and J.M. Mato, S-adenosylmethionine in liver health, injury, and cancer, Physiol Rev 92: ((2012) ), 1515–1542. |
[29] | C. An, H. Yang, X. Yu, Z.Y. Han, Z. Cheng, F. Liu, J. Dou, B. Li, Y. Li, Y. Li, J. Yu and P. Liang, A machine learning model based on health records for predicting recurrence after microwave ablation of hepatocellular carcinoma, J Hepatocell Carcinoma 9: ((2022) ), 671–684. |
[30] | L. Liu, Q. Hu, Y. Zhang, X. Sun, R. Sun and Z. Ren, Classification molecular subtypes of hepatocellular carcinoma based on PRMT-related genes, Front Pharmacol 14: ((2023) ), 1145408. |
[31] | Z. Zhu, G. Shen, J. Li, T. Qiu, Q. Fang, Y. Zheng, Y. Xin, Z. Liu, F. Zhao, D. Ren and J. Zhao, Incidence of antibody-drug conjugates-related pneumonitis in patients with solid tumors: A systematic review and meta-analysis, Crit Rev Oncol Hematol 184: ((2023) ), 103960. |
[32] | M. Reig and G. Cabibbo, Antiviral therapy in the palliative setting of HCC (BCLC-B and -C), J Hepatol 74: ((2021) ), 1225–1233. |


