
Circulating miR-10b, soluble urokinase-type plasminogen activator receptor, and plasminogen activator inhibitor-1 as predictors of non-small cell lung cancer progression and treatment response
Abstract
BACKGROUND:
Despite advances in lung cancer treatment, most lung cancers are diagnosed at an advanced stage. Expression of microRNA10b (miR-10b) and fibrinolytic activity, as reflected by soluble urokinase-type plasminogen activator receptor (suPAR) and plasminogen activator inhibitor 1 (PAI-1), are promising biomarker candidates.
OBJECTIVE:
To assess the expression of miR-10b, and serum levels of suPAR and PAI-1 in advanced stage non-small cell lung cancer (NSCLC) patients, and their correlation with progression, treatment response and prognosis.
METHODS:
The present prospective cohort and survival study was conducted at Dharmais National Cancer Hospital and included advanced stage NSCLC patients diagnosed between March 2015 and September 2016. Expression of miR-10b was quantified using qRT-PCR. Levels of suPAR and PAI-1 were assayed using ELISA. Treatment response was evaluated using the RECIST 1.1 criteria. Patients were followed up until death or at least 1 year after treatment.
RESULTS:
Among the 40 patients enrolled, 25 completed at least four cycles of chemotherapy and 15 patients died during treatment. Absolute miR-10b expression
CONCLUSIONS:
Since miR-10b cannot be used as an independent risk factor for NSCLC progression and treatment response, we developed a model to predict progression using suPAR levels and treatment response using suPAR and PAI-1 levels. Further studies are needed to validate this model.
1.Introduction
Lung cancer is the second most common cancer worldwide, with estimated 2,094,000 new cases diagnosed in 2018 [1]. It is the leading cause of cancer death globally and has a mortality rate of 18%. In 2020, approximately 35,000 new cases of lung cancer were diagnosed in Indonesia. Lung cancer is the most common cancer in Indonesian males [age-standardized rate (ASR) of 20.1 per 100,000] and the fourth most common cancer in Indonesian females (ASR of 6.2). It is also the third leading cause of cancer-related death in Indonesia [2]. Majority of lung cancer is non-small cell lung cancer (NSCLC; 85%), while the remaining fall into small cell lung cancer group (SCLC; 15%). The main subtypes of NSCLCs are adenocarcinoma (40%), squamous cell carcinoma (30%), and large cell carcinoma (15%) [1, 2]. Despite advances in lung cancer treatment, most lung cancers are diagnosed at an advanced stage, conferring poor prognosis.
Many circulating biomarkers have been investigated to predict treatment response and survival [3]. MicroRNAs (miRNAs), which are involved in various biological processes, such as cell cycle regulation, proliferation, apoptosis, and differentiation, are molecular markers of interest [4]. They play important roles in malignant disease, as either oncogenes or tumor-suppressor genes [5, 6]. Overexpression of microRNA-10b (miR-10b) was previously reported to promote breast cancer metastasis in mice [7]. Studies using lung cancer cell lines showed that miR-10b transfection significantly increased proliferation, migration, and invasion [8].
On the other hand, coagulation and fibrinolytic systems have also been associated with the prognosis of lung cancer patients [9]. Two components of the fibrinolytic systems, plasminogen activator inhibitor (PAI-1) and urokinase-type plasminogen activator receptor (uPAR), are elevated in cancer tissue and associated with poor prognosis [10, 11]. The binding of uPA to its receptor (uPAR) converts plasminogen to plasmin, which activates matrix metalloproteinases, leading to extracellular matrix degradation and metastasis [12]. Interaction of PAI-1 with other substrates, such as vitronectin, regulates cell adhesion and migration. Elevated uPAR levels have been associated with poor prognosis in breast cancer [11]. Therefore, PAI-1 and uPAR are also potential predictors of progression in lung cancer.
miRNAs are released by cells and found in various biofluids, including serum and plasma. Circulating miRNAs are resistant to enzymatic digestion by ribonucleases, making them stable in blood [13, 14]. Meanwhile, circulating soluble uPAR (suPAR) is derived from uPAR [15] and reflects tissue uPAR levels as it originates from shedding of the uPAR and is found in various body fluids, including plasma, urine, and cerebrospinal fluid [15, 16]. PAI-1 is also found in plasma.
Blood serum and plasma are relatively easy to obtain noninvasively, making them promising prognostic markers [3]. The present study evaluated the role of miR-10b, suPAR, and PAI-1 as predictors of non-small cell lung cancer (NSCLC) treatment response and progression.
2.Material and methods
2.1Study design and participants
This prospective cohort and survival study included patients with advanced stage NSCLC at Dharmais National Cancer Hospital between March 2015 and September 2016. The inclusion criteria were: (1) patients diagnosed with NSCLC based on histopathology, bronchoscopy, or imaging analysis and (2) had never received treatment related to NSCLC. The exclusion criteria were: (1) patients with more than one type of malignancy; (2) those with metastatic lung cancer; (3) incomplete follow-up; and (4) refusal to participate in the study. Patients were enrolled consecutively according to the inclusion and exclusion criteria. A total of 40 patients were identified who met the inclusion and exclusion criteria.
Patients’ demographic and clinical data were recorded. Standard treatment consisted of at least four cycles of platinum-based chemotherapy with or without targeted therapy. Palliative radiotherapy was administered at the metastatic sites. Clinical approval was granted from the Ethical Committee for Medical Research, University of Indonesia (Letter No. 188/UN.F1/ETIK/2015).
2.2Blood sampling
Samples of 3–6 mL of venous blood were withdrawn from each patient and collected into tubes containing EDTA. Blood was centrifuged at 3,000 rpm for 20 min at 25∘C and the plasma was then separated into 1.5-mL tubes, centrifuged at 15,000 rpm for 3 min at 4∘C, divided into 400-
2.3Measurement of circulating miR-10b expression
Total RNA was isolated using a miRNeasy serum/ plasma kit, (Qiagen, Germany). Successful isolation was compared with a spike-in control cel-miR-39 and measured using a Nanodrop (Thermo Fisher Scientific, USA) at 260 nm and 280 nm wavelengths.
Expression of hsa-miR-10b was analyzed using quantitative real-time polymerase chain reaction (qRT-PCR) and was performed using the miScript system (Qiagen, Germany), consisting of the miScript RT II kit, miScript preAMP kit, miScript primer assay, and miScript SYBR Green PCR kit according to the manufacturer’s protocol. Complementary DNA was synthesized using miScript reverse transcriptase for preamplification. The primer used in miScript primer assay was hsa-miR-10b-5p 5
Expression of miR10-b was calculated as absolute and relative quantifications. Samples from normal healthy individuals were used as a comparison. The number of PCR cycles required to reach the detection threshold was expressed as cycle threshold (
2.4Measurement of suPAR and PAI-1
Both suPAR and plasma PAI-1 activities were measured using commercial assays (Quantikine uPAR and Quantikine Serpin-E1/PAI-1, R&D Systems, USA) based on sandwich enzyme-linked immunosorbent assay. Plasma was added into reagent wells coated with specific antibodies to uPAR or PAI-1, respectively and incubated in room temperature. uPAR or PAI-1 molecules in samples would bind to the antibodies in the corresponding wells. After incubation, the wells were washed, and horseradish peroxidase-labeled secondary antibody was added and bound to the molecules in the wells. Substrate was added after washing the wells to remove excess antibodies. The bound enzyme would react with the substrate and resulted in color change, which intensity were then measured to determine the concentration of the molecule.
2.5Follow-up assessment
Patients were evaluated for the response and progression at 4–6 weeks after completing at least four cycles of therapy. Assessment was performed using Response Evaluation Criteria in Solid Tumors (RECIST) version 1.1 and patients were categorized as complete response (CR), partial response (PR), progressive disease (PD), or stable disease (SD) [16]. For statistical analyses, patients were grouped according to treatment response and disease progression. Treatment response was defined as good (CR or PR) or bad (PD, SD, or died before completing a minimum of four cycles of therapy), whereas disease progression was defined as non-progressive (CR, PR, or SD) or progressive (PD or died before completing a minimum of four cycles of therapy). Follow-up was continued for at least 1 year after the last chemotherapy or until the patient died.
2.6Statistical analyses
Death due to lung cancer was set as the failure event whenever it occurred during treatment or until 1 year after the last treatment. Independent predictors of treatment responses or disease progression were analysed using logistic regression. Survival curve analyses were performed using the Kaplan–Meier estimation curves with log-rank and Wilcoxon’s tests.
3.Results
3.1Characteristics of the study participants
Among the 40 NSCLC patients enrolled, the mean age was 58.5 years and 67.5% were male. Most patients (77.5%) had stage IV cancer and the most common histopathological subtype was adenocarcinoma (80%) (Table 1). Among patients with adenocarcinoma, there were more females than males (85% vs. 78%) and more non-smokers than smokers (90% vs. 70%). The high proportion of patients diagnosed in the advanced stage was mainly due to the disease being clinically asymptomatic until it reached an advanced stage. Twenty-five (62.5%) patients completed at least four cycles of chemotherapy and 15 (37.5%) died before completing treatment. Thus, 25 patients underwent treatment response evaluation using the RECIST 1.1 criteria. None of the patients showed CR (Table 1).
The median survival of patients with progression was 3.3 months, whereas the median survival of patients with non-progression was not reached after 12 months (Fig. 1). The median survival for patients who died before completion of treatment and evaluation using the RECIST criteria was 2.3 months. The median survival for good response was not reached, whereas the median survival for poor response was 3.7 months (Fig. 2). Significant differences in median survival were found for disease progression and treatment response (log-rank
Table 1
Baseline characteristics of the study participants
| Characteristics | % | |
|---|---|---|
| Sex | ||
| Male | 27 | 67.5 |
| Female | 13 | 32.5 |
| Smoker | ||
| Yes | 20 | 50.0 |
| No | 20 | 50.0 |
| Histopathology type | ||
| Adenocarcinoma | 32 | 80.0 |
| Squamous cell carcinoma | 8 | 20.0 |
| Staging | ||
| IIIA | 2 | 5.0 |
| IIIB | 7 | 17.5 |
| IVA | 12 | 30.0 |
| IVB | 19 | 47.5 |
| Therapy types | ||
| Platinum-based chemotherapy | 14 | 35.0 |
| Other chemotherapy | 3 | 7.5 |
| Targeted therapy only | 10 | 25.0 |
| External radiation only | 4 | 10.0 |
| External radiation | 3 | 7.5 |
| External radiation | 1 | 2.5 |
| Not receiving any therapy yet | 5 | 12.5 |
| Response | ||
| PR | 15 | 60.0 |
| SD | 4 | 16.0 |
| PD | 6 | 24.0 |
PD, progressive disease; PR, partial response; SD, stable disease.
3.2Analysis of association between miR-10b, suPAR, and PAI-1 and clinicopathological characteristics
Statistical analysis on the correlation between Mir-10b, SuPAR, PAI-1 and clinicopathological features such as age, gender, histologic type and clinical stage were performed. There were no correlation between absolute miR-10b and age (
Table 2
Expression of miR-10b, suPAR, and PA-I levels based on disease progression
| Parameter | Non-progressive ( | Progressive ( | |
|---|---|---|---|
| miR-10b | |||
| Absolute miR-10b | 1,064,134.5 | 226,851.3 | 0.072 |
| (copies/mL) | (79,575.9–32,279,674.0) | (65,514.9–10,846,092.7) | |
| miR-10b FC | 0.189 (0.003–2.305) | 0.041 (0.014–5.637) | 0.065 |
| suPAR (pg/mL) | 2,461 (2,276–8,379) | 4,792 (2,278–19,646) | 0.005 |
| PAI-1 (ng/mL) | 4.63 (0.72–9.96) | 2.38 (0.45–19.72) | 0.156 |
Table 3
Subgroup analysis of miR-10b, suPAR, and PAI-I based on treatment response
| Parameter | Good response ( | Poor response ( | |
|---|---|---|---|
| miR-10b | |||
| Absolute miR-10b | 1,064,134.5 | 228,125.6 | 0.096 |
| (copies/mL) | (79,575.9–32,279,674.0) | (65,514.9–10,846,092.7) | |
| miR-10b FC | 0.189 (0.03–2.305) | 0.048 (0.014–5.637) | 0.128 |
| suPAR (pg/mL) | 2,452 (2,276–8,379) | 4,709 (2,278–19,646) | 0.015 |
| PAI-1 (ng/mL) | 4.81 (1.24–9.69) | 2.47 (0.45–19.72) | 0.015 |
Figure 1.
Kaplan–Meier curve of overall survival according to disease progression.
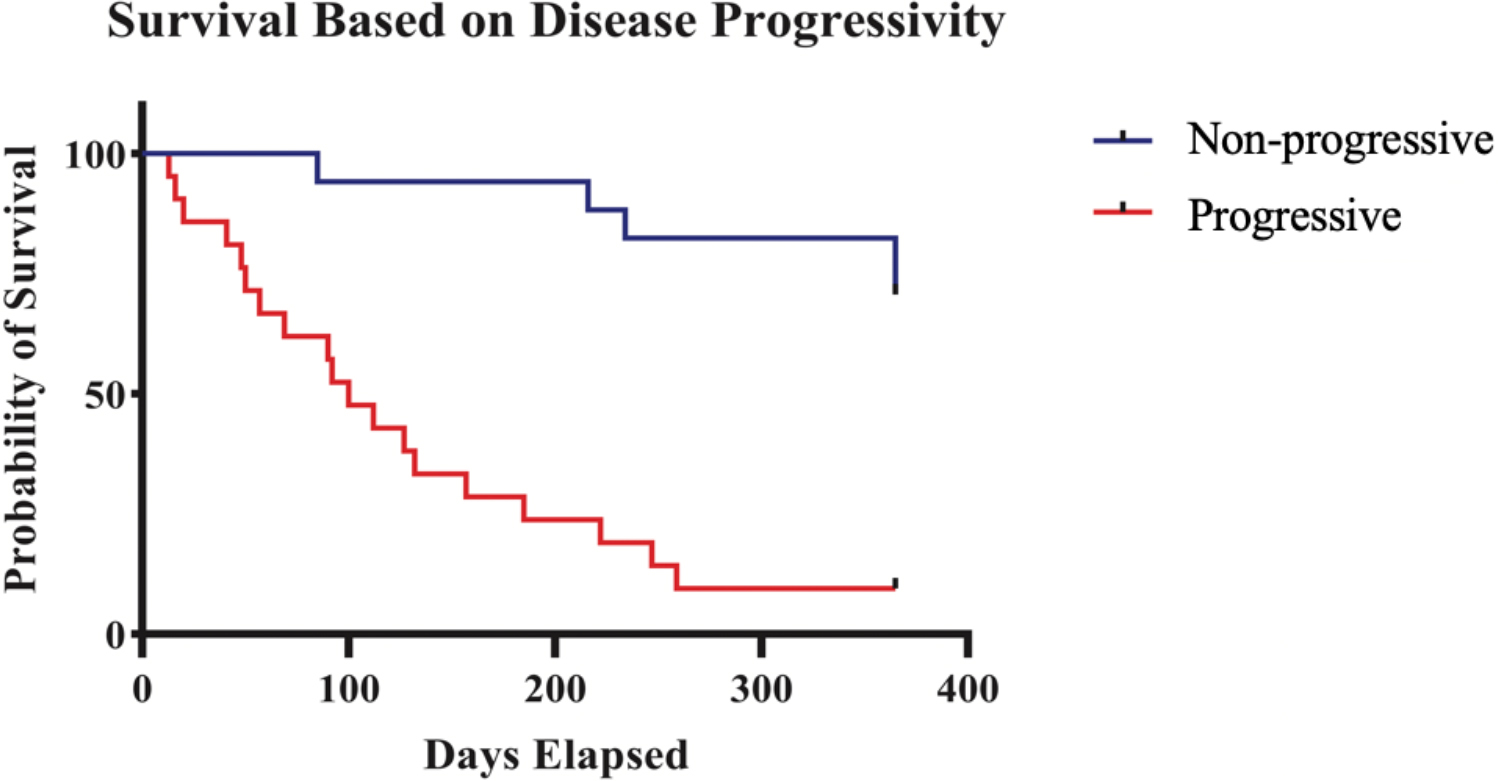
Figure 2.
Kaplan–Meier curve of overall survival according to treatment response.
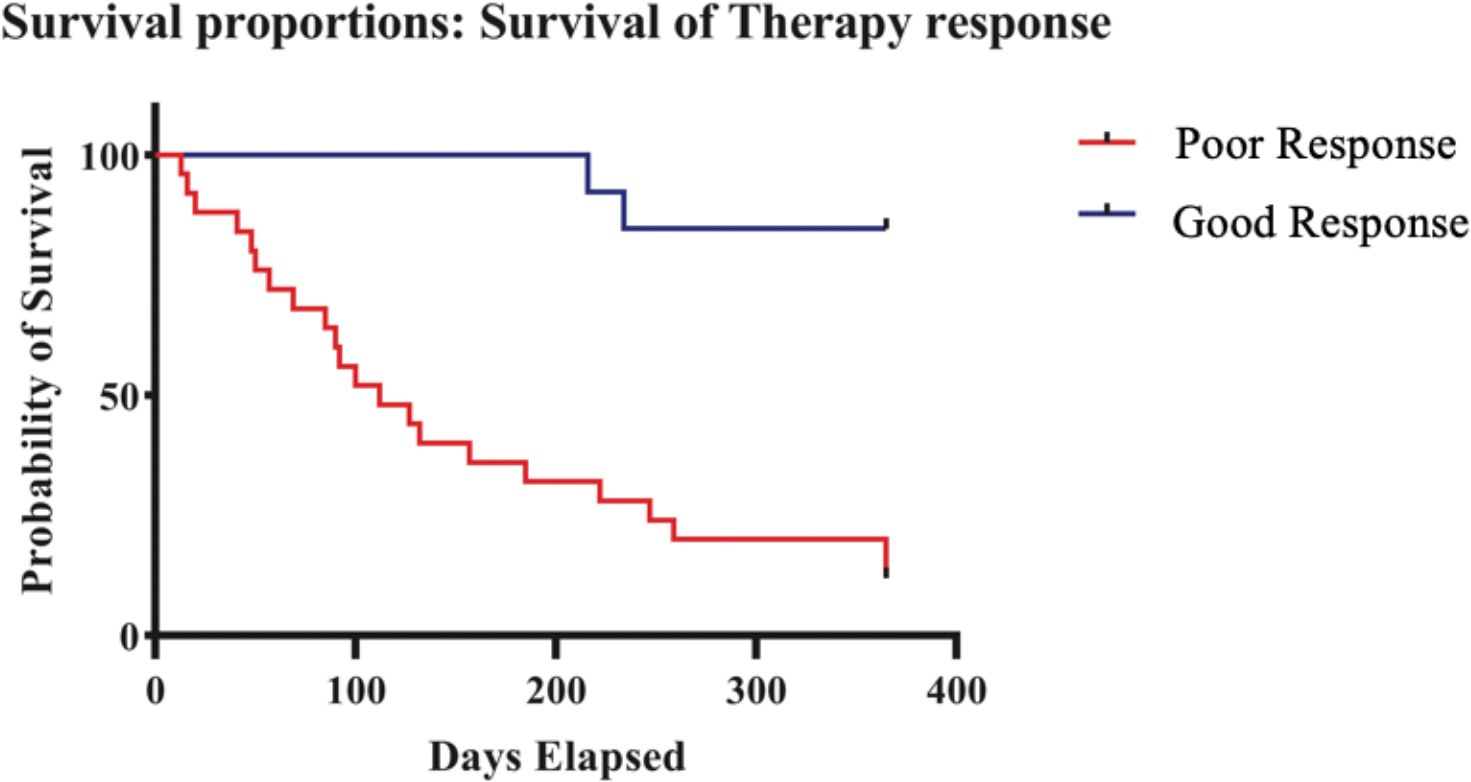
Figure 3.
Scatter plots of association between miR-10b, SuPAR, and PA-I with age. (A) Scatter plot for Absolute miR-10b showing
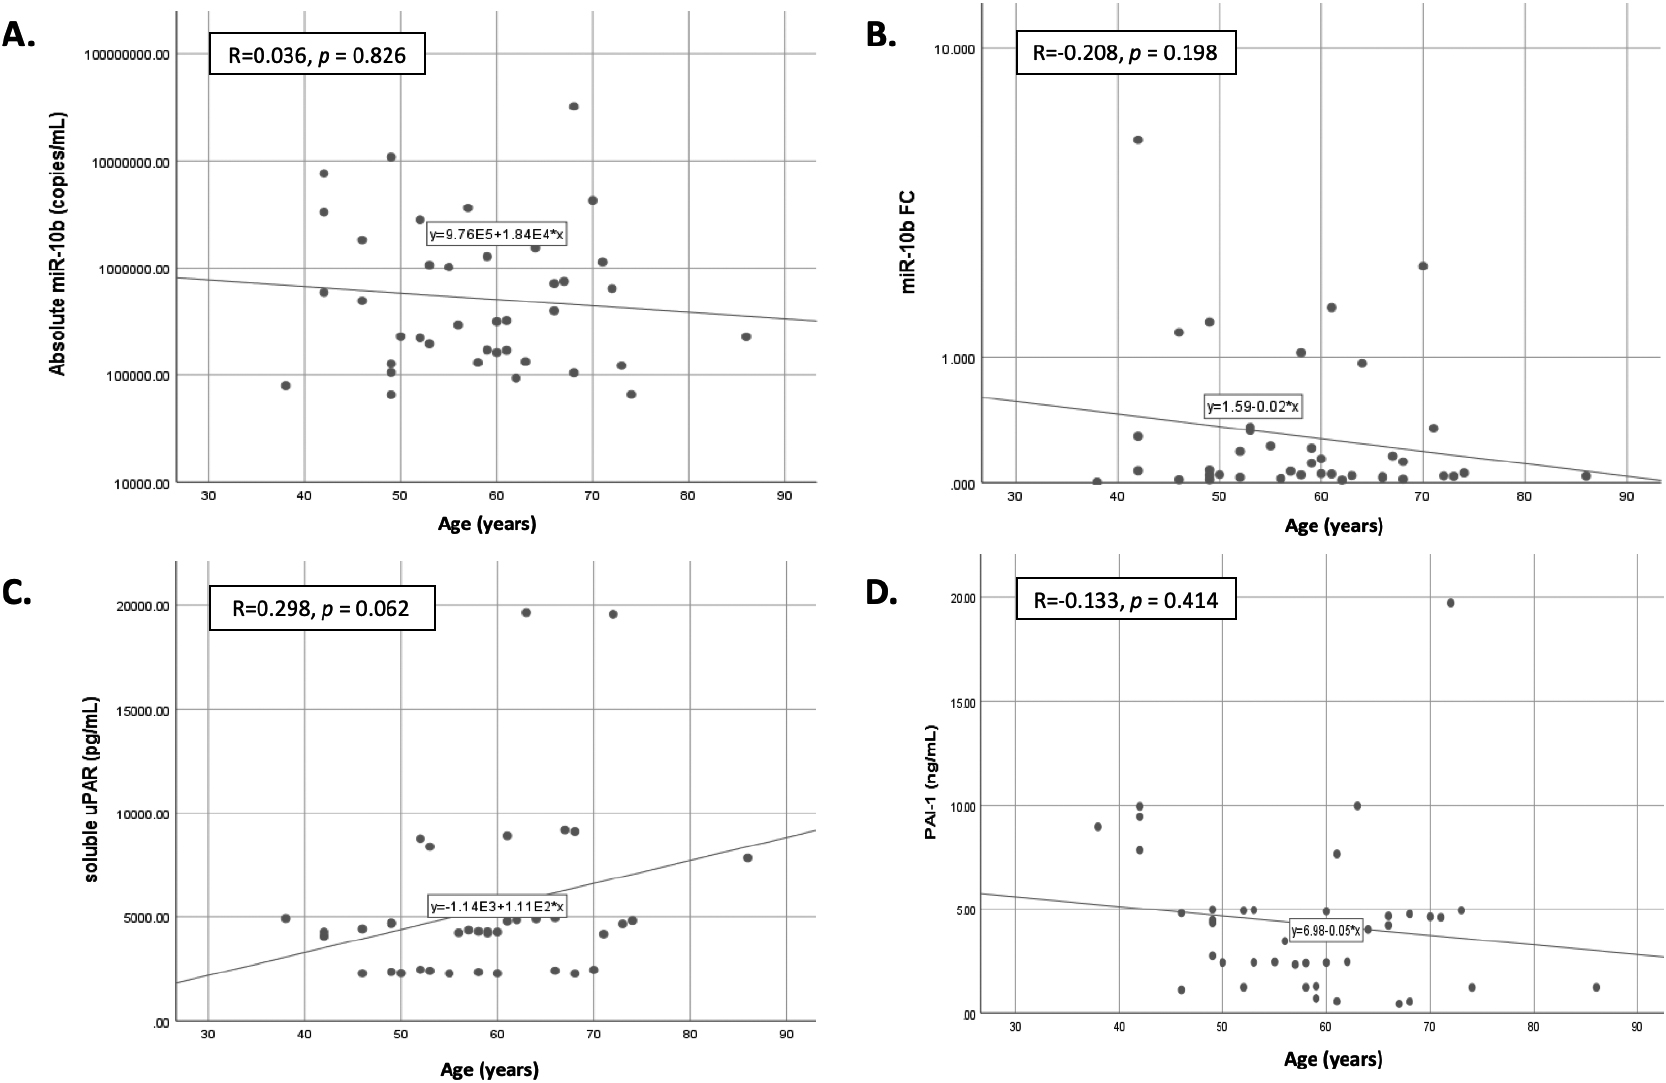
Figure 4.
Scatter plots of association between miR-10b, SuPAR, and PA-I with gender. (A) Scatter plot for Absolute miR-10b showing a median of 395,953.4 in male vs 293,889.5 in female (
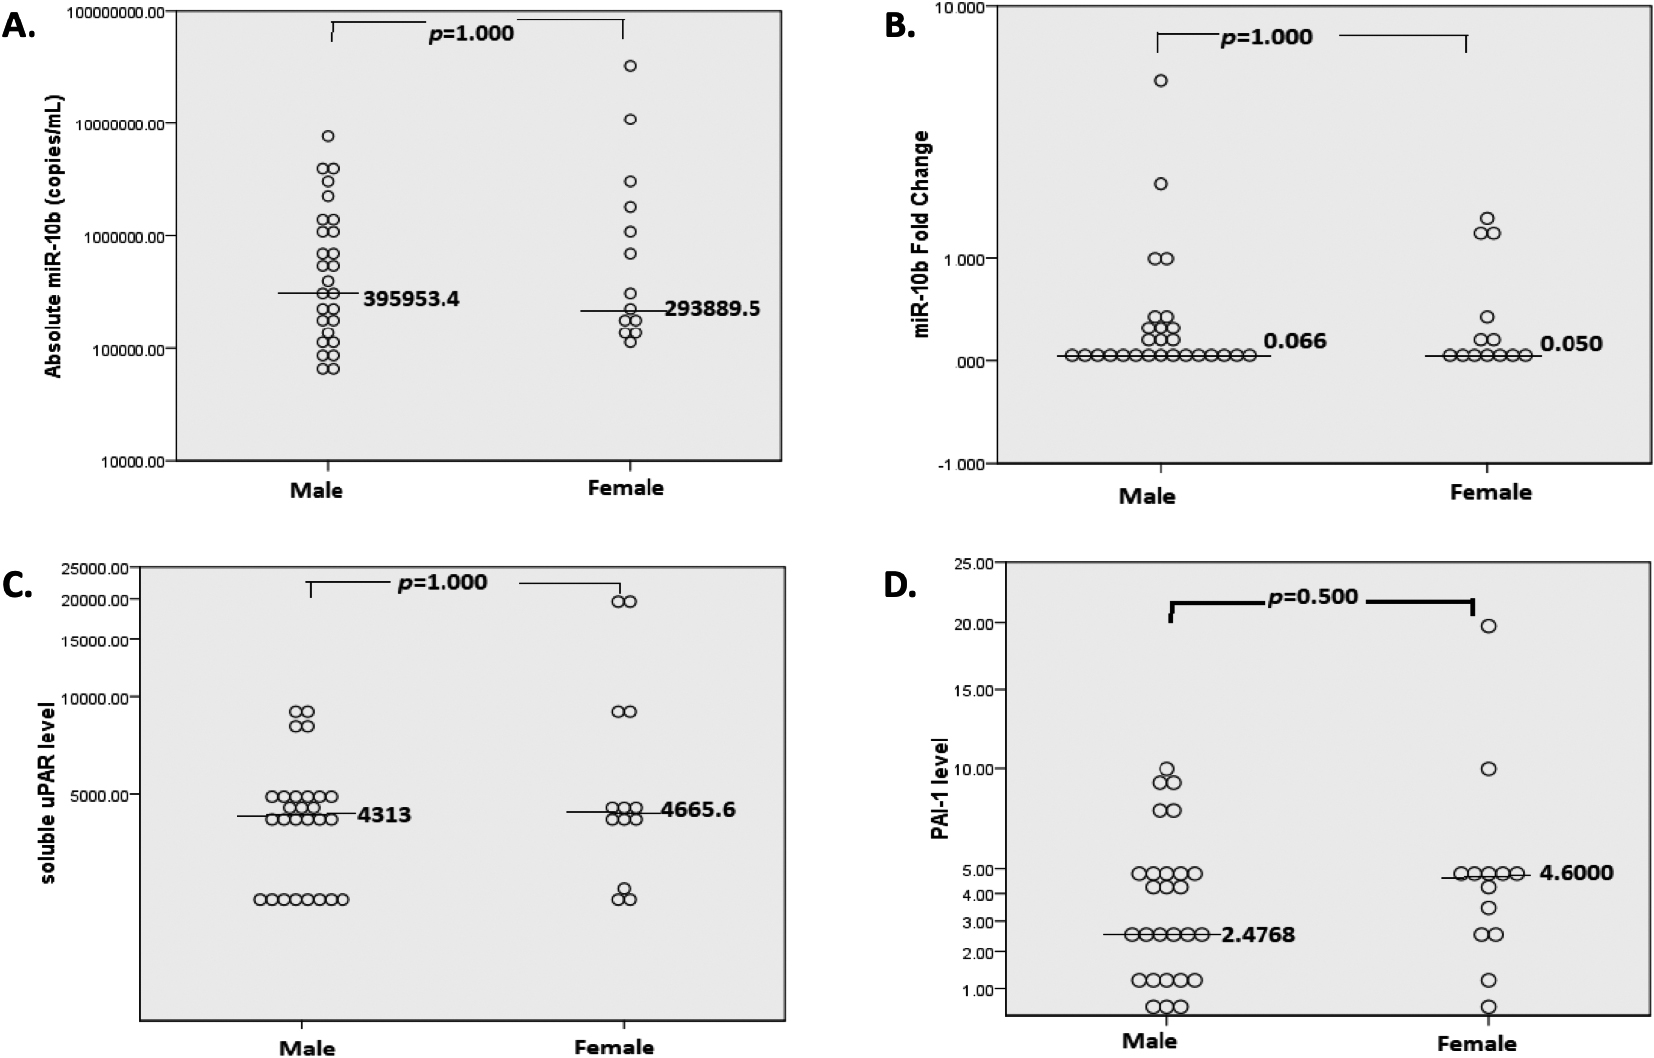
Figure 5.
Scatter plots of association between miR-10b, SuPAR, and PA-I with histopathology characteristics. (A) Scatter plot for Absolute miR-10b showing a median of 444,582.65 in adenocarcinoma vs 319,691.9 in SCC (
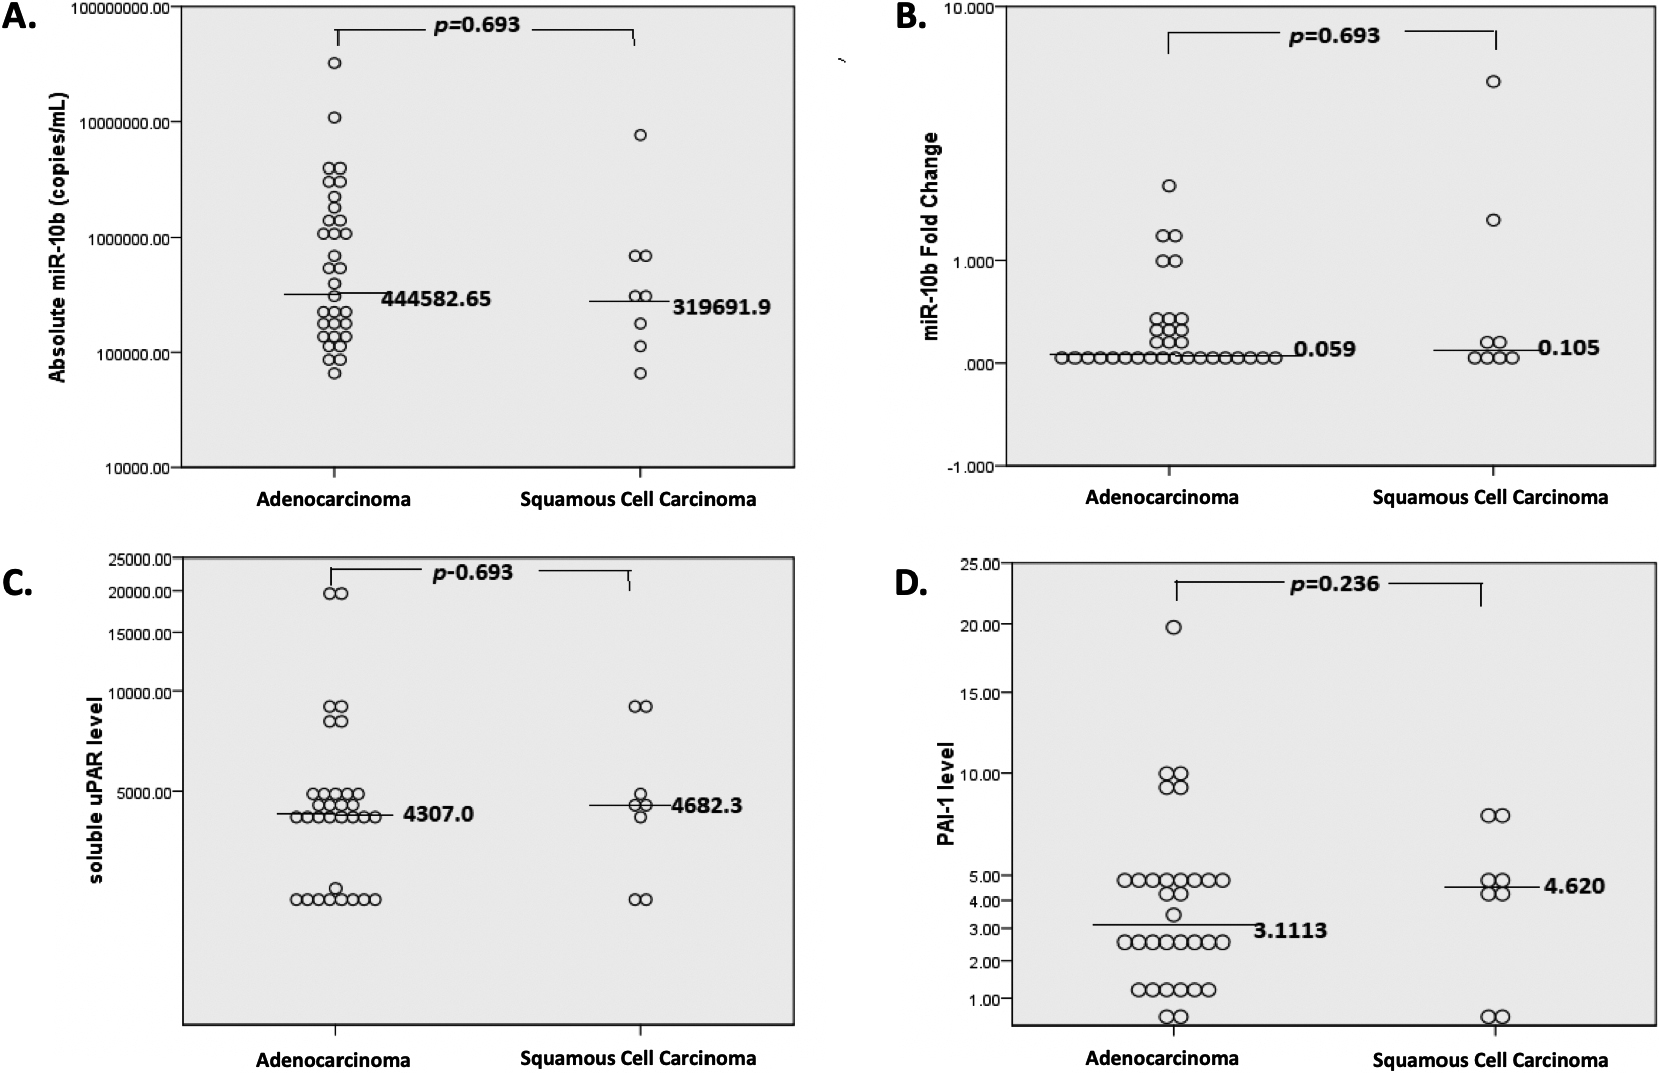
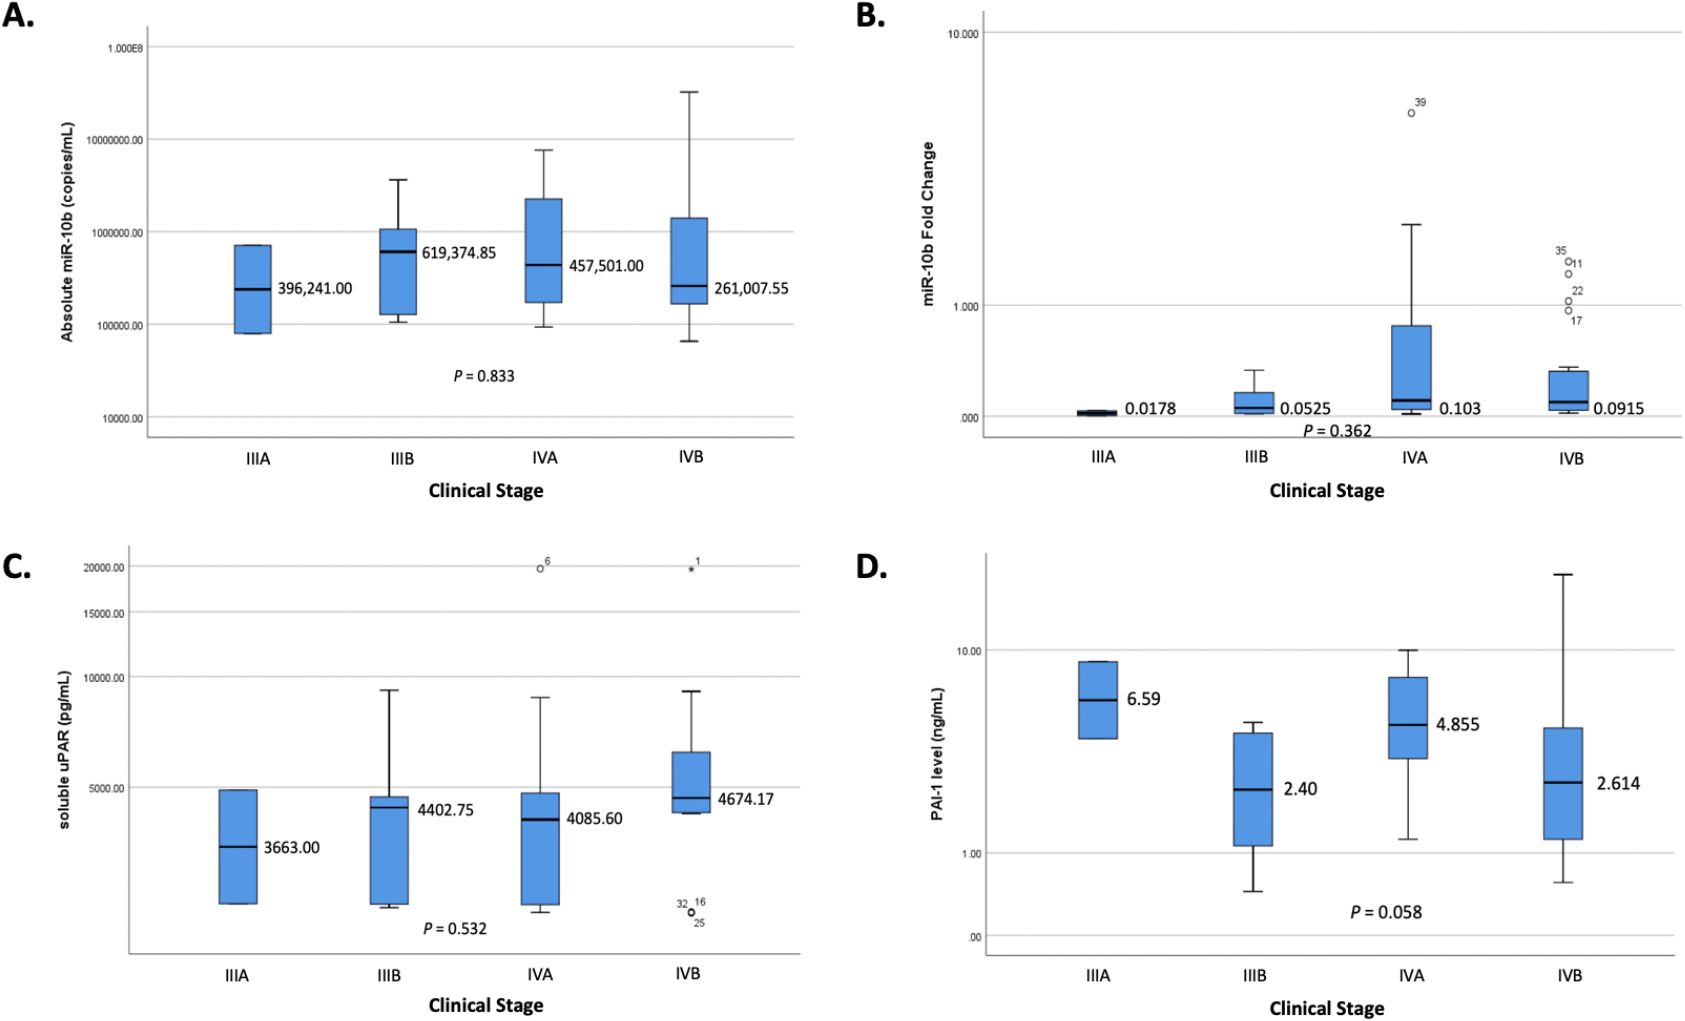
Figure 6.
Association between miR-10b, SuPAR, and PA-I with clinical stage.
3.3Analysis of association between miR-10b, suPAR, and PAI-1 and disease progression and treatment response
Based on disease progression, miR-10b expression and PAI-levels tended to be higher in non-progressive than PD (
Figure 7.
Level of Absolute miR-10b based on disease progression. (The horizontal line indicated either the mean [for normally distributed data] or median [for non-normally distributed data] of the data).
![Level of Absolute miR-10b based on disease progression. (The horizontal line indicated either the mean [for normally distributed data] or median [for non-normally distributed data] of the data).](https://ip.ios.semcs.net:443/media/cbm/2024/39-2/cbm-39-2-cbm220222/cbm-39-cbm220222-g007.jpg)
Figure 8.
Level of miR-10b FC based on disease progression. (The horizontal line indicated either the mean [for normally distributed data] or median [for non-normally distributed data] of the data).
![Level of miR-10b FC based on disease progression. (The horizontal line indicated either the mean [for normally distributed data] or median [for non-normally distributed data] of the data).](https://ip.ios.semcs.net:443/media/cbm/2024/39-2/cbm-39-2-cbm220222/cbm-39-cbm220222-g008.jpg)
Figure 9.
Level of suPAR based on disease progression. (The horizontal line indicated either the mean [for normally distributed data] or median [for non-normally distributed data] of the data).
![Level of suPAR based on disease progression. (The horizontal line indicated either the mean [for normally distributed data] or median [for non-normally distributed data] of the data).](https://ip.ios.semcs.net:443/media/cbm/2024/39-2/cbm-39-2-cbm220222/cbm-39-cbm220222-g009.jpg)
Figure 10.
Level of PAI-1 based on disease progression. (The horizontal line indicated either the mean [for normally distributed data] or median [for non-normally distributed data] of the data).
![Level of PAI-1 based on disease progression. (The horizontal line indicated either the mean [for normally distributed data] or median [for non-normally distributed data] of the data).](https://ip.ios.semcs.net:443/media/cbm/2024/39-2/cbm-39-2-cbm220222/cbm-39-cbm220222-g010.jpg)
Figure 11.
Level of Absolute miR-10b based on treatment response. (The horizontal line indicated either the mean [for normally distributed data] or median [for non-normally distributed data] of the data).
![Level of Absolute miR-10b based on treatment response. (The horizontal line indicated either the mean [for normally distributed data] or median [for non-normally distributed data] of the data).](https://ip.ios.semcs.net:443/media/cbm/2024/39-2/cbm-39-2-cbm220222/cbm-39-cbm220222-g011.jpg)
Figure 12.
Level of miR-10b FC based on treatment response. (The horizontal line indicated either the mean [for normally distributed data] or median [for non-normally distributed data] of the data).
![Level of miR-10b FC based on treatment response. (The horizontal line indicated either the mean [for normally distributed data] or median [for non-normally distributed data] of the data).](https://ip.ios.semcs.net:443/media/cbm/2024/39-2/cbm-39-2-cbm220222/cbm-39-cbm220222-g012.jpg)
Figure 13.
Level of suPAR based on treatment response. (The horizontal line indicated either the mean [for normally distributed data] or median [for non-normally distributed data] of the data).
![Level of suPAR based on treatment response. (The horizontal line indicated either the mean [for normally distributed data] or median [for non-normally distributed data] of the data).](https://ip.ios.semcs.net:443/media/cbm/2024/39-2/cbm-39-2-cbm220222/cbm-39-cbm220222-g013.jpg)
Figure 14.
Level of PAI-1 based on treatment response. (The horizontal line indicated either the mean [for normally distributed data] or median [for non-normally distributed data] of the data).
![Level of PAI-1 based on treatment response. (The horizontal line indicated either the mean [for normally distributed data] or median [for non-normally distributed data] of the data).](https://ip.ios.semcs.net:443/media/cbm/2024/39-2/cbm-39-2-cbm220222/cbm-39-cbm220222-g014.jpg)
3.4Cut-off point Analysis of Absolute miR-10b, miR-10b FC, suPAR, and PAI-1
Cut-off analysis with ROC curve was performed and yielded an area under curve (AUC) of 0.659 (
Figure 15.
ROC curve to determine cut-off points of absolute miR-10b.
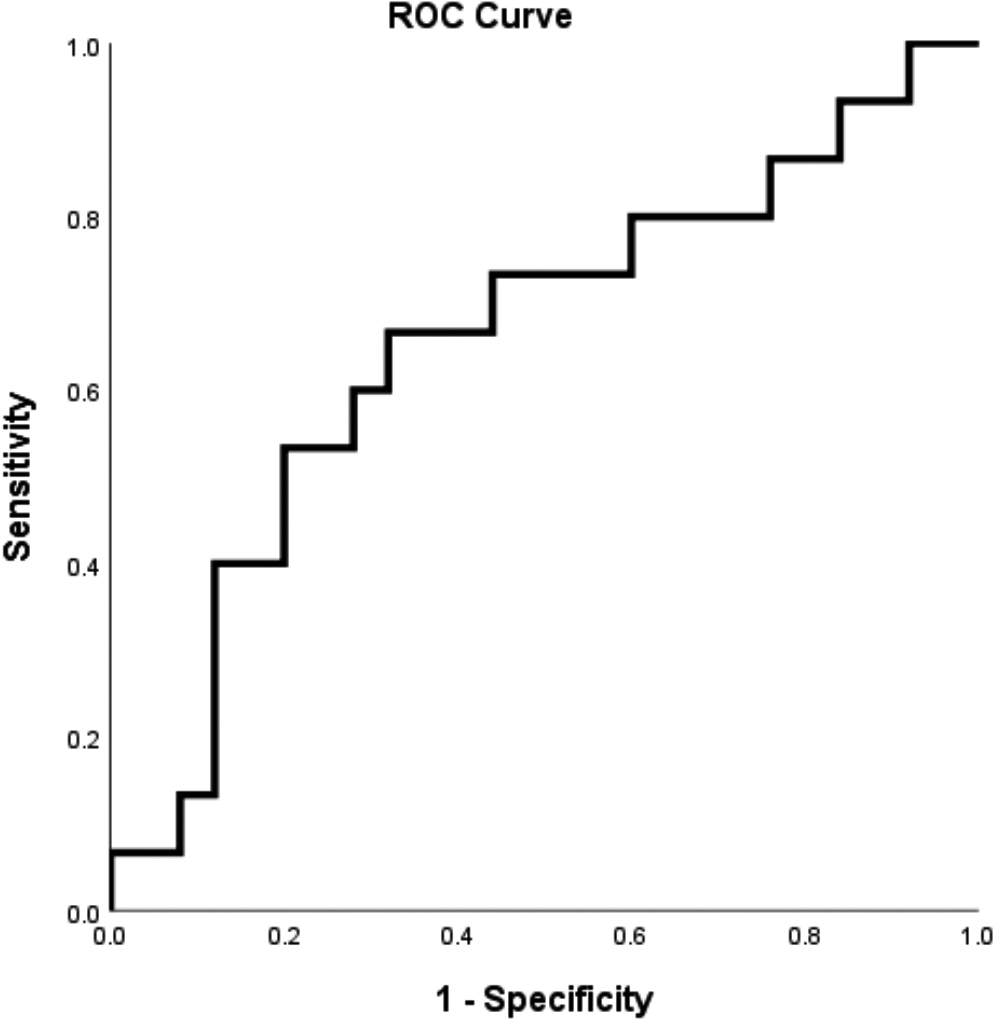
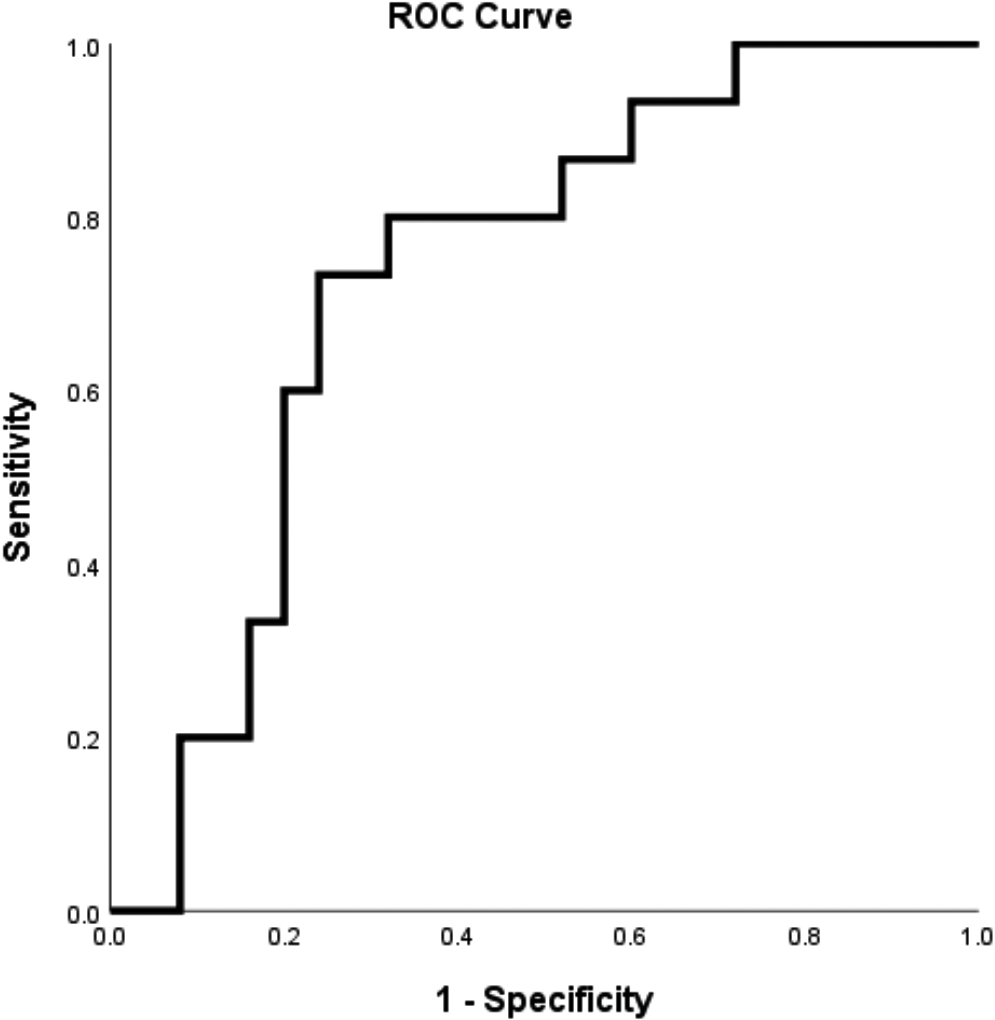
Figure 16.
ROC curve to determine cut-off points of miR-10b FC.
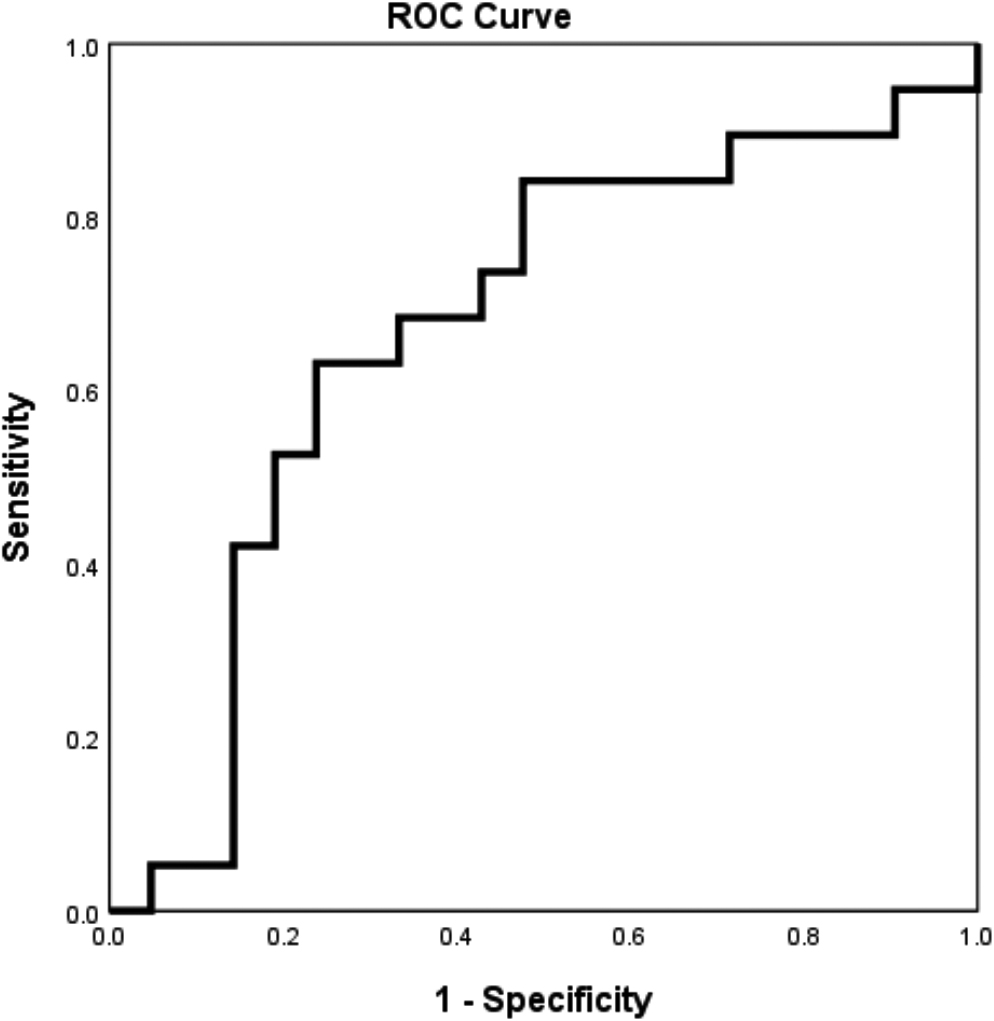
Meanwhile, cut-off level determination for prediction of progression yielded an AUC of 0.819 (
Figure 17.
ROC curve to determine cut-off points of suPAR.
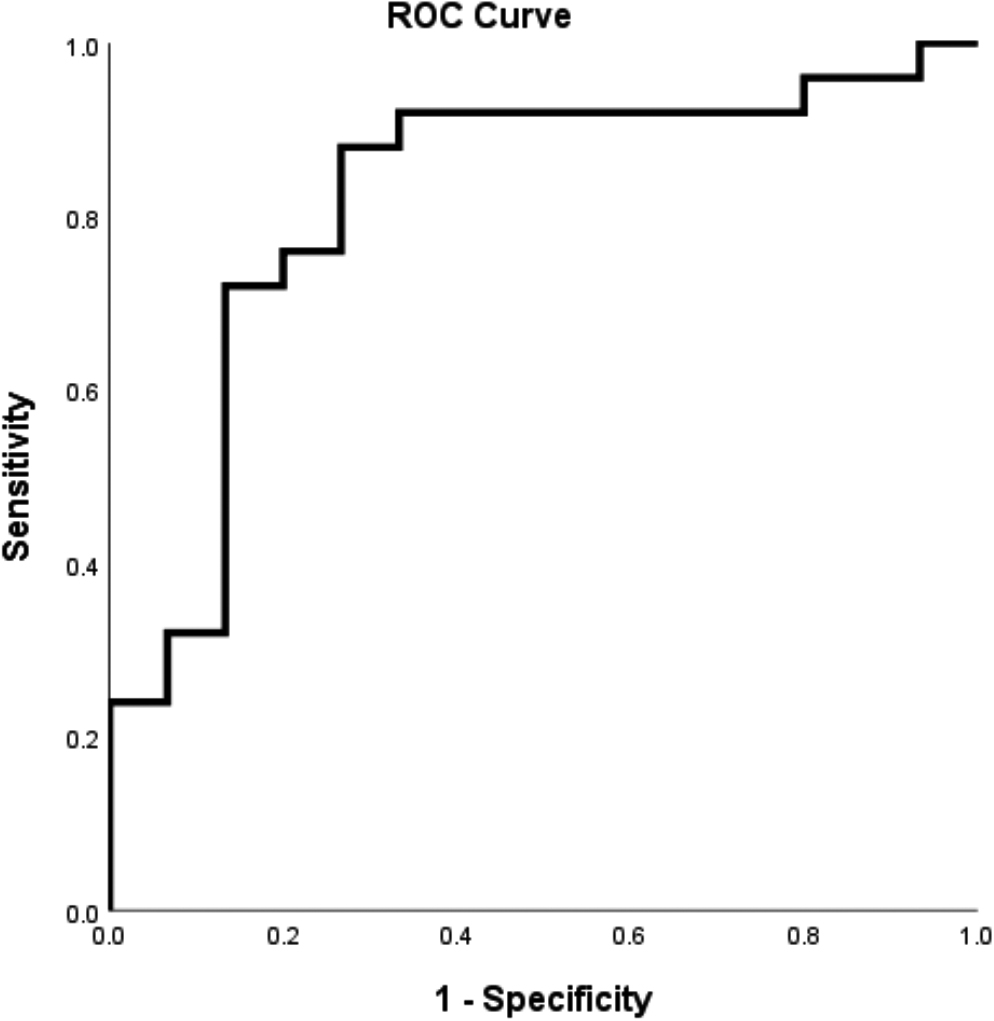
Figure 18.
ROC curve to determine cut-off points of PAI-1.
3.5Prediction model association with disease progression and treatment response
3.5.1Bivariate analysis
Bivariate analysis of factors associated with disease progression and treatment response was conducted using logistic regression analysis. Absolute miR-10b expression > 592,145 copies/
Table 4
Factors associated with disease progression
| Variable | Non-progressive ( | Progressive ( | OR | 95% CI | |
|---|---|---|---|---|---|
| Absolute miR-10b | |||||
| | 7 (31.8%) | 15 (68.2%) | 0.028 | 0.233 | 0.062–0.881 |
| | 12 (66.7%) | 6 (33.3%) | |||
| miR-10b FC | |||||
| | 6 (31.6%) | 14 (67.7%) | 0.027 | 0.231 | 0.061–0.869 |
| | 13 (68,4%) | 7 (33,3%) | |||
| suPAR levels | |||||
| | 12 (85.7%) | 2 (14.3%) |
| 16.286 | 2.888–91.833 |
| | 7 (26.9%) | 19 (73.1%) | |||
| PAI-1 levels | |||||
| | 8 (34.8%) | 15 (65.2%) | 0.061 | 0.291 | 0.078–1.082 |
| | 11 (64.7%) | 6 (35.3%) |
OR, odds ratio.
Table 5
Factors associated with treatment response
| Variable | Good response ( | Poor response ( | OR | 95% CI | |
|---|---|---|---|---|---|
| Absolute miR-10b | |||||
| | 5 (22.7%) | 17 (77.3%) | 0.033 | 0.235 | 0.060–0.920 |
| | 10 (55.6%) | 8 (44.4%) | |||
| miR-10b FC | |||||
| | 4 (20.0%) | 16 (80.0%) | 0.022 | 0.205 | 0.050–0.834 |
| | 11 (55.0%) | 9 (45.0%) | |||
| suPAR levels | |||||
| | 11(78.6%) | 3 (21.4%) |
| 20.167 | 3.824–106.353 |
| | 4 (15.4%) | 22 (84.6%) | |||
| PAI-1 levels | |||||
| | 4 (17,.4%) | 19 (82.6%) | 0.002 | 0.115 | 0.026–0.498 |
| | 11 (64.7%) | 6 (35.3%) |
OR, odds ratio.
3.5.2Multivariate analysis
Multivariate analysis of disease progression showed that suPAR levels
Table 6
Multivariate analysis to predict independent factor of disease progression
| Variable | B | SE | OR | CI 95% | ||
|---|---|---|---|---|---|---|
| miR-10b FC | 0.786 | 0.343 | 0.073–1.601 | 0.173 | ||
| suPAR levels (pg/mL) | 2.585 | 0.902 | 2.866 | 13.265 | 2.265–77.701 | 0.006 |
| Constant |
OR, odds ratio.
However, in the final model, we include miR-10b FC (ORadj; 0.343; 95% CI, 0.073–1.601;
The probability to predict progression was as follows:
where Pr represents probability of progression, miR-10b represents miR-10b FC, and suPAR represents levels of suPAR (pg/mL).
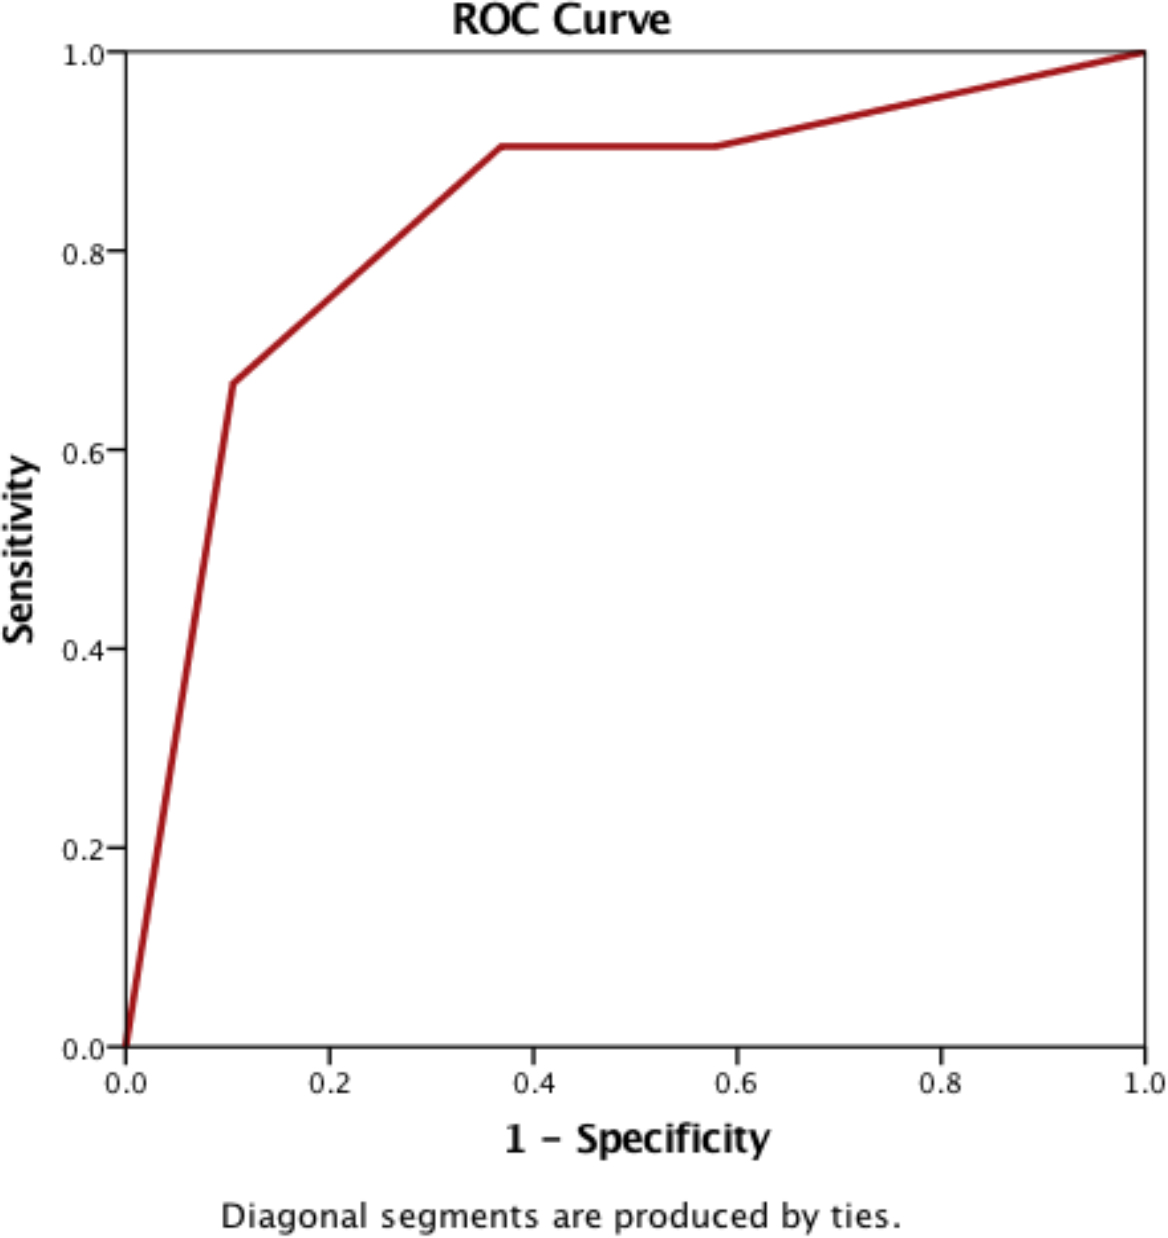
ROC curve analysis (Fig. 19) of the prediction model identified an AUC value of 0.833 (95% CI, 0.701–0.966). Hosmer–Lemeshow goodness-of-fit test obtained a
Figure 19.
ROC curve of the model to predict disease progression..
Multivariate analysis showed that miR-10b expression could not be used as an independent predictor of treatment response. On the other hand, suPAR was an independent risk factor for poor response (ORadj), 15.609; 95% CI, 2.221–109.704;
Table 7
Multivariate analysis to predict independent factors of poor treatment response
| Variable | B | SE | OR | CI 95% |
| |
|---|---|---|---|---|---|---|
| miR-10b FC | 0.940 | 0.305 | 0,048–1,926 | 0.207 | ||
| suPAR levels (pg/mL) | 2.748 | 0.995 | 2.762 | 15.609 | 2.221–109.704 | 0.006 |
| PAI-1 levels (ng/mL) | 0.968 | 2.135 | 0.127 | 0.019–0.843 | 0.033 | |
| Constant | 0.391 |
The linear regression equation to predict poor response was:
The probability of poor response after treatment was calculated as:
where Pr represents the probability of having poor response, suPAR represents suPAR (pg/mL), and PAI-1 represents plasma PAI-1 levels (ng/mL).
Figure 20.
ROC curve to predict treatment response..
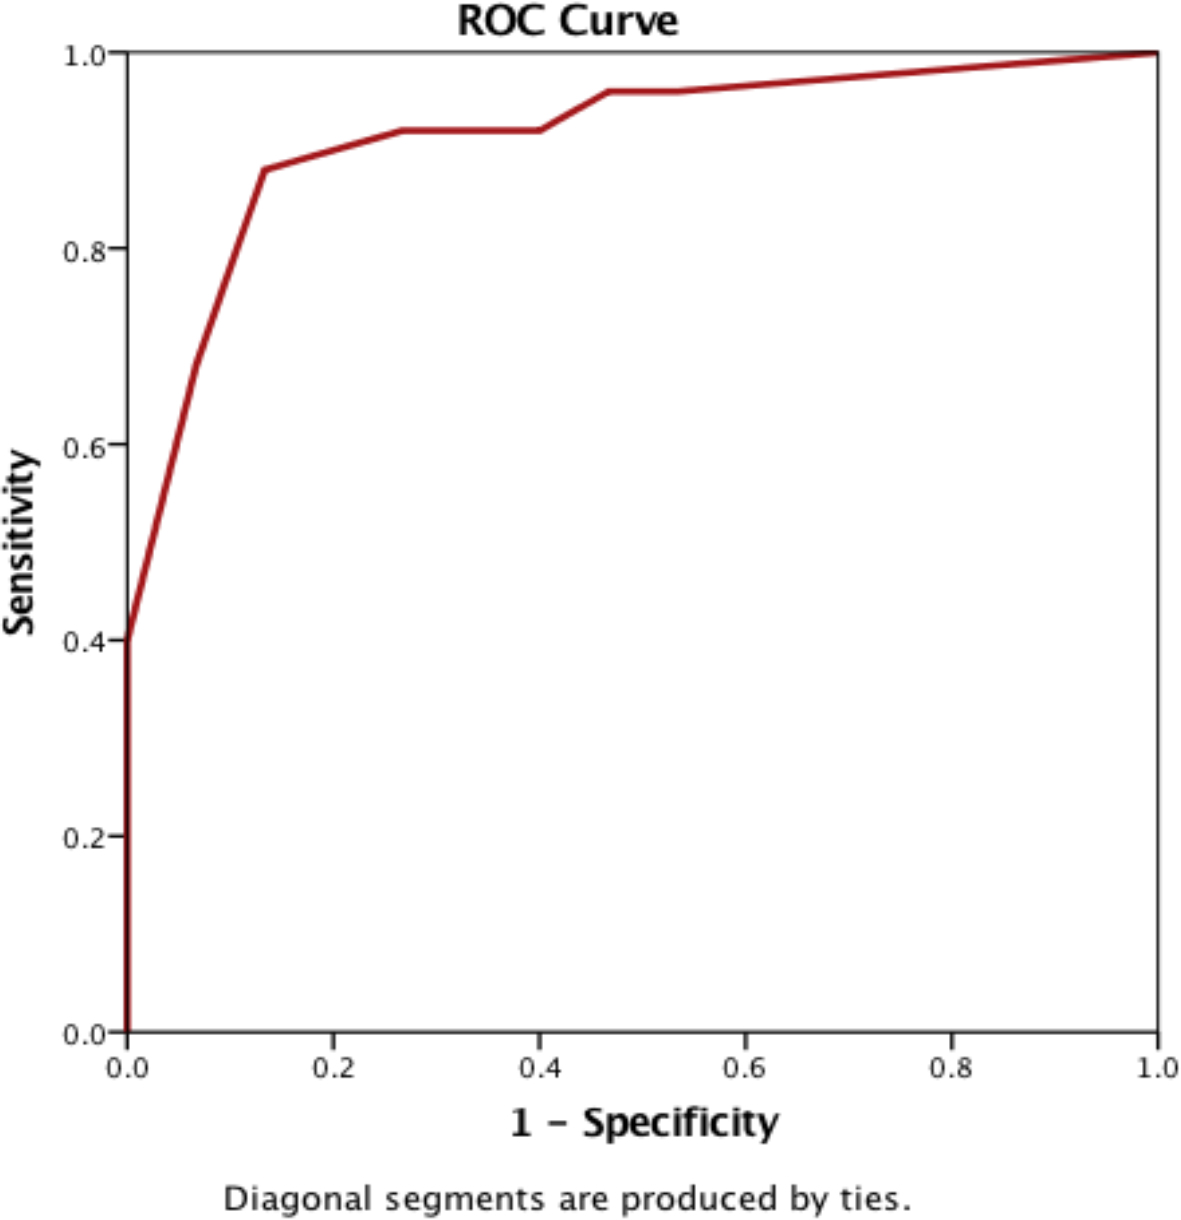
The ROC curve analysis (Fig. 20) showed that the prediction model had a high accuracy, with an AUC of 0.915 (95% CI, 0.824–1.000). Hosmer–Lemeshow goodness-of-fit test obtained a
3.6Factors associated with survival and mortality
Kaplan–Meier survival analysis and Cox’s proportional hazard test were conducted to evaluate the use of the model as predictor for survival in NSCLC. The median survival in participants with high absolute miR-10b expression was significantly longer than those with low absolute miR-10b expression levels (12.7 vs. 3.7 months). Cox proportional hazard regression analysis yielded an HR of 0.411 (95% CI, 0.179–0.943;
Table 8
Factors associated with mortality and survival
| Variable | Alive ( | Death ( | P^ | HR^ | CI 95%^ |
|---|---|---|---|---|---|
| Absolute miR-10b | |||||
| | 7 (31.8%) | 15 (68.2%) | 0.036 | 0.411 | 0.179–0.943 |
| | 9 (50.0%) | 9 (50.0%) | |||
| miR-10b FC | |||||
| | 6 (30.0%) | 14 (70.0%) | 0.014 | 0.357 | 0.157–0.809 |
| | 10 (50.0%) | 10 (50.0%) | |||
| suPAR levels | |||||
| | 10 (71.4%) | 4 (28.6%) | 0.003 | 5.311 | 1.790–15.752 |
| | 6 (23.1%) | 20 (76.9%) | |||
| PAI-1 levels | |||||
| | 7 (30.4%) | 16 (69.6%) | 0.373 | 0.679 | 0.290–1.590 |
| | 9 (52.9%) | 8 (47.1%) |
^ Cox’s proportional hazard test.
Kaplan–Meier survival analysis showed that the median survival for patients with suPAR levels
Table 9
Cox regression analysis to predict prognostic factor
| Variable | B | SE | HR | 95% CI | |
|---|---|---|---|---|---|
| miR-10b FC | 0.423 | 0.441 | 0.192–1.010 | 0.053 | |
| suPAR levels (pg/mL) | 1.542 | 0.561 | 4.672 | 1.555–14.038 | 0.006 |
Cox’s regression analysis was performed to determine prognostic factors and showed that miR-10b FC
4.Discussion
Detection of circulating miRNA in cancer still faces technical difficulties and inconsistent results have been reported. Clinically, circulating miRNA may fluctuate because of treatment, diet, and other factors that may affect its analysis. Lymphoid and myeloid cells may affect miRNA levels and viral infection has also been reported to affect endogenous miRNA expression [18]. miRNA expression changes more rapidly in blood than tissue, and traumatic venipuncture also potentially affects results. A disadvantage of absolute quantification is that it is dependent on RNA quality and is, therefore, only reliable in good quality RNA samples [19]. We expected that the use of a standardized procedure and reagents in the present study would yield useful results highlighting the application of miRNA, PAI-1, and suPAR as biomarkers for prediction of treatment response and progression in NSCLC patients.
In the present study, both absolute and relative quantification of miRNA expression was performed. Relative quantification is the most common approach used by researchers, especially in tissue specimens, as it allows direct comparisons between studies. Absolute quantification is usually not recommended since it heavily depends on the quality of RNA [14]. Nevertheless, absolute quantification of circulating miRNA, if performed using a standardized method that is shown to be reliable, is more applicable in clinical practice and allows quantitative monitoring of the disease.
The role of miR-10b in cancer remains controversial partly due to the heterogeneity of circulating miR-10b expression in tumor cells [20]. miR-10b was initially identified as a tumor-suppressor gene with lower expression in primary breast tumors than normal breast tissue [21]. Further studies showed that miR-10b was associated with metastasis in advanced breast cancer, implying a dual function of miR-10b [22, 23]. miR-10b has also been shown to be involved in breast cancer metastasis and its overexpression was associated with tumor cell invasiveness. However, the association between miR-10b expression and metastasis is not always observed in other types of malignancy. In renal clear cell carcinoma, lower expression of miR-10b was associated with worse prognosis [24].
We found higher absolute miR-10b expression in NSCLC patients than healthy individuals. On the other hand, relative miR-10b expression was low in NSCLC patients as well as healthy individuals, although this was lower in healthy individuals. The overexpression of miR-10b observed in NSCLC patients was consistent with other studies. Roghayeh et al. found a significant increase in miR-10b expression in the plasma of NSCLC patients (
Bivariate analysis of our prediction model showed that both absolute (
The findings of the present study are inconsistent with the findings from other studies that showed that high miR-10b expression was associated with advanced clinical stage of cancer, lymph node metastasis, distant metastasis, and poorer survival, and was a risk factor for prognosis in advanced NSCLC patients [8, 26, 27]. Huang et al. and Pan et al. found that miR-10b increased cell proliferation and inhibited apoptosis by targeting Klotho protein [28, 29]. Liu et al. found that miR-10b acted as an oncomir by positively targeting KLF4 and consequently promoting proliferation and invasion of the A549 NSCLC cell line [8].
The findings of the present study results may differ from those of previous studies since miR-10b expression tended to be lower in progressive patients or poor responders. It is unclear whether the low circulating miR-10b expression was due to increased activities in cancer tissue or cells that caused decreased apoptosis and active secretion of proapoptotic and proangiogenic miRNAs into the circulation. Another possible cause of the difference is that processing of plasma by double centrifugation, which aimed to reduce cellular contamination, may have resulted in the exosomal miRNAs being omitted from the analysis.
uPAR and PAI-1 are components of the fibrinolytic system that have been associated with prognosis of NSCLC. They are involved in extracellular matrix degradation and tissue remodeling, which are prerequisites for cancer cell invasion and metastasis.
Under normal conditions, cells and tissues exhibit limited uPAR expression. However, uPAR expression is greatly increased in most types of cancer, including NSCLC. uPAR is released from the plasma membrane via cleavage of its glycosylphosphatidylinositol anchor as suPAR, which is found at high levels in blood, urine, and cerebrospinal fluid [30]. Previous studies have shown that suPAR reflects membrane-bound uPAR expression in tissue and is a more reliable biomarker than uPAR [31, 32]. High suPAR levels were significantly correlated with NSCLC status [33, 34], disease progression, and poorer prognosis [35, 36, 37].
Our results support previous findings that the median suPAR expression in NSCLC patients was increased compared with the normal range. In terms of the clinical value of suPAR in predicting treatment response, we found significant differences in suPAR levels across the treatment response groups, with patients with non-PD showing low suPAR expression and PD patients showing high suPAR levels (
Bivariate analysis of our prediction model showed that suPAR levels
uPAR has been shown to be involved in the regulation of cell adhesion, migration, proliferation, chemotaxis, and survival via crosstalk with other transmembrane receptors, such as integrins, G protein-coupled chemotaxis receptors, and tyrosine kinase receptors [38, 39]. Chen et al. showed that uPAR was significantly correlated with lymph node metastasis and vascular involvement [40].
Binding of uPA to uPAR triggers the conversion of plasminogen to plasmin that degrades extracellular matrix/basement membranes and release of active metalloproteinases, which facilitate tumor cell invasion and metastasis. uPA–uPAR interaction also elicits signals that stimulate cell proliferation/survival and the expression of tumor-promoting genes, thus assisting tumor development [10, 40, 41]. Furthermore, the interaction of uPAR with vitronectin drives the transmigration of cancer cells from the blood to tissues and promotes cancer metastasis [11, 38]. Nevertheless, high suPAR levels were associated with PD and poorer prognosis.
The proteolytic functions of uPAR are negatively regulated by PAI-1 [43]. PAI-1 binds to uPA–uPAR to form a complex that is then internalized and undergoes endocytosis (i.e., is degraded) followed by partial recycling of the free form of uPAR from the endocytic compartment to the plasma membrane [44, 45].
Based on the mechanism of action of PAI-1 as an inhibitor of uPA, high PAI-1 levels should inhibit tumor migration and progression; however, previous studies have shown that high PAI-1 expression in tissues is associated with poor prognosis. Various mechanisms have been proposed to explain this paradox. PAI-1 enhances angiogenesis via its interaction with vitronectin and inhibition of proteases. Changes in the uPA/PAI-1 balance regulates cell signaling via a protease-independent mechanism [46]. Another mechanism is the inhibition of apoptosis, which was demonstrated in vitro by adding recombinant PAI-1 to tumor cells, resulting in PAI-1-induced inhibition of cytotoxic drug-induced apoptosis [47].
In contrast to previous studies, our study using plasma PAI-1 levels showed that patients with PR tended to have higher median PAI-1 levels. Furthermore, patients with a good treatment response also had a higher PAI-1 levels than those with poor response (
Bivariate analysis of our prediction model showed that PAI-1 levels
PAI-1 is expressed in almost all types of cells in the body and its transcription is regulated by various signals generated in response to stimuli. Inflammatory cytokines, including TNF-
The discrepancy between our findings and tissue-based findings may be due to the fact that PAI-1 is produced by many types of cells and is released from the alpha-granules of platelets [48], thus plasma PAI-1 may not necessarily reflect tumor PAI-1 expression levels. There are many factors involved in cancer pathophysiology and the immune system is likely to contribute to the treatment response by modulating PAI-1 activity, thereby increasing its levels in patients with a good treatment response [49].
4.1Research limitations
The present study was limited by the small number of participants. Clinical data in the medical records were often incomplete, especially the clinical characteristics data. Furthermore the participants’ characteristics were heterogeneous, which may contribute as a confounding factor.
5.Conclusion
The findings of the present study indicate that miR-10b cannot be used as an independent risk factor to predict NSCLC progression and treatment response. Plasma suPAR levels can be used to predict progression and treatment response, whereas plasma PAI-1 levels may be used to predict treatment response. Further studies are required to validate these prediction models.
Funding
This work was supported by grants from the Research and Development Department of Indonesian Ministry of Health; and the Research and Development Department of Dharmais Cancer Hospital.
Author contributions
LS, RaS, SBK, NS, ES, SM, RiS and NCS contributed to the conception of study, interpretation, and analysis of data. LS, FJ and SN prepared the manuscript, and RaS, SBK and NS supervised through the study and manuscript preparation.
Acknowledgments
The authors thank Drs. Achmad Mulawarman, Eddy Soeratman, Arif R. Hanafi, and M. Alfin Hanif for kindly refering their patients to this study, and Dr. Suhendro for statistical analysis. The authors would like to thank Enago (www.enago.com) for the English language review and Prof. Henry Huang for providing suggestions during review process.
Conflict of interest
The authors declare no conflict of interest.
References
[1] | Thandra, Krishna Chaitanya et al. “Epidemiology of lung cancer.” Contemporary oncology (Poznan, Poland) 25: (1) ((2021) ), 45–52. doi: 10.5114/wo.2021.103829. |
[2] | International Arctic Research Center, The global cancer observatory: Indonesia fact sheet (2020), World Health Organ ((2021) ). https://gco.iarc.fr/today/data/factsheets/populations/360-indonesia-fact-sheets.pdf. |
[3] | A.K. Greenberg and M.S. Lee, Biomarkers for lung cancer: clinical uses, Current Opinion in Pulmonary Medicine 13: ((2007) ), 249–255. doi: 10.1097/MCP.0b013e32819f8f06. |
[4] | J.R. Molina, P. Yang, S.D. Cassivi, S.E. Schild and A.A. Adjei, Non–small cell lung cancer: epidemiology, risk factors, treatment, and survivorship, Mayo Clinic Proceedings 83: ((2008) ), 584–594. doi: 10.4065/83.5.584. |
[5] | Y. Peng and C.M. Croce, The role of microRNAs in human cancer, Signal Transduction & Targeted Therapy 1: ((2016) ), 15004. doi: 10.1038/sigtrans.2015.4. |
[6] | B. Zhang, X. Pan, G.P. Cobb and T.A. Anderson, microRNAs as oncogenes and tumor suppressors, Developmental Biology 302: ((2007) ), 1–12. doi: 10.1016/j.ydbio.2006.08.028. |
[7] | L. Ma, Role of miR-10b in breast cancer metastasis, Breast Cancer Research: BCR 12: ((2010) ), 210. doi: 10.1186/bcr2720. |
[8] | Y. Liu, M. Li, G. Zhang and Z. Pang, MicroRNA-10b overexpression promotes non-small cell lung cancer cell proliferation and invasion, European Journal of Medical Research 18: ((2013) ), 41. doi: 10.1186/2047-783X-18-41. |
[9] | E.C. Gabazza, O. Taguchi, T. Yamakami, M. Machishi, H. Ibata and S. Suzuki, Evaluating Prethrombotic State in lung cancer using molecular markers, Chest 103: ((1993) ), 196–200. doi: 10.1378/chest.103.1.196. |
[10] | C. Jumper, E. Cobos and C. Lox, The circulating urokinase plasminogen activator (uPA) and its soluble receptor (suPAR) are not up-regulated by the circulating P105 fraction of the HER-2/neu proto-oncogene: in vivo evidence from patients with advanced non-small cell lung cancer (NSCLC), Anticancer Research 22: ((2002) ). |
[11] | H. Noh, S. Hong and S. Huang, Role of urokinase receptor in tumor progression and development, Theranostics 3: ((2013) ), 487–495. doi: 10.7150/thno.4218. |
[12] | J.S. Rao, C. Gondi, C. Chetty, S. Chittivelu, P.A. Joseph and S.S. Lakka, Inhibition of invasion, angiogenesis, tumor growth, and metastasis by adenovirus-mediated transfer of antisense uPAR and MMP-9 in non-small cell lung cancer cells, Molecular Cancer Therapeutics 4: ((2005) ), 1399–1408. doi: 10.1158/1535-7163.MCT-05-0082. |
[13] | J. Siracusa, N. Koulmann and S. Banzet, Circulating myomiRs: a new class of biomarkers to monitor skeletal muscle in physiology and medicine, Journal of Cachexia Sarcopenia & Muscle 9: ((2018) ), 20–27. doi: 10.1002/jcsm.12227. |
[14] | P.S. Mitchell, R.K. Parkin, E.M. Kroh, B.R. Fritz, S.K. Wyman, E.L. Pogosova-Agadjanyan, A. Peterson, J. Noteboom, K.C. O’Briant, A. Allen, D.W. Lin, N. Urban, C.W. Drescher, B.S. Knudsen, D.L. Stirewalt, R. Gentleman, R.L. Vessella, P.S. Nelson, D.B. Martin and M. Tewari, Circulating microRNAs as stable blood-based markers for cancer detection, Proceedings of the National Academy of Sciences of the United States of America 105: ((2008) ), 10513–10518. doi: 10.1073/pnas.0804549105. |
[15] | M. Thunø, B. Macho and J. Eugen-Olsen, SuPAR: the molecular crystal ball, Disease Markers 27: ((2009) ), 157–172. doi: 10.3233/DMA-2009-0657. |
[16] | W. Winnicki, G. Sunder-Plassmann, G. Sengölge, A. Handisurya, H. Herkner, C. Kornauth, B. Bielesz, L. Wagner, Ž. Kikić, S. Pajenda, T. Reiter, B. Schairer and A. Schmidt, Diagnostic and prognostic value of soluble urokinase-type plasminogen activator receptor (suPAR) in focal segmental glomerulosclerosis and impact of detection method [sci rep.], Scientific Reports 9: ((2019) ), 13783. doi: 10.1038/s41598-019-50405-8. |
[17] | E.A. Eisenhauer, P. Therasse, J. Bogaerts, L.H. Schwartz, D. Sargent, R. Ford, J. Dancey, S. Arbuck, S. Gwyther, M. Mooney, L. Rubinstein, L. Shankar, L. Dodd, R. Kaplan, D. Lacombe and J. Verweij, New response evaluation criteria in solid tumours: Revised RECIST guideline (version 1.1), European Journal of Cancer, (version 1.1) 45: ((2009) ), 228–247. doi: 10.1016/j.ejca.2008.10.026. |
[18] | J. Hayes, P.P. Peruzzi and S. Lawler, MicroRNAs in cancer: biomarkers, functions and therapy, Trends in Molecular Medicine 20: ((2014) ), 460–469. doi: 10.1016/j.molmed.2014.06.005. |
[19] | H. Schwarzenbach, A.M. da Silva, G. Calin and K. Pantel, Which is the accurate data normalization strategy for microRNA quantification? Clinical Chemistry 61: ((2015) ), 1333–1342. doi: 10.1373/clinchem.2015.239459. |
[20] | C. Gasch, P.N. Plummer, L. Jovanovic, L.M. McInnes, D. Wescott, C.M. Saunders, A. Schneeweiss, M. Wallwiener, C. Nelson, K.J. Spring, S. Riethdorf, E.W. Thompson, K. Pantel and A.S. Mellick, Heterogeneity of miR-10b expression in circulating tumor cells, Scientific Reports 5: ((2015) ), 15980. doi: 10.1038/srep15980. |
[21] | M.V. Iorio, M. Ferracin, C.G. Liu, A. Veronese, R. Spizzo, S. Sabbioni, E. Magri, M. Pedriali, M. Fabbri, M. Campiglio, S. Ménard, J.P. Palazzo, A. Rosenberg, P. Musiani, S. Volinia, I. Nenci, G.A. Calin, P. Querzoli, M. Negrini and C.M. Croce, MicroRNA gene expression deregulation in human breast cancer, Cancer Research 65: ((2005) ), 7065–7070. doi: 10.1158/0008-5472.CAN-05-1783. |
[22] | L. Ma, J. Teruya-Feldstein and R.A. Weinberg, Tumour invasion and metastasis initiated by microRNA-10b in breast cancer, Nature 449: ((2007) ), 682–688. doi: 10.1038/nature06174. |
[23] | F. Biagioni, N. Bossel Ben-Moshe, G. Fontemaggi, Y. Yarden, E. Domany and G. Blandino, The locus of microRNA-10b: A critical target for breast cancer insurgence and dissemination, Cell Cycle 12: ((2013) ), 2371–2375. doi: 10.4161/cc.25380. |
[24] | D. Tehler, N.M. Høyland-Kroghsbo and A.H. Lund, The miR-10 microRNA precursor family, RNA Biology 8: ((2011) ), 728–734. doi: 10.4161/rna.8.5.16324. |
[25] | S. Roghayeh, L. Hajie, S. Milad, S. Akbar, N. Masoud and Z. Nosratollah, Circulating MiR-10b, MiR-1 and MiR-30a expression profiles in lung cancer: possible correlation with clinico-pathologic characteristics and lung cancer detection, International Journal of Molecular and Cellular Medicine 8: ((2019) ), 118–129. |
[26] | J. Zhang, L. Xu, Z. Yang, H. Lu, D. Hu, W. Li, Z. Zhang, B. Liu and S. Ma, MicroRNA-10b indicates a poor prognosis of non-small cell lung cancer and targets E-cadherin, Clinical & Translational Oncology: Official Publication of the Federation of Spanish Oncology Societies & of the National Cancer Institute of Mexico 17: ((2015) ), 209–214. doi: 10.1007/s12094-014-1213-7. |
[27] | R. Sheervalilou, A.M. Khamaneh, A. Sharifi, M. Nazemiyeh, A. Taghizadieh, K. Ansarin and N. Zarghami, Using miR-10b, miR-1 and miR-30a expression profiles of bronchoalveolar lavage and sputum for early detection of non-small cell lung cancer, Biomedicine & Pharmacotherapy 88: ((2017) ), 1173–1182. doi: 10.1016/j.biopha.2017.02.002. |
[28] | J. Huang, C. Sun, S. Wang, Q. He and D. Li, microRNA miR-10b inhibition reduces cell proliferation and promotes apoptosis in non-small cell lung cancer (NSCLC) cells, Molecular Biosystems 11: ((2015) ), 2051–2059. doi: 10.1039/c4mb00752b. |
[29] | J.-Y. Pan, C.-C. Sun, S.-J. Li, J. Huang and D.-J Li, Role of miR-10b in non-small cell lung cancer (NSCLC) cells by targeting klotho, Cancer Cell Microenvironment 2: ((2015) ). |
[30] | N. Montuori, V. Visconte, G. Rossi and P. Ragno, Soluble and cleaved forms of the urokinase-receptor: degradation products or active molecules? Thrombosis & Haemostasis 93: ((2005) ), 192–198. doi: 10.1160/TH04-09-0580. |
[31] | C.F.M. Sier, R. Stephens, J. Bizik, A. Mariani, M. Bassan, N. Pedersen, L. Frigerio, A. Ferrari, K. Danø, N. Brünner and F. Blasi, The level of urokinase-type plasminogen activator receptor is increased in serum of ovarian cancer patients, Cancer Research 58: ((1998) ), 1843–1849. |
[32] | R.W. Stephens, A.N. Pedersen, H.J. Nielsen, M.J. Hamers, G. Høyer-Hansen, E. Rønne, E. Dybkjaer, K. Danø and N. Brünner, ELISA determination of soluble urokinase receptor in blood from healthy donors and cancer patients, Clinical Chemistry 43: ((1997) ), 1868–1876. doi: 10.1093/clinchem/43.10.1868. |
[33] | A. Loukeri, P.-D. Spithakis, C. Moschos, P. Loukeri, A. Bartzeliotou, A. Tzagkaraki, E. Stratos, D. Veldekis and C.F. Kampolis, Plasma levels of soluble urokinase plasminogen activator receptor (suPAR) as a possible biomarker for lung cancer and/or COPD, European Respiratory Journal 48: ((2016) ), PA2851. |
[34] | N. Montuori, A. Mattiello, A. Mancini, P. Taglialatela, M. Caputi, G. Rossi and P. Ragno, Urokinase-mediated posttranscriptional regulation of urokinase-receptor expression in non small cell lung carcinoma, International Journal of Cancer 105: ((2003) ), 353–360. doi: 10.1002/ijc.11091. |
[35] | C.D. Mauro, A. Pesapane, L. Formisano, R. Rosa, V. D’Amato, P. Ciciola, A. Servetto, R. Marciano, R.C. Orsini, F. Monteleone, N. Zambrano, G. Fontanini, A. Servadio, G. Pignataro, L. Grumetto, A. Lavecchia, D. Bruzzese, A. Iaccarino, G. Troncone, B.M. Veneziani, N. Montuori, S. Placido and R. Bianco, Urokinase-type plasminogen activator receptor (uPAR) expression enhances invasion and metastasis in RAS mutated tumors, Scientific Reports 7: ((2017) ), 9388. doi: 10.1038/s41598-017-10062-1. |
[36] | C.E. Almasi, I.J. Christensen, G. Høyer-Hansen, K. Danø, H. Pappot, H. Dienemann and T. Muley, Urokinase receptor forms in serum from non-small cell lung cancer patients: relation to prognosis, Lung Cancer 74: ((2011) ), 510–515. doi: 10.1016/j.lungcan.2011.05.008. |
[37] | B. Werle, M. Kotzsch, T.T. Lah, J. Kos, D. Gabrijelcic-Geiger, E. Spiess, J. Schirren, W. Ebert, W. Fiehn, T. Luther, V. Magdolen, M. Schmitt and N. Harbeck, Cathepsin B, plasminogenactivator-inhibitor (PAI-1) and plasminogenactivator-receptor (uPAR) are prognostic factors for patients with non-small cell lung cancer, Anticancer Research 24: ((2004) ), 4147–4161. |
[38] | C.H. Tang and Y. Wei, The urokinase receptor and integrins in cancer progression, Cellular & Molecular Life Sciences: CMLS 65: ((2008) ), 1916–1932. doi: 10.1007/s00018-008-7573-9. |
[39] | N. Montuori and P. Ragno, Multiple activities of a multifaceted receptor: roles of cleaved and soluble uPAR, Frontiers in Bioscience (Landmark Edition) 14: ((2009) ), 2494–2503. |
[40] | W.H. Chen, C. Wang, Y.H. Zhang, Y.H. Yang, H.Y Zhan and L.M. Zhang, Influence of overexpressed coagulant and fibrolytic components in tumor tissues on the prognosis of non-small cell lung cancer, Zhonghua Yi Xue Za Zhi 87: ((2007) ), 3228–3232. |
[41] | J.L. Fisher, P.S. Mackie, M.L. Howard, H. Zhou and P.F.M. Choong, The expression of the urokinase plasminogen activator system in metastatic murine osteosarcoma: an in vivo mouse model, Clinical Cancer Research: An Official Journal of the American Association for Cancer Research 7: ((2001) ), 1654–1660. |
[42] | V. Ellis, C. Pyke, J. Eriksen, H. Solberg and K. Danø, The urokinase receptor: involvement in cell surface proteolysis and cancer invasion, Annals of the New York Academy of Sciences 667: ((1992) ), 13–31. doi: 10.1111/j.1749-6632.1992.tb51591.x. |
[43] | R.P. Czekay and D.J. Loskutoff, Plasminogen activator inhibitors regulate cell adhesion through a uPAR-dependent mechanism, Journal of Cellular Physiology 220: ((2009) ), 655–663. doi: 10.1002/jcp.21806. |
[44] | D.M. Dupont, J.B. Madsen, T. Kristensen, J.S. Bodker, G.E. Blouse, T. Wind and P.A. Andreasen, Biochemical properties of plasminogen activator inhibitor-1, Frontiers in Bioscience (Landmark Edition) 14: ((2009) ), 1337–1361. doi: 10.2741/3312. |
[45] | A. Nykjaer, M. Conese, E.I. Christensen, D. Olson, O. Cremona, J. Gliemann and F. Blasi, Recycling of the urokinase receptor upon internalization of the uPA:serpin complexes, EMBO Journal 16: ((1997) ), 2610–2620. doi: 10.1093/emboj/16.10.2610. |
[46] | Y. Jing, K. Kovacs, V. Kurisetty, Z. Jiang, N. Tsinoremas and J.R. Merchan, Role of plasminogen activator inhibitor-1 in urokinase’s paradoxical in vivo tumor suppressing or promoting effects, Molecular Cancer Research: MCR 10: ((2012) ), 1271–1281. doi: 10.1158/1541-7786.MCR-12-0145. |
[47] | M.J. Duffy, P.M. McGowan, N. Harbeck, C. Thomssen and M. Schmitt, uPA and PAI-1 as biomarkers in breast cancer: validated for clinical use in level-of-evidence-1 studies, Breast Cancer Research: BCR 16: ((2014) ), 428. doi: 10.1186/s13058-014-0428-4. |
[48] | B. McMahon and H.C. Kwaan, The plasminogen activator system and cancer, Pathophysiology of Haemostasis & Thrombosis 36: ((2008) ), 184–194. doi: 10.1159/000175156. |
[49] | S. Devaraj, D.Y. Xu and I. Jialal, C-reactive protein increases plasminogen activator inhibitor-1 expression and activity in human aortic endothelial cells: Implications for the metabolic syndrome and atherothrombosis, Circulation 107: ((2003) ), 398–404. doi: 10.1161/01.cir.0000052617.91920.fd. |


