
A pilot study to troubleshoot quality control metrics when assessing circulating miRNA expression data reproducibility across study sites
Abstract
BACKGROUND:
Given the growing interest in using microRNAs (miRNAs) as biomarkers of early disease, establishment of robust protocols and platforms for miRNA quantification in biological fluids is critical.
OBJECTIVE:
The goal of this multi-center pilot study was to evaluate the reproducibility of NanoString nCounter™ technology when analyzing the abundance of miRNAs in plasma and cystic fluid from patients with pancreatic lesions.
METHODS:
Using sample triplicates analyzed across three study sites, we assessed potential sources of variability (RNA isolation, sample processing/ligation, hybridization, and lot-to-lot variability) that may contribute to suboptimal reproducibility of miRNA abundance when using nCounter™, and evaluated expression of positive and negative controls, housekeeping genes, spike-in genes, and miRNAs.
RESULTS:
Positive controls showed a high correlation across samples from each site (median correlation coefficient,
CONCLUSIONS:
Findings from this pilot investigation suggest the nCounter platform can yield reproducible results across study sites. This study underscores the importance of implementing quality control procedures when designing multi-center evaluations of miRNA abundance.
1.Introduction
Early detection and prevention strategies are desperately needed for pancreatic ductal adenocarcinoma (PDAC), a malignancy with a relative five-year survival rate of only 10% [1]. Molecular biomarkers from liquid biopsies, clinical parameters, and imaging tools hold promise for detecting preinvasive and early PDAC [2]. MicroRNAs (miRNAs) are excellent candidate molecular biomarkers of early cancer or preinvasive disease because of their tissue-specific expression patterns, remarkable protection from endogenous RNase activity, and their ability to regulate hundreds of tumor suppressors and oncogenes [3, 4, 5]. We and others have shown the potential clinical utility of miRNAs in the detection of PDAC and its cystic precursor lesions known as intraductal papillary mucinous neoplasms (IPMNs) [6, 7, 8, 9, 10, 11, 12]. Given the growing interest in the use of miRNAs as biomarkers for the detection of early-stage PDAC and high-grade IPMNs, the establishment of accurate, sensitive, specific, and reproducible platforms for circulating miRNA quantification is prudent, a goal in line with the National Cancer Institute’s Early Detection Research Network [2]. However, studies are lacking in this important area.
The nCounter™ system (NanoString Technologies, Seattle, WA, USA) is an automated high-throughput platform designed to evaluate gene expression in clinical samples in a single multiplexed reaction that relies on hybridization of transcripts or miRNAs to probes conjugated to fluorescent barcodes [13, 14]. In a single institutional study, our team [7] used nCounter™ technology to evaluate miRNA abundance in pre-operative plasma from patients with IPMNs as an alternative to microarray and polymerase chain reaction-based methods because of its potential to more accurately quantify low miRNA levels in blood without pre-amplification and its availability in research and certified clinical laboratories throughout the country. Using plasma and cystic fluid samples collected, processed, and banked using standard operating procedures (SOP) as part of a multi-center study [15], the objective of this pilot project was to troubleshoot potential methodological sources of variability that may contribute to suboptimal reproducibility of circulating miRNA abundance when using the nCounter™ system: RNA isolation, NanoString miRNA sample preparation/ligation, hybridization, and reporter probe lot variability.
2.Materials and methods
2.1Study population
The Florida Pancreas Collaborative is a multi-center prospective cohort study established by a multidisciplinary team of investigators from three Florida academic cancer centers (Moffitt Cancer Center (MC), The University of Florida (UF), and Sylvester Cancer Center/University of Miami (UM)), with the goal of advancing prevention and early detection efforts for PDAC [15]. Between 9/3/2015 and 8/18/2018, each study site recruited males and females 18 to 99 years old presenting to the GI clinic, surgery, or endoscopy at Moffitt, UF, or UM with a clinical suspicion for (or diagnosis of) a pancreatic lesion, cyst, mass, or pancreatitis based on symptoms, imaging, or blood-work. Confirmation of the clinical diagnosis was made using histology, cytology, lab markers, and/or imaging. Informed consent was obtained under institutional review board-approved protocols at each institution and documented in the electronic medical record. This study was undertaken with the understanding and written consent of each subject, and the study conforms with The Code of Ethics of the World Medical Association (Declaration of Helsinki). All participants were assigned a unique study identification (ID) number comprising the two-letter study site prefix followed by four numbers (ie. MC1234).
2.2Biospecimen collection and processing
Blood was collected from consented participants via phlebotomy in a 10-mL EDTA tube and processed for plasma within 2 hours using standard procedures as described previously [7]. The tube of plasma was inverted three times, spun at 3,600 rpm for 8 minutes, aliquoted into 0.5-mL bar-coded cryovials, and banked at
2.3Pilot design
This pilot study was designed to conduct the RNA isolation, processing/ligation, and hybridization steps in triplicate for a subset of 0.5 mL plasma or cyst fluid aliquots from our three study sites, with variation in the site performing certain steps (Table 1). Sample naming conventions were used and included the study ID followed by ‘BB’ for baseline blood/plasma, ‘CF’ for cystic fluid, and ‘R’ for replicate samples from each site, ending with a suffix of A (for MC), B for (UF), and C (for UM). We also evaluated high quality (QU) RNA reference samples using Ambion Universal Human Reference RNA derived from 10 human cell lines (ThermoFisher Scientific, Waltham MA) and pooled plasma donated by healthy controls (HC) recruited at the MC site. Since each NanoString nCounter cartridge allows 12 samples to be evaluated simultaneously, a total of 4 ‘BB’ trios, 4 ‘CF’ trios, 2 ‘QU’ trios, and 2 ‘HC’ trios were examined across the three study sites as shown in Table 1.
2.4RNA isolation from plasma and cyst fluid and quality control
One 0.5 mL cryovial of plasma (and cyst fluid) was retrieved and thawed on ice from pilot study participants. The possibility of hemolysis (rupturing of erythrocytes) was assessed and recorded prior to RNA extraction since hemolysis can be a source of variation in studies of circulating miRNAs. Hemolysis assessment was performed based on recommended guidelines [1, 16, 17]. First, samples were visually inspected for a pink/red hue. Then, the NanoDrop spectrophotometer (NanoDrop Technologies, Waltham, MA) was used to measure and record hemoglobin absorbance at
Total RNA isolation was performed on 500
2.5High-throughput measurement of miRNA abundance
The nCounter™ Human v3 miRNA Expression Assay CodeSet (NanoString Technologies, Seattle, WA, USA) was used to quantify the
abundance of 800 human miRNAs, 5 housekeeping genes (ACTB, B2M, GAPDH, RPL19, and RPLP0) and built-in controls: positive controls (spiked-in RNA at
various concentrations to assess overall assay performance,
Table 1
Pilot study design for miRNA quality control work
| Moffitt Cartridge 1 | UF Cartridge 1 | UM Cartridge 1 | ||||||||||||||
|---|---|---|---|---|---|---|---|---|---|---|---|---|---|---|---|---|
| Task to be performed and by whom: | Task to be performed and by whom: | Task to be performed and by whom: | ||||||||||||||
| Description | Diagnosis | Sample # | FPC_ID | RNA isolation | Sample preparation | Hybridization | Sample # | FPC_ID | RNA isolation | Sample preparation | Hybridization | Sample # | FPC_ID | RNA isolation | Sample preparation | Hybridization |
| Baseline plasma replicate sample from Moffitt participant MC0008 | IPMN | |||||||||||||||
|
| 1 | MC0008_BB_R1A | MC | MC | MC | 1 | MC0008_BB_R1B | MC | MC | UF | 1 | MC0008_BB_R1C | MC | MC | UM | |
| High quality replicate RNA sample 1 | N/A | |||||||||||||||
|
| 2 | QU001_R1A | n/a | MC | MC | 2 | QU001_R1B | n/a | MC | UF | 2 | QU001_R1C | n/a | MC | UM | |
| Healthy control plasma replicate sample 1 | Control | |||||||||||||||
|
| 3 | HC001_BB_R1A | MC | MC | MC | 3 | HC001_BB_R1B | MC | UF | UF | 3 | HC001_BB_R1C | MC | UM | UM | |
|
Table 1, continued | ||||||||||||||||
| Moffitt Cartridge 1 | UF Cartridge 1 | UM Cartridge 1 | ||||||||||||||
| Task to be performed and by whom: | Task to be performed and by whom: | Task to be performed and by whom: | ||||||||||||||
| Description | Diagnosis | Sample # | FPC_ID | RNA isolation | Sample preparation | Hybridization | Sample # | FPC_ID | RNA isolation | Sample preparation | Hybridization | Sample # | FPC_ID | RNA isolation | Sample preparation | Hybridization |
| Cyst fluid replicate sample from UF participant UF011 | Pseudocyst | |||||||||||||||
|
| 4 | UF011_CF_R1A | UF | UF | MC | 4 | UF011_CF_R1B | UF | UF | UF | 4 | UF011_CF_R1C | UF | UF | UM | |
| Baseline plasma replicate sample from Moffitt participant MC0033 | IPMN | |||||||||||||||
|
| 5 | MC0033_BB_R1A | MC | MC | MC | 5 | MC0033_BB_R1B | MC | MC | UF | 5 | MC0033_BB_R1C | MC | MC | UM | |
| Cyst fluid replicate sample from UF participant UF012 | Pseudocyst | |||||||||||||||
|
| 6 | UF012_CF_R1A | UF | UF | MC | 6 | UF012_CF_R1B | UF | UF | UF | 6 | UF012_CF_R1C | UF | UF | UM | |
|
Table 1, continued | ||||||||||||||||
| Moffitt Cartridge 1 | UF Cartridge 1 | UM Cartridge 1 | ||||||||||||||
| Task to be performed and by whom: | Task to be performed and by whom: | Task to be performed and by whom: | ||||||||||||||
| Description | Diagnosis | Sample # | FPC_ID | RNA isolation | Sample preparation | Hybridization | Sample # | FPC_ID | RNA isolation | Sample preparation | Hybridization | Sample # | FPC_ID | RNA isolation | Sample preparation | Hybridization |
| Cyst fluid replicate sample from UM participant UM054 | Pseudocyst | |||||||||||||||
|
| 7 | UM054_CF_R1A | UM | UM | MC | 7 | UM054_CF_R1B | UM | UM | UF | 7 | UM054_CF_R1C | UM | UM | UM | |
| Baseline plasma replicate sample from UM participant UM064 | Pseudocyst | |||||||||||||||
|
| 8 | UM064_BB_R1A | UM | UM | MC | 8 | UM064_BB_R1B | UM | UM | UF | 8 | UM064_BB_R1C | UM | UM | UM | |
| High quality replicate RNA sample 2 | N/A | |||||||||||||||
|
| 9 | QU002_R1A | n/a | MC | MC | 9 | QU002_R1B | n/a | UF | UF | 9 | QU002_R1C | n/a | UM | UM | |
|
Table 1, continued | ||||||||||||||||
| Moffitt Cartridge 1 | UF Cartridge 1 | UM Cartridge 1 | ||||||||||||||
| Task to be performed and by whom: | Task to be performed and by whom: | Task to be performed and by whom: | ||||||||||||||
| Description | Diagnosis | Sample # | FPC_ID | RNA isolation | Sample preparation | Hybridization | Sample # | FPC_ID | RNA isolation | Sample preparation | Hybridization | Sample # | FPC_ID | RNA isolation | Sample preparation | Hybridization |
| Healthy control plasma replicate sample 2 | Control | |||||||||||||||
|
| 10 | HC002_BB_R1A | MC | MC | MC | 10 | HC002_BB_R1B | UF | UF | UF | 10 | HC002_BB_R1C | UM | UM | UM | |
| Baseline plasma replicate sample from UM participant UM024 | IPMN | |||||||||||||||
|
| 11 | UM024_BB_R1A | UM | UM | MC | 11 | UM024_BB_R1B | UM | UM | UF | 11 | UM024_BB_R1C | UM | UM | UM | |
| Cyst fluid replicate sample from UF participant UF013 | Pseudocyst | |||||||||||||||
|
| 12 | UF013_CF_R1A | UF | UF | MC | 12 | UF013_CF_R1B | UF | UF | UF | 12 | UF013_CF_R1C | UF | UF | UM | |
The samples were then stored at
2.6Data processing and quality control
Raw counts of each target were log2-transformed. For each sample, background-corrected measures of miRNA expression were calculated by subtracting the negative control mean plus two standard deviations (SD) from the raw miRNA counts. Human messenger RNA (mRNA) housekeeping genes included in the CodeSet (ACTB, B2M, GAPDH, RPL19 and RPLP0) were used to evaluate possible cellular sample contamination, as these genes should be very low or non-detectable in cell-free samples. Data for each sample were normalized using the geometric mean of 3 spike-in oligos. Since it is important to consider assay performance when using different lots of reagents, lot-to-lot variability was accounted for by generating a calibration/scaling factor based on a set of common biological samples that expressed the majority of targets of interest above background using manufacturer-suggested procedures available in NanoString data analysis guidelines.
2.7Data analysis
Statistical methods used in this investigation included (a) the Kruskal-Wallis test for group differences among study sites and specimen types, (b) principal component analysis (PCA) for data reduction of endogenous miRNA expression, and (c) correlation analysis with Spearman correlation for housekeeping and spike-in genes and Pearson correlation for endogenous genes to evaluate the correlation of miRNA expression between sites. Graphical visualization included (a) boxplots for distribution of gene and miRNA expression and correlation coefficients among study sites and specimen types, (b) heatmap for patterns of gene and miRNA expression and correlation coefficients, (c) scatterplots for correlation of gene and miRNA expression and PCA analysis, and (d) barplot for PCA analysis. All statistical analyses were performed using the R 3.6.0 software (https://www.R-project.org).
Figure 1.
Heatmap for the 55 miRNA targets and the 3 ligation controls that had expression above zero across
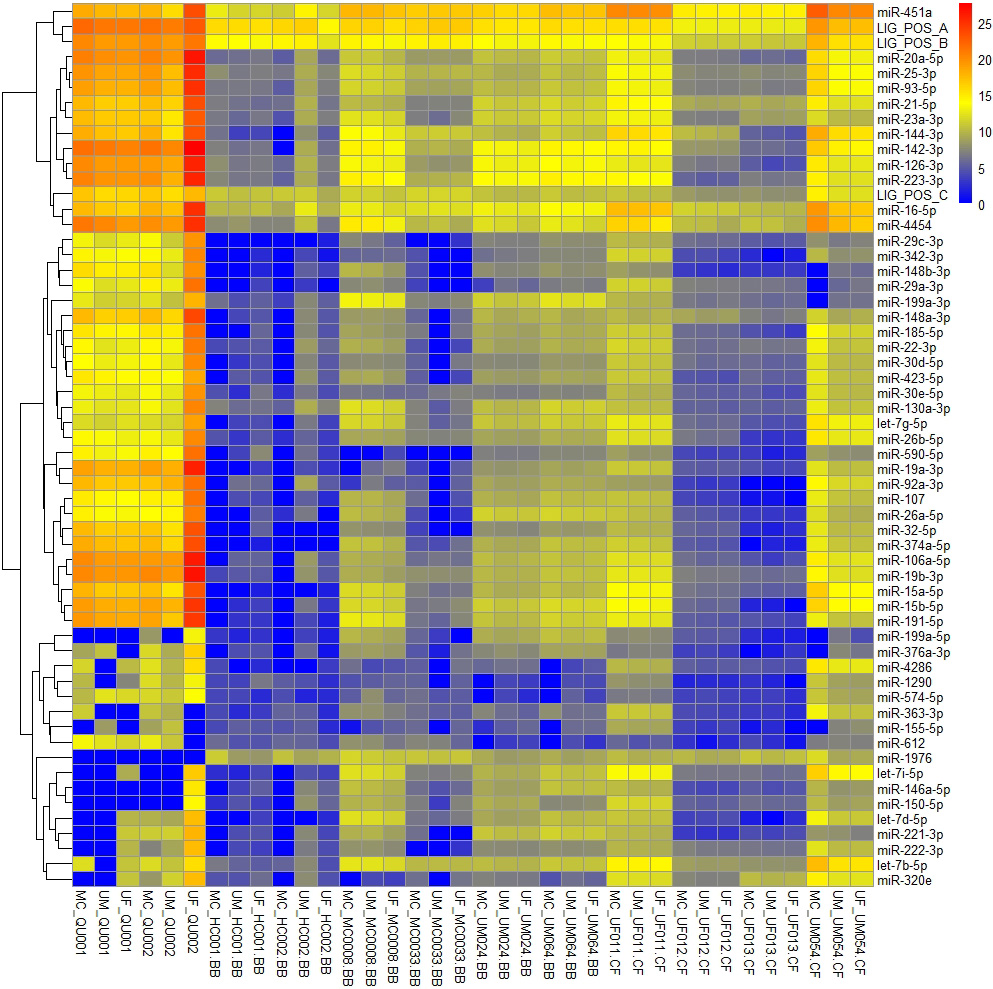
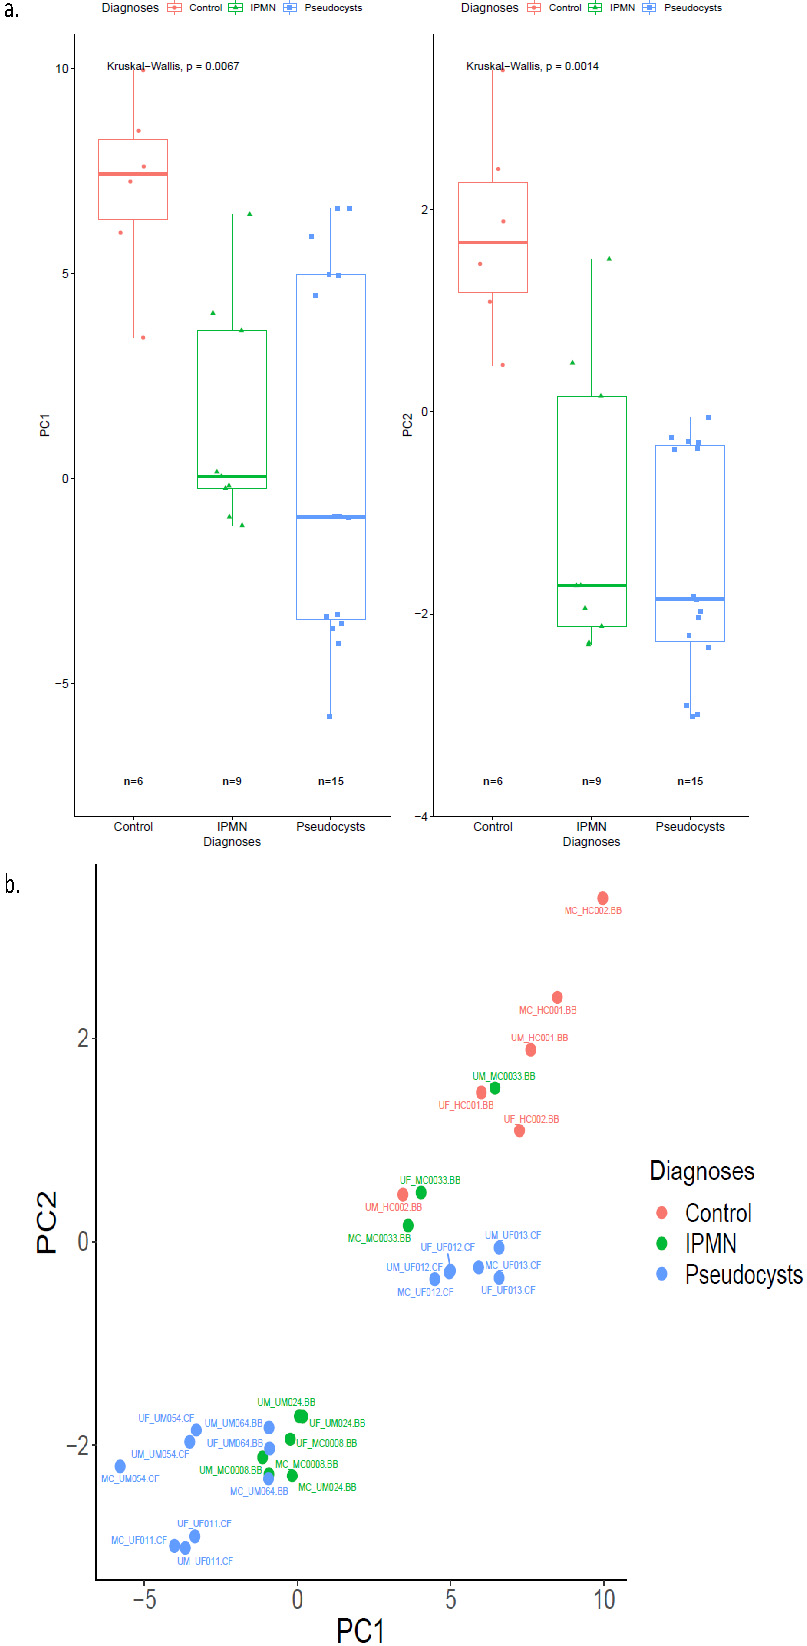
Figure 2.
Endogenous expression of 55 miRNAs and 3 ligation controls in study samples characterized by principal components for each diagnosis type represented by a) box plots and b) scatterplots.
3.Results
Of the 12 pre-treatment samples evaluated across the study sites, 8 were from participants with the following pancreatic conditions: IPMNs (
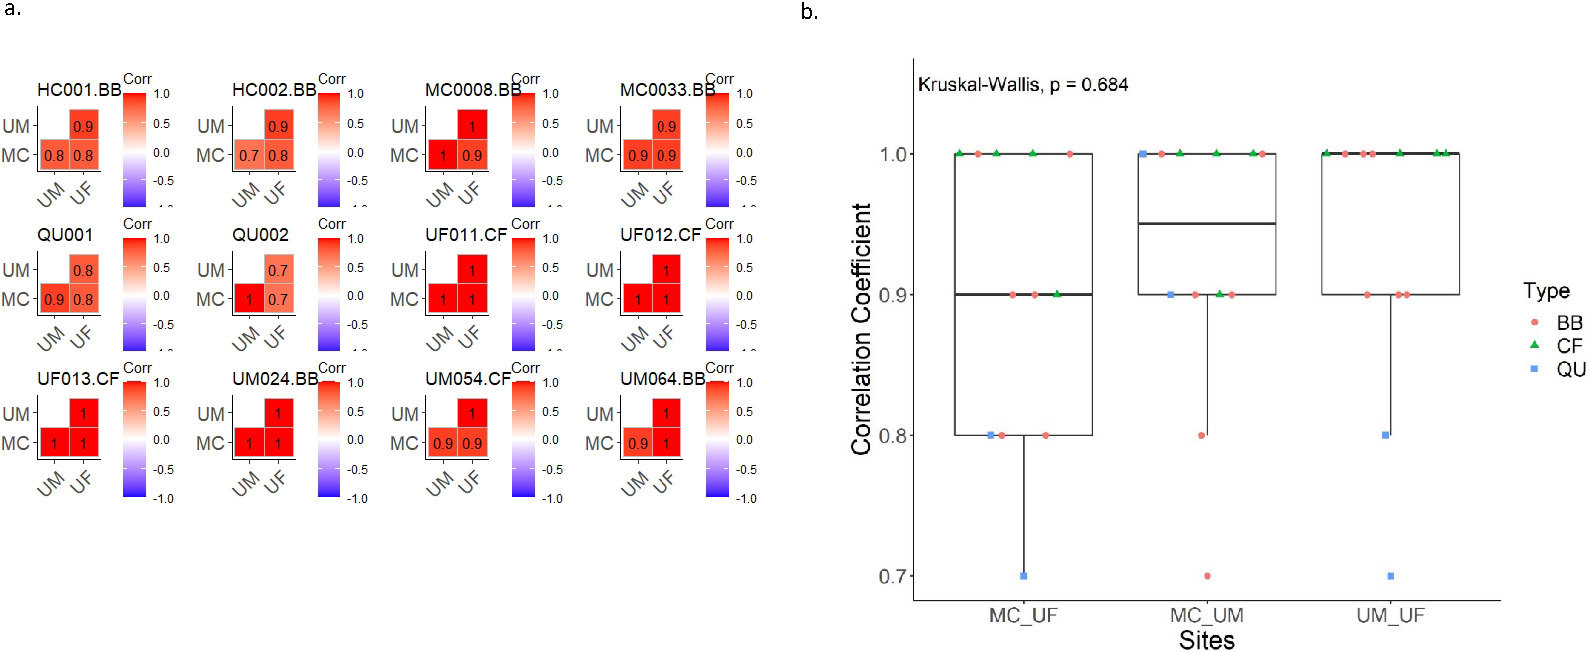
Figure 3.
Pearson correlations of the 55 miRNA targets expressed in study samples across sites. a) Correlation coefficient matrix bar plot for each sample, b) Correlation coefficient boxplot.
The five housekeeping genes showed a similar distribution of expression among the three study sites (
Of five spike-in miRNA probes that can be detected by the nCounter panel, we used three for normalization at the manufacturer’s suggestion: osa-miR-414, cel-mi-248, and ath-miR-159a. The spike-in miRNA probes had a comparable distribution of expression among the three study sites (
For the
4.Discussion
Liquid biopsies based on miRNA profiles have potential to aid in early detection efforts for pancreatic cancer. However, it is necessary to account for methodological sources of variability that may confound results and contribute to suboptimal reproducibility of miRNA expression in human samples as part of multi-center studies. On a subset of plasma and cyst fluid samples, this multi-center pilot study applied standardized methodology for RNA isolation, processing, and hybridization using nCounter technology (NanoString Technologies, Inc) across study sites. Overall, we report strong correlations in quality control metrics such as positive and negative control probes, housekeeping genes, and spike-in probes. Additionally, endogenous miRNAs above background were well correlated across trios of samples evaluated across study sites.
Despite promising data, we observed some variations in quality control metrics across the three sites that might be explained by inconsistencies in sample preparation, equipment, or normal site-to-site variability. To explore these concerns in more detail, a field application scientist from NanoString (EAP) evaluated the raw data and staff from the Moffitt Molecular Genomics Core (SJY, TM) re-visited the spike-in dilution calculations and sent follow-up questions to each site to elucidate reasons for the differences. Reasons for the variance in the spike-ins and positive controls included having different technicians perform the ligation step and site to site differences in thermocycler brand and calibration. Additionally, the spike-in dilutions were about 40% lower than when the assay was performed in a single-institution study years prior [7], explaining not only the lower dilution counts but also the variation in the final volume after concentrating samples. It was later learned that the high-quality control RNA was not diluted at UF prior to subsequent steps. This pilot study highlights the need for careful attention to following a standardized protocol.
Despite these nuances, our proof of concept results suggest that miRNA quantitation can be reliably reproduced across study sites with the nCounter platform, opening the door for robust miRNA-based signature development in cell-free samples such as plasma and ascites fluid. Next steps include incorporating the lessons learned and continuing to evaluate miRNA expression profiles from plasma and cyst fluid samples from newly-diagnosed cases with IPMNs and other types of pancreatic lesions across study sites. Such work holds great promise for advancing early detection efforts for pancreatic cancer.
Author contributions
Conception: JBP, SJY, TM, SLW, D-TC, JL
Interpretation or analysis of data: JBP, SJY, TM, SLW, EP, D-TC, JL
EP preparation of the manuscript: JBP, SJY, TM, SLW, EP, D-TC, JL
EP revision for important intellectual content: JBP, TM, SLW, YC, DZ, EP, JL, MEC, KNA, DJ, JGT, NM, MM, D-TC, SJY
Supervision: JBP, SLW, SJY
Supplementary data
The supplementary files are available to download from http://dx.doi.org/10.3233/CBM-210255.
Acknowledgments
This investigation was supported in part by funding awarded to J. Permuth, M. Malafa, J. Trevino, and N. Merchant by the Florida Academic Cancer Center Alliance (FACCA) and funding awarded to J. Permuth and D. Jeong by the National Cancer Institute of the National Institutes of Health (Grant #: R37CA229810). This work was also supported by the Tissue Core, Molecular Genomics Core, and the Biostatistics and Bioinformatics Shared Resource, at the H. Lee Moffitt Cancer Center & Research Institute, an NCI designated Comprehensive Cancer Center (P30-CA076292). This work was also supported by the Onco-Genomics Shared Resource a component of the Sylvester Cancer Center Support Grant (P30 CA240139). The content is solely the responsibility of the authors and does not necessarily represent the official views of the sponsors or the participating institutions.
References
[1] | American Cancer Society. Cancer Facts and Figures 2021. Atlanta: American Cancer Society, 2021. |
[2] | Y. Liu, S. Kaur, Y. Huang, J.F. Fahrmann, J.A. Rinaudo, S.M. Hanash et al., Biomarkers and Strategy to Detect Preinvasive and Early Pancreatic Cancer: State of the Field and the Impact of the EDRN, Cancer Epidemiology, Biomarkers & Prevention: a Publication of the American Association for Cancer Research, Cosponsored by the American Society of Preventive Oncology 29: ((2020) ), 2513–2523. |
[3] | Y. Xi, G. Nakajima, E. Gavin, C.G. Morris, K. Kudo, K. Hayashi et al., Systematic analysis of microRNA expression of RNA extracted from fresh frozen and formalin-fixed paraffin-embedded samples, Rna 13: ((2007) ), 1668–1674. |
[4] | P.P. Medina and F.J. Slack, microRNAs and cancer: an overview, Cell Cycle 7: ((2008) ), 2485–2492. |
[5] | P.S. Mitchell, R.K. Parkin, E.M. Kroh, B.R. Fritz, S.K. Wyman, E.L. Pogosova-Agadjanyan et al., Circulating microRNAs as stable blood-based markers for cancer detection, Proc Natl Acad Sci USA 105: ((2008) ), 10513–10518. |
[6] | J. Permuth-Wey, Y.A. Chen, K. Fisher, S. McCarthy, X. Qu, M.C. Lloyd et al., A genome-wide investigation of microrna expression identifies biologically-meaningful micrornas that distinguish between high-risk and low-risk intraductal papillary mucinous neoplasms of the pancreas, PloS One 10: ((2015) ), e0116869. |
[7] | J. Permuth-Wey, D.T. Chen, W.J. Fulp, S.J. Yoder, Y. Zhang, C. Georgeades et al., Plasma MicroRNAs as novel biomarkers for patients with intraductal papillary mucinous neoplasms of the pancreas, Cancer Prevention Research (Philadelphia, Pa) ((2015) ). |
[8] | H. Matthaei, D. Wylie, M.B. Lloyd, M. Dal Molin, J. Kemppainen, S.C. Mayo et al., miRNA biomarkers in cyst fluid augment the diagnosis and management of pancreatic cysts, Clin Cancer Res 18: ((2012) ), 4713–4724. |
[9] | N. Lubezky, S. Loewenstein, M. Ben-Haim, E. Brazowski, S. Marmor, M. Pasmanik-Chor et al., MicroRNA expression signatures in intraductal papillary mucinous neoplasm of the pancreas, Surgery 153: ((2013) ), 663–672. |
[10] | A. Li, J. Yu, H. Kim, C.L. Wolfgang, M.I. Canto, R.H. Hruban et al., MicroRNA Array Analysis Finds Elevated Serum miR-1290 Accurately Distinguishes Patients with Low-Stage Pancreatic Cancer from Healthy and Disease Controls, Clin Cancer Res ((2013) ). |
[11] | G.A. Ganepola, J.R. Rutledge, P. Suman, A. Yiengpruksawan and D.H. Chang, Novel blood-based microRNA biomarker panel for early diagnosis of pancreatic cancer, World Journal of Gastrointestinal Oncology 6: ((2014) ), 22–33. |
[12] | N.A. Schultz, C. Dehlendorff, B.V. Jensen, J.K. Bjerregaard, K.R. Nielsen, S.E. Bojesen et al., MicroRNA biomarkers in whole blood for detection of pancreatic cancer, JAMA: The Journal of the American Medical Association 311: ((2014) ), 392–404. |
[13] | G.K. Geiss, R.E. Bumgarner, B. Birditt, T. Dahl, N. Dowidar, D.L. Dunaway et al., Direct multiplexed measurement of gene expression with color-coded probe pairs, Nature Biotechnology 26: ((2008) ), 317–325. |
[14] | M.H. Veldman-Jones, R. Brant, C. Rooney, C. Geh, H. Emery, C.G. Harbron et al., Evaluating robustness and sensitivity of the nanostring technologies nCounter platform to enable multiplexed gene expressionanalysis of clinical samples, Cancer Research 75: ((2015) ), 2587–2593. |
[15] | J.B. Permuth, J. Trevino, N. Merchant and M. Malafa, Partnering to advance early detection and prevention efforts for pancreatic cancer: The Florida Pancreas Collaborative, Future oncology (London, England) 12: ((2016) ), 997–1000. |
[16] | T. Blondal, S. Jensby Nielsen, A. Baker, D. Andreasen, P. Mouritzen, M. Wrang Teilum et al., Assessing sample and miRNA profile quality in serum and plasma or other biofluids, Methods 59: ((2013) ), S1–6. |
[17] | C.C. Pritchard, E. Kroh, B. Wood, J.D. Arroyo, K.J. Dougherty, M.M. Miyaji et al., Blood cell origin of circulating microRNAs: a cautionary note for cancer biomarker studies, Cancer Prevention Research (Philadelphia, Pa) 5: ((2012) ), 492–497. |


