
Lok-Test and Capo-Test pullout for in-situ concrete strength
Abstract
Among the test systems for in-place concrete strength available today, two measure the in-place physical strength, pullout, and cores. Both systems are dealt with in detail in this paper, the pullout systems named LOK-TEST/CAPO-TEST (ASTM C900-19) and coring (ASTM C42/42M-18). Testing in-situ with accurate test systems will reveal effects on the final strength from a potential mix’s over transportation, pumping, consolidation, compaction, and curing.
With the LOK-TEST system testing of the pre-installed inserts takes 4–5 minutes each, easily and with only one small suitcase brought along. The CAPO-TEST, originally designed to supplement the LOK-TEST, takes 15–20 minutes for each test to be performed anywhere on a structure without pre-installed inserts. No large holes are left in the structure from coring and thinner elements may be tested without weakening them structurally.
The pullout test provides accurately the In-Place Strength without testing cores and the duration is about 15 minutes compared to 3–4 days for coring correctly cured. General robust correlations to strength of standard specimens exist no matter what parameter is considered for normal concrete, even for carbonation of the surface layer.
With the systems the cover layer protecting the reinforcement may be checked efficiently and quickly, not at least in areas with dense reinforcement or on slim structures. Bad curing conditions are revealed and the consequences in terms of reduced service life for presence of chlorides or carbonation may be estimated swiftly.
This paper is benchmarking 50 years of successful in-situ concrete strength measurements, from studies of the failure mechanism and laboratory/on-site correlations to full scale testing of structures in Europe, Scandinavia, and Canada. Six testing cases with emphasis on pullout and cores are illustrating different applications:
Case 1. Production testing at the Great Belt Link, Denmark.
Case 2. Service life of bridge pier, Great Belt Link, Denmark.
Case 3. Curing of the cover layer evaluated by pullout and conductivity, Denmark.
Case 4. Strength testing with CAPO-TEST for further loading of old bridges, Poland.
Case 5. In-Situ compressive strength testing of quarantined precast concrete tunnel lining segments using CAPO-TEST, UK.
Case 6. Safe and early loading with LOK-TEST, Canada.
Other cases are given on www.NDTitans.com
1Introduction
Proper strength testing in-situ is important for purposes such as QC and QA of in-situ concrete not only relying on the potential lab strength, revealing effects in-situ of changed mixes, transportation, pumping, casting, consolidation, and curing.
Furthermore, it is important for documentation of unknown strength, upgrading of structures, additional loading, durability, and documentation of doubtful structures in cases where questions are raised in relation to compliance with code specifications, and finally and not at least, for timing of safe and early loading of maturing members.
Among the test systems for evaluating in-situ strength –detailed in ACI 228,1R-19 “Report on Methods for Estimating In-Place Concrete Strength” [1] –is pullout testing with LOK-TEST/CAPO-TEST (ASTM C-900-19) [47] measuring directly the physical compressive strength at a depth of 25 mm wherever required, usually of the cover layer, or if needed, deeper in the structure and cores (ASTM C42/C42M-18) [51] also measuring the physical strength, but not of the cover layer essential for durability in relation to ingress of harmful substances such as chlorides, CO2 oxygen and moist causing corrosion of the reinforcement.
Concerning the rebound hammer and pulse-velocity, the ACI 228.1R-19 report [1] states:
“Use of the rebound hammer in accordance with ASTM C805/C805M or the pulse-velocity in accordance with ASTM C597 may be specified by Architect/Engineer to evaluate uniformity of in-place concrete to select areas to be cored. These methods shall not be used to evaluate in-place strength”.
The LOK-TEST and the CAPO-TEST are presented in detail in this paper with their theoretical analysis background, a fracture analysis and correlations from 30 major studies worldwide, showing robust general correlations with regression coefficients R > 0.96 between pullout force and cylinder or cube/core strength or actual in-situ strength, no matter what concrete parameter is considered. This is in contrast to the rebound hammer and the pulse-velocity (with R ∼0.50 to 0–53), mix specific, standard cylinders (R = 0.84) and even cores (R = 0.92), [3], in “Publications” under Section 14 Useful Links.
The correlations obtained are stated together with the COV of the systems in the lab and on-site on a wide range of mixes and structures comprising more than 12,000 tests.
These general robust correlations of the LOK-TEST and CAPO-TEST are the backbone and the essence of the two systems, offering a viable alternative to cores, giving results directly on-site, quickly, not needing any laboratory compression machine, more reliable, less complicated, more economical, and causing less damage to the structure, if any at all –as with the LOK-TEST loaded exactly to failure or only to a required strength by which the test is a truly NDT method.
A special feature of the pullout systems is testing of the cover layer for durability, the “Peel” of new structure protecting the reinforcement. Proper concrete quality, compaction, and curing of this “Peel” is essential on new structures in terms of durability and service life, especially if chlorides are present from de-icing salts, from the sea water or airborne chlorides close to the ocean. Pullouts in combination with conductivity are presented for service life estimation.
In addition, the two pullout systems can advantageously be used on slender structures where cores may weaken the elements, and on structures with dense reinforcement, without cutting the rebars.
The testing depth of the pullouts is 25 mm. If needed, deeper embedment can be made, for the LOK-TEST as instructed in the Canadian Standard [48], and for the CAPO-TEST by surface planning to a required depth before starting out the test.
For strength testing of shotcrete, CAPO-TEST offers a quick, direct viable solution avoiding cores from shotcreting in separate boxes to be cored after production.
2The pullout systems
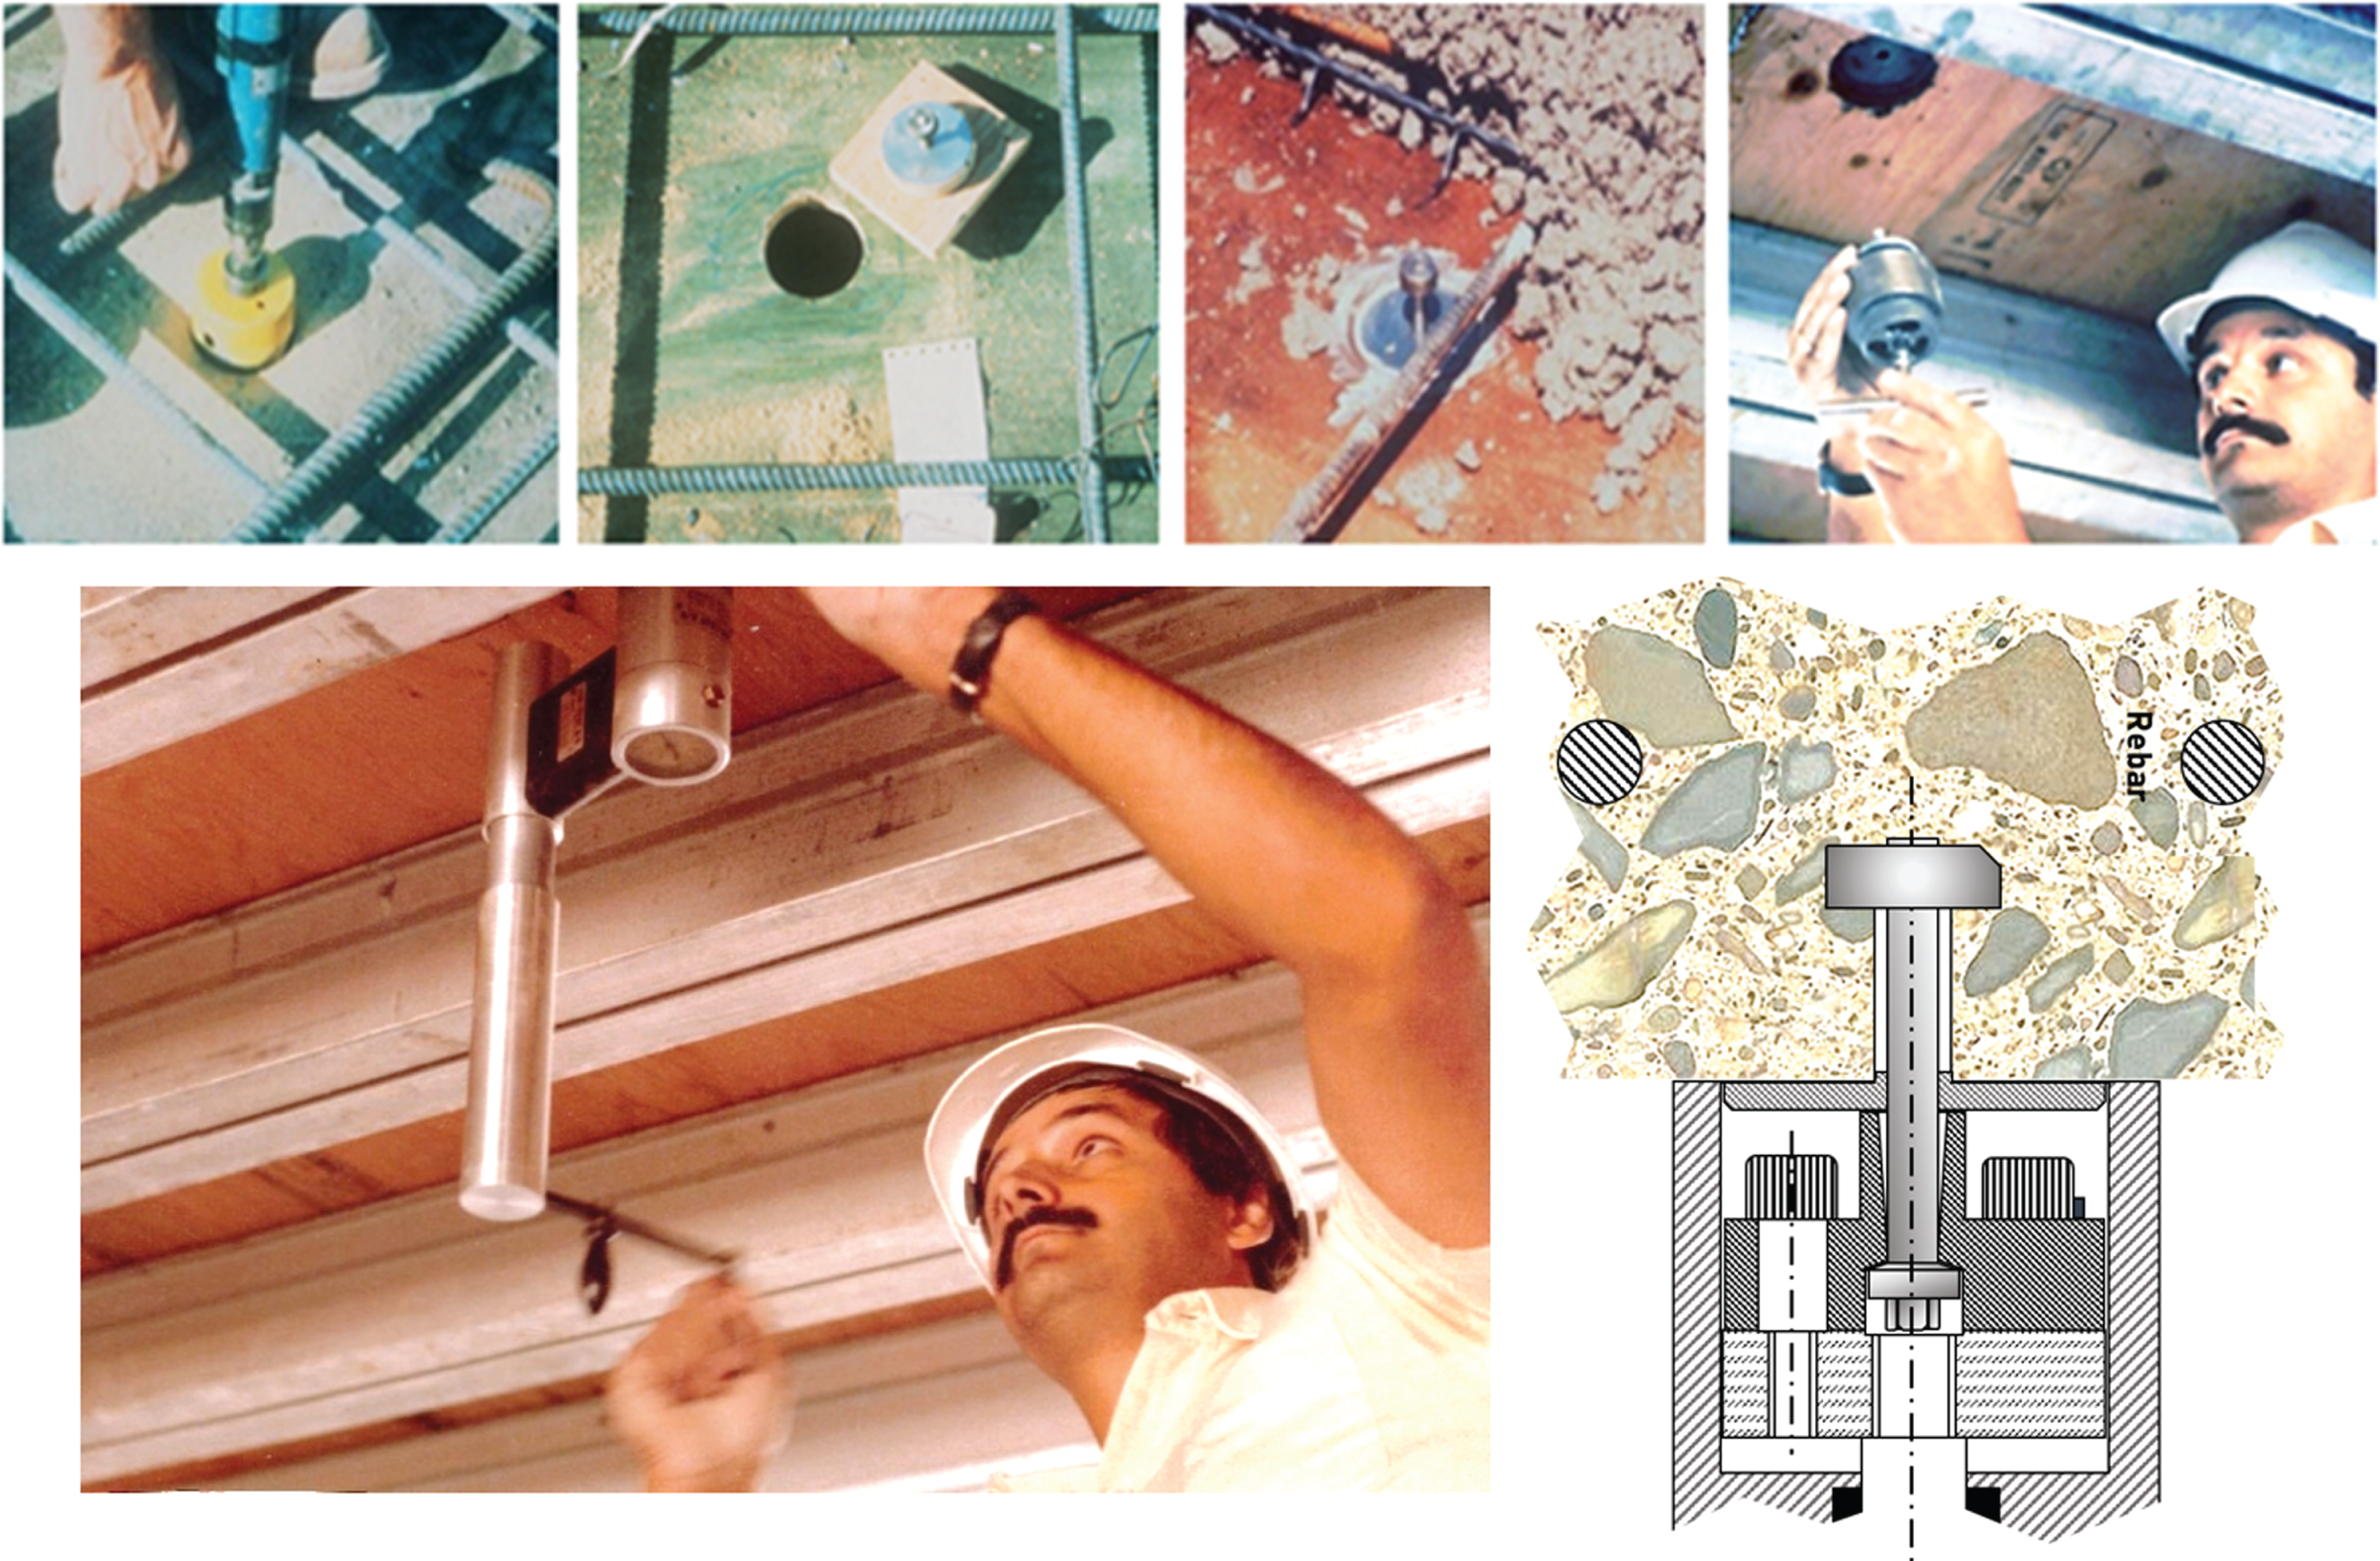
Invented at the Danish Technical University (DTU) in the late 1960’s and 1970’s [2–7], the LOK-TEST (“LOK” is the Danish name for “Punch”) use a disc cast into the fresh concrete, and the CAPO-TEST (Cut And Pull Out-Test) a ring expanded in an undercut recess in existing concrete.
Axial loading is made through a centric placed counterpressure, dimensions as shown in Figs. 1 and 2, producing compression forces between the embedded disc or ring and the counterpressure, hence the pullout force is a direct measure of the compressive strength.
Fig. 1
LOK-TEST.
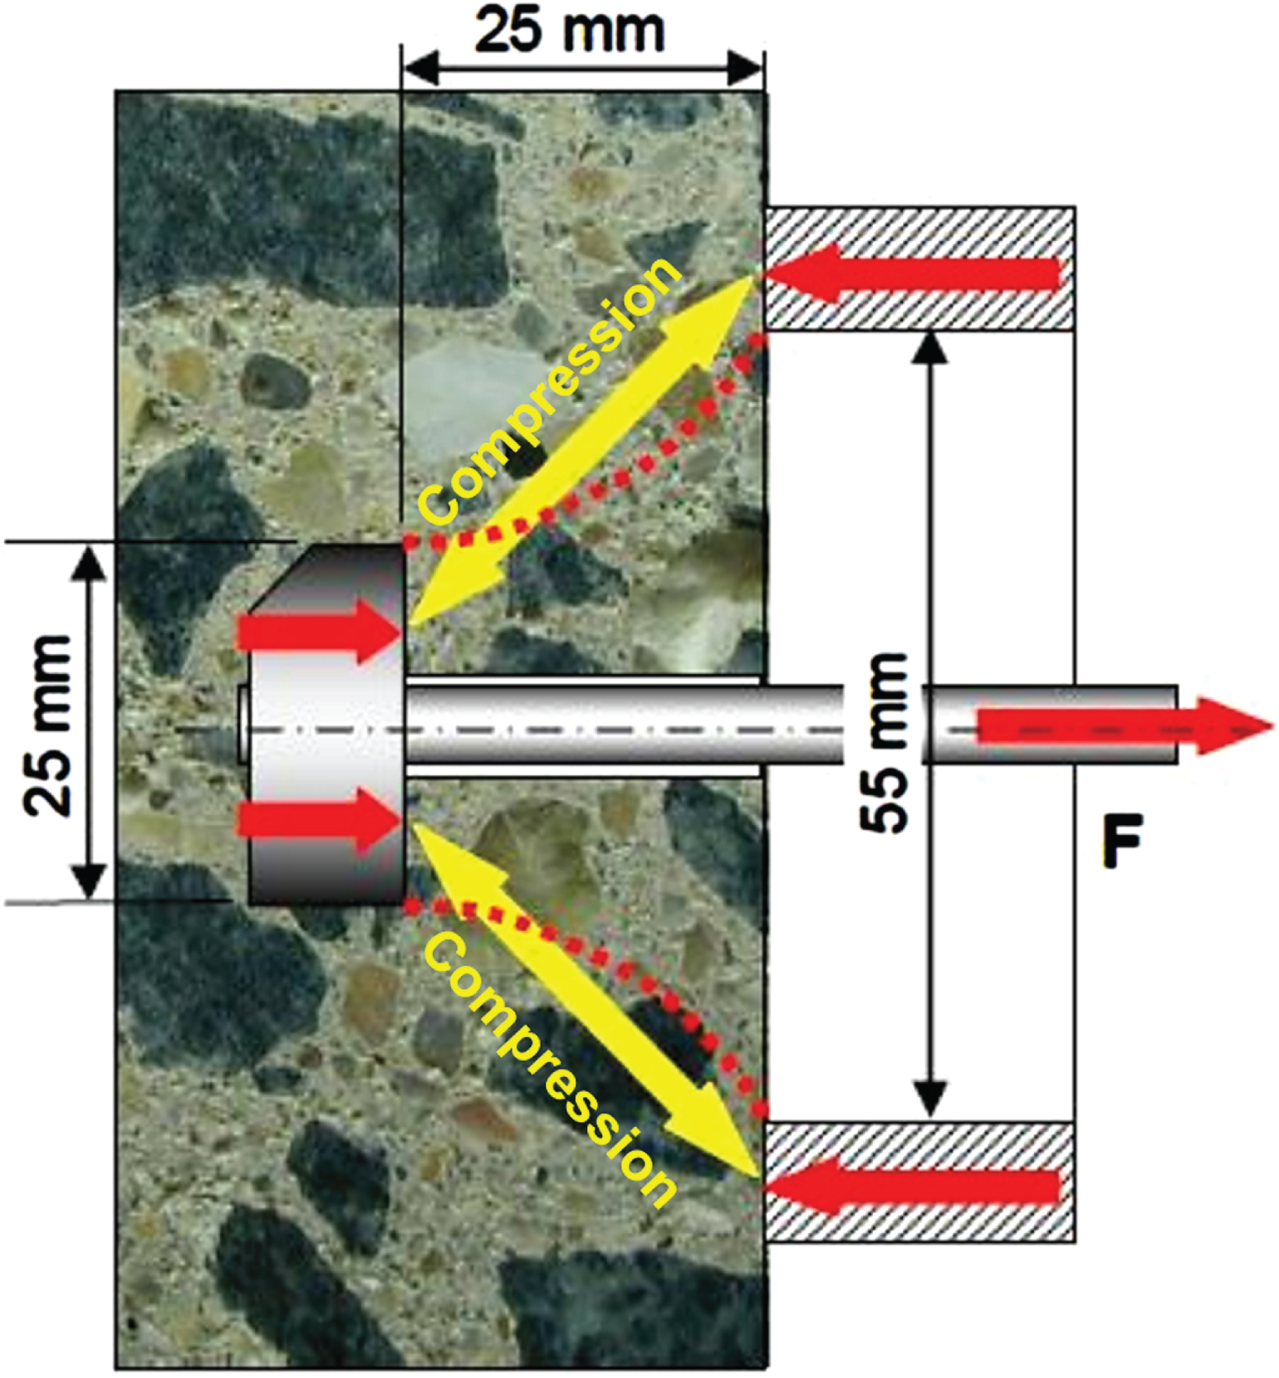
Fig. 2
CAPO-TEST.
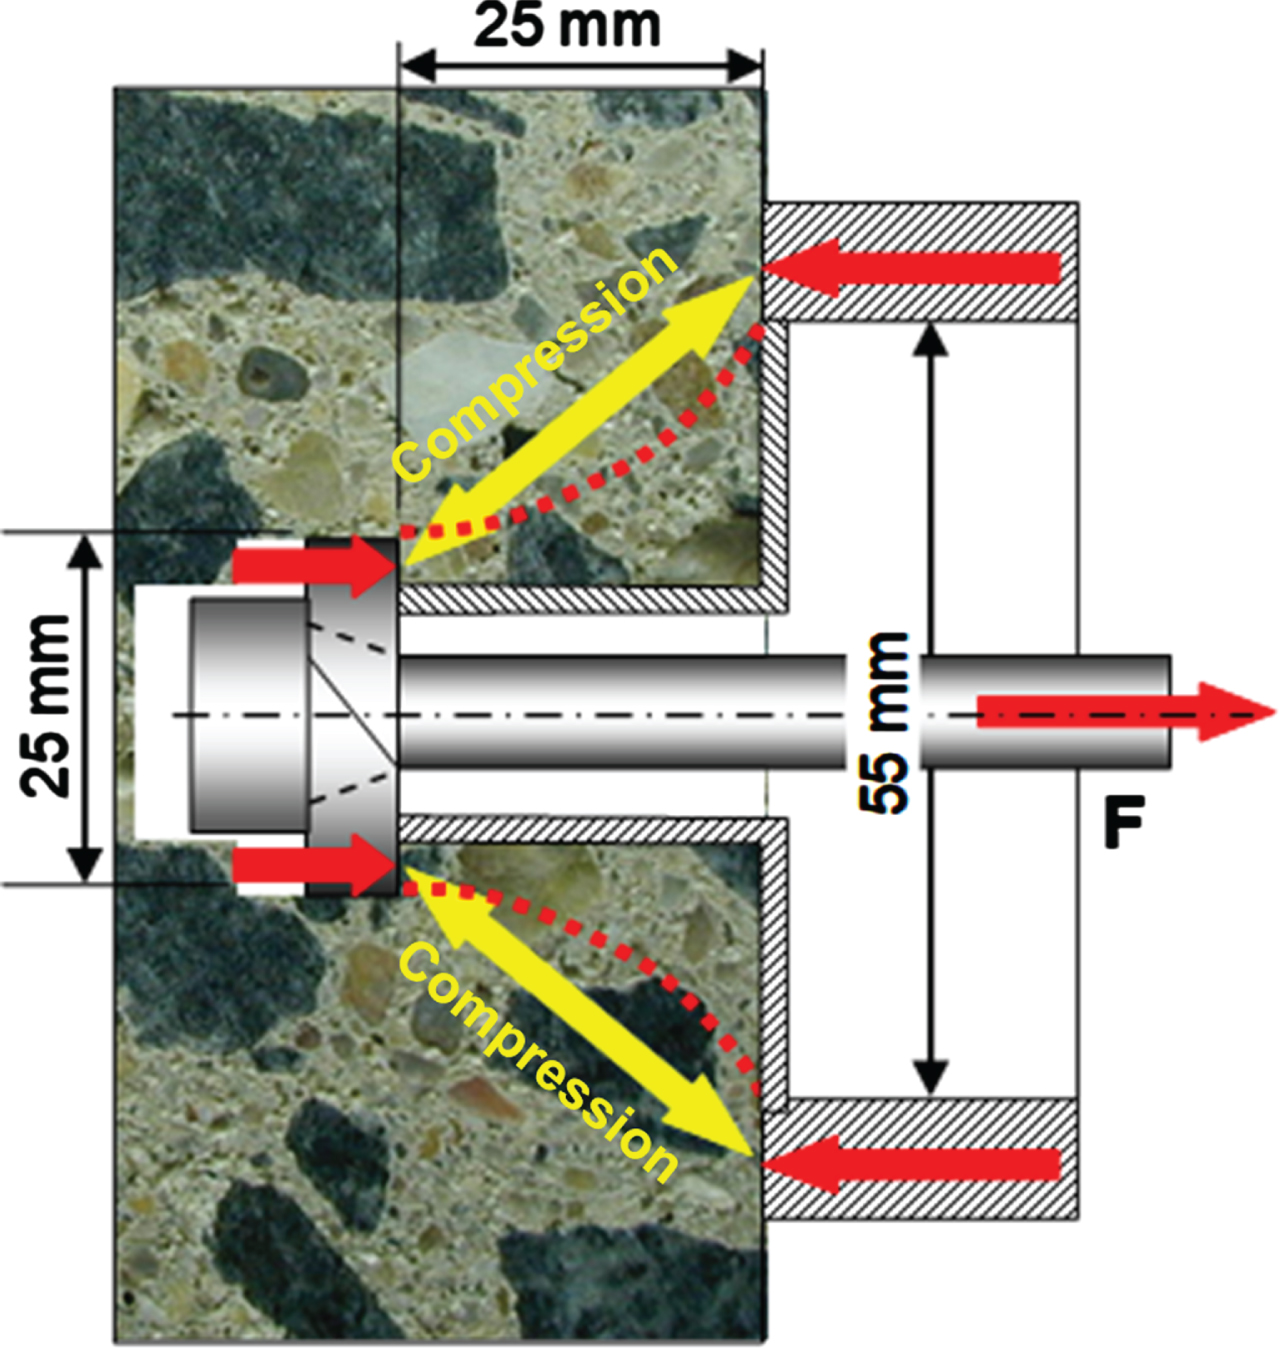
Detailed component description in the link “Hardware, Testing Procedures and Instruments” in Section 14.
LOK-TEST inserts are cast into the fresh concrete. Testing takes place to a required load, if no failure occur the test is truly Non-Destructive, loaded exactly to failure there is no visible damage to the surface, if pulled out, the cone hole may need patching as the CAPO-TEST’s by which the tests are semi-destructive.
3Theoretical analysis
Two major theoretical analyses were produced, one by plasticity theory, and one by a finite elements analysis.
A plasticity analysis of the failure in [8] Jensen, B.C. & Bræstrup, M.W.: “LOK-Test Determine the Compressive Strength of Concrete”, Nordisk Betong, 3-1976, concluding “Plasticity analysis show that when the angle between the direction of deformation and the failure surface is equal to the angle of friction for the concrete, then the pull-out force is proportional to the concrete compressive strength.”
A comprehensive finite element analysis 1981 [9] Ottosen, N.S.: “Nonlinear Finite Element Analysis of Pull-Out Test”, Journal of the Structural Division, ASCE, Vol. 107, No ST4, April 1981, concluding: “It has been shown that large compressive forces run from the disc in a rather narrow band towards the support, and this constitutes the load-carrying mechanism. Moreover, the failure in a LOK-TEST is caused by crushing of the concrete and not by cracking. Therefore, the force required to extract the embedded steel disc is directly dependent on the compressive strength of the concrete”.
The results of the two theoretical studies are summarized in Fig. 3, the relationship obtained by Jensen and Bræstrup and examples of two calculations made by Ottosen's finite element program for given LOK-Strength in kN transformed to uniaxial cylinder strength.
![The theoretical found relations between pullout force in kN and uniaxial compressive strength in MPa measured on standard cylinders by plasticity theory [8] and by the finite element analysis [9].](https://ip.ios.semcs.net:443/media/brs/2024/20-1-2/brs-20-1-2-brs240220/brs-20-brs240220-g003.jpg)
4Fracture analysis
To visualize Ottosen’s crack development found in his finite element analysis, Professor Herbert Krenchel (DTU, Denmark) conducted in 1985 a comprehensive physical trial program [10, 11] loading pullout in specimens to nine levels on the load-displacement curve, slicing the specimens, polishing the surfaces and impregnating them with fluorescence-dye for documentation of the cracking. At about 30% of the peak load, a circumferential tensile crack develops at an open angle running out from the outer edge of the disc. This is where the linearity is lost. From thereon, a band of parallel multiple microcracks is developed in the compression “strut” between the disc and the counterpressure, carrying the compression load, stage 2 in Fig. 4, right figure.
Fig. 4
Load-displacement curve for a pullout test and the three stages of cracking. Acoustic emission (AE) is also shown on the left figure, the stepped curve.
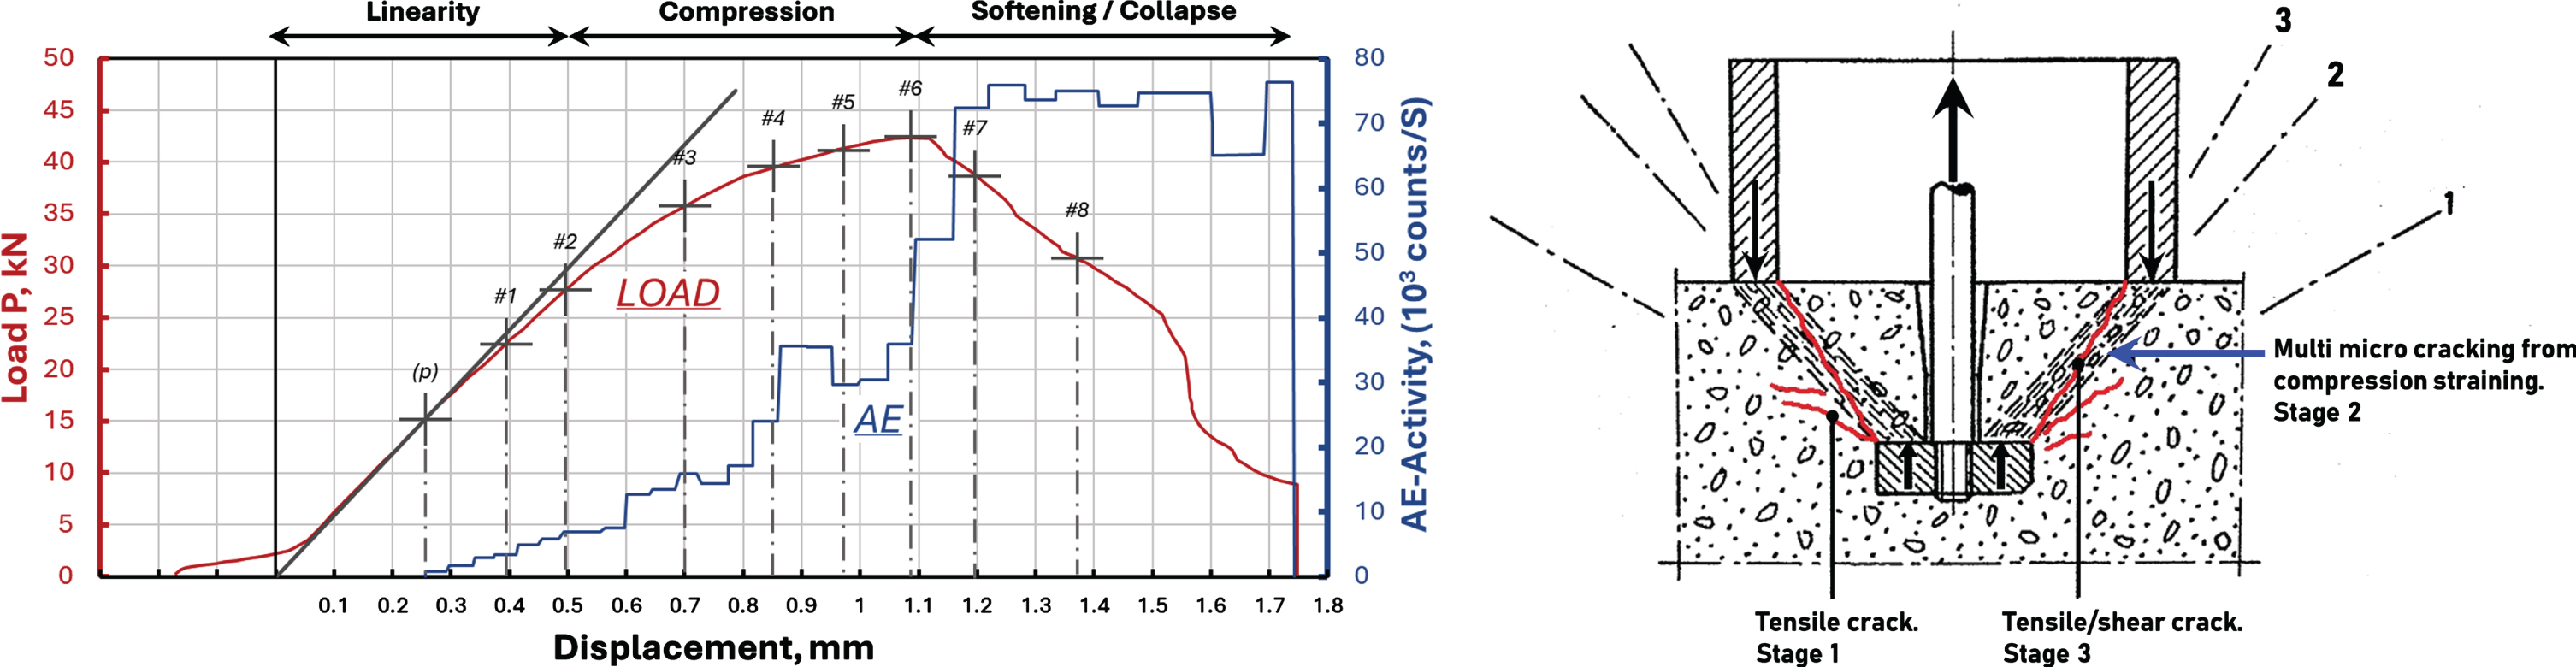
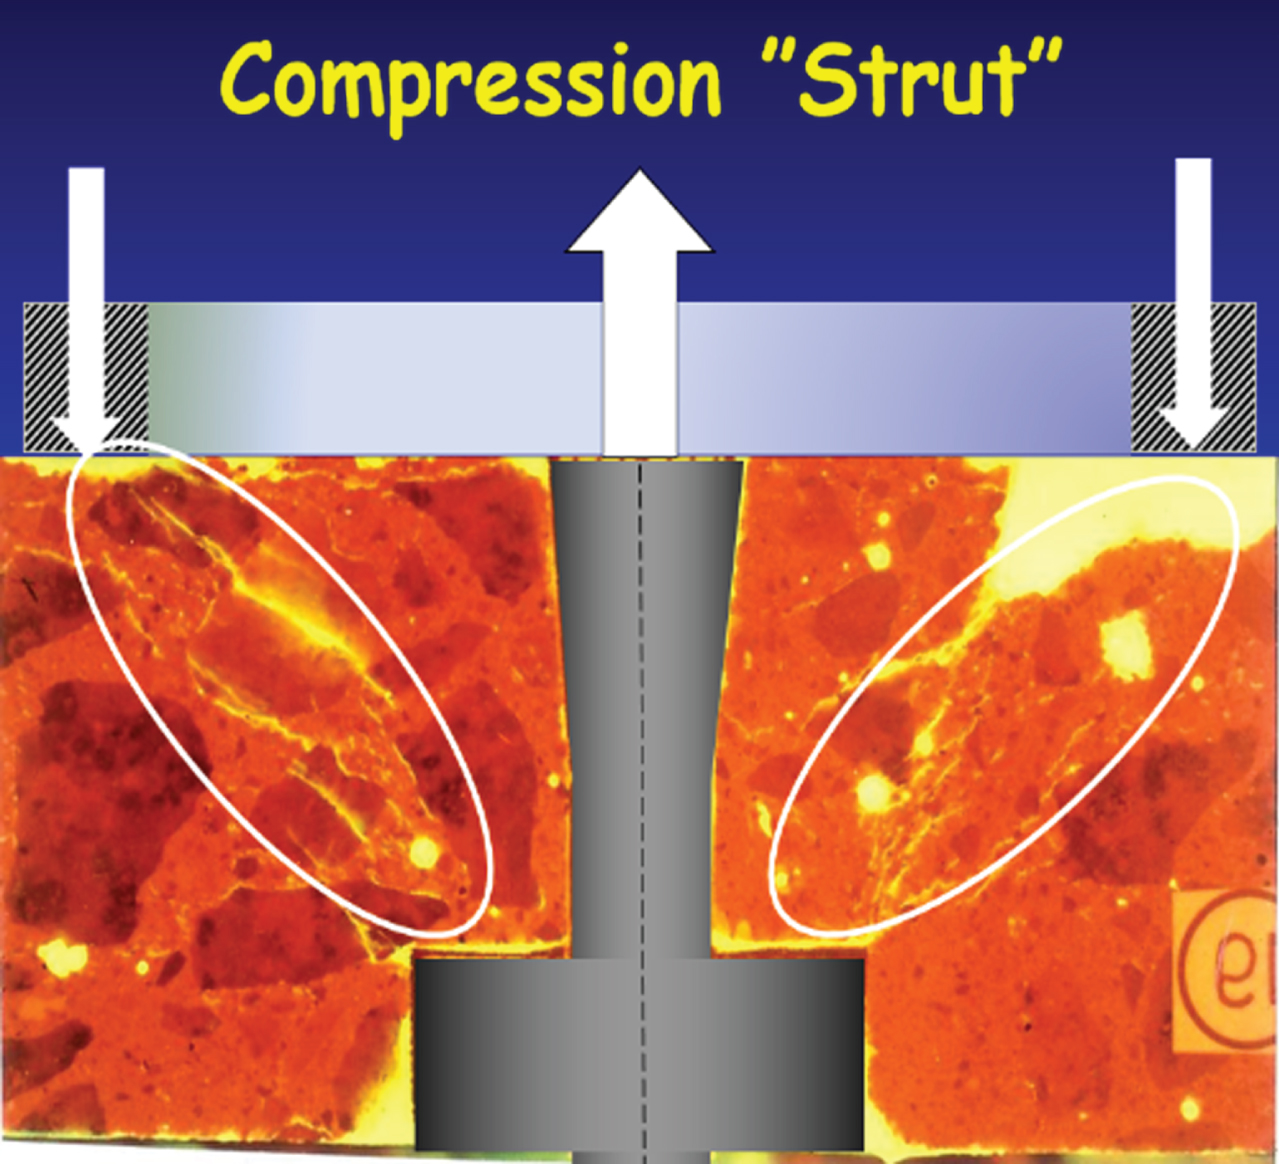
Fig. 5
Parallel microcracking in the “strut”, stage 2.
The circumferential crack, stage 1, developed at ∼30% of the peak load is important, also (black arrow, Fig. 7), as it release stresses in the concrete by which the test results are not influenced by inherent stresses, documented in [12]. A collapse, stage 3, happens from the peak load in the softening regime at increased loading forming the final pullout cone loaded past failure, Fig. 6.
Fig. 6
Collapse, stage 3.
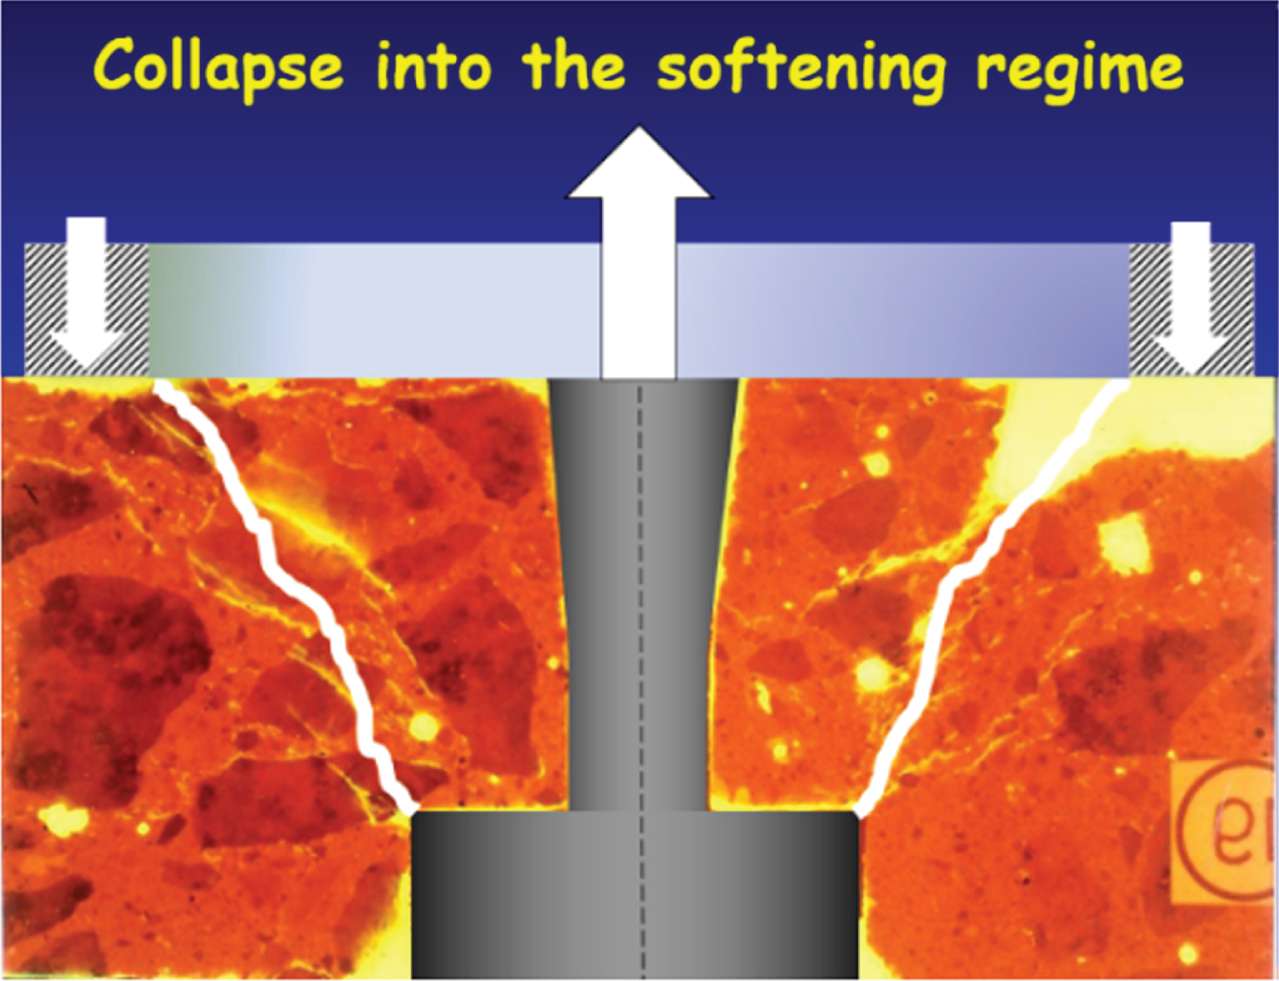
Fig. 7
Detail of 2nd stage cracking in the “strut”, Krenchel (left). and Ottosen (right), has passed stage 1 tensile cracking –black arrow.
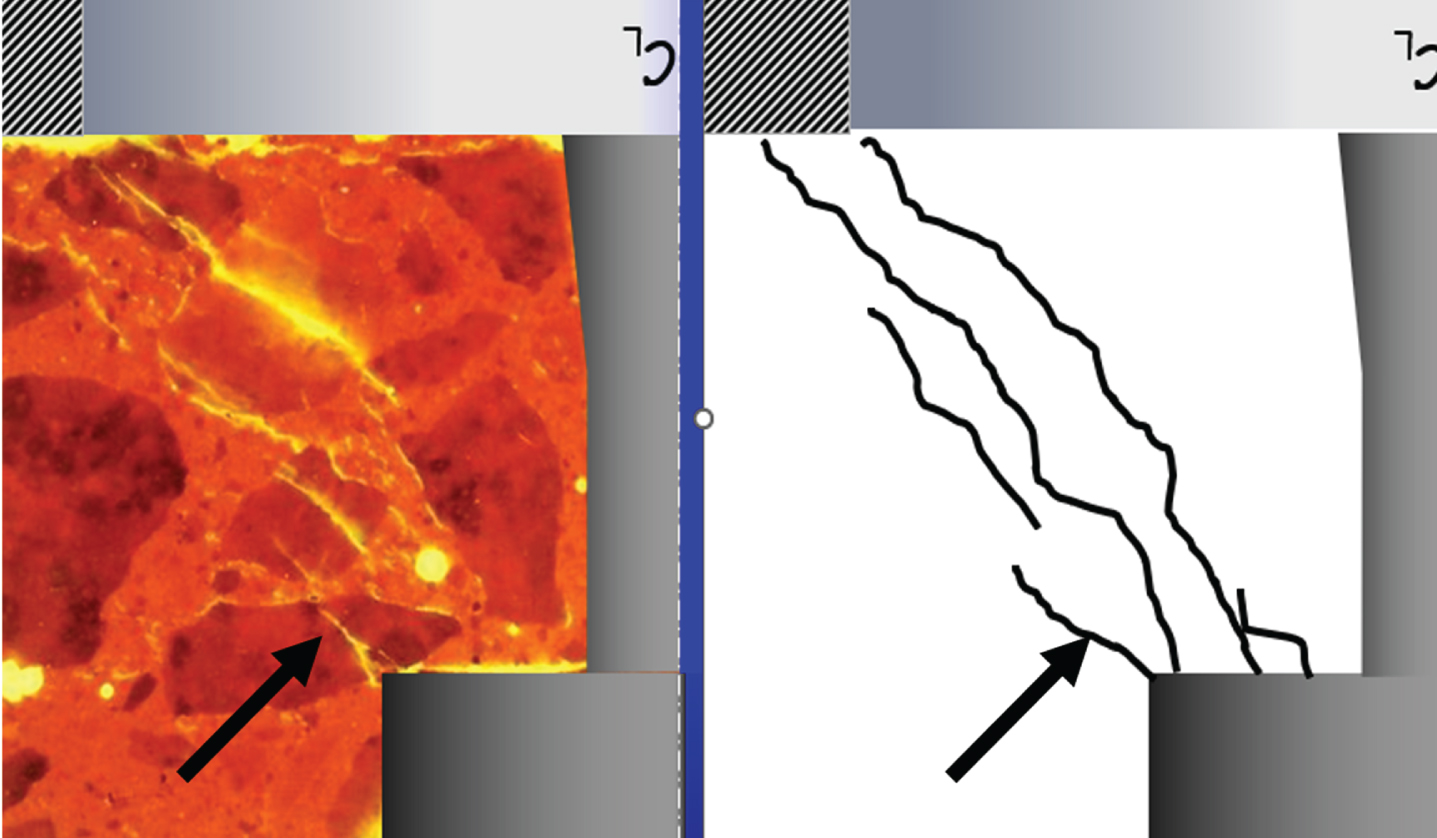
In this manner, LOK-TEST and CAPO-TEST measure the compressive strength of concrete in the 2nd crack pattern, the “strut”. This constitutes the load-carrying mechanism; hence the pullout force is a direct measure of the compressive strength between the disc and the counter pressure.
The width of the cracks in the “strut” was measured by Krenchel in a microscope to be 1/200 mm, confirmed by Ottosen's in his finite element analyses.
It is worth noticing that the load-displacement curve shown in Fig. 4 is identical to a 150 mm×300 mm standard cylinder’s
And, most importantly, the stress in the “strut” is similar to the uniaxial stress in the middle of a cylinder (Fig. 8).
Fig. 8
Stresses in a standard cylinder during loading and, right, in a standard cube.
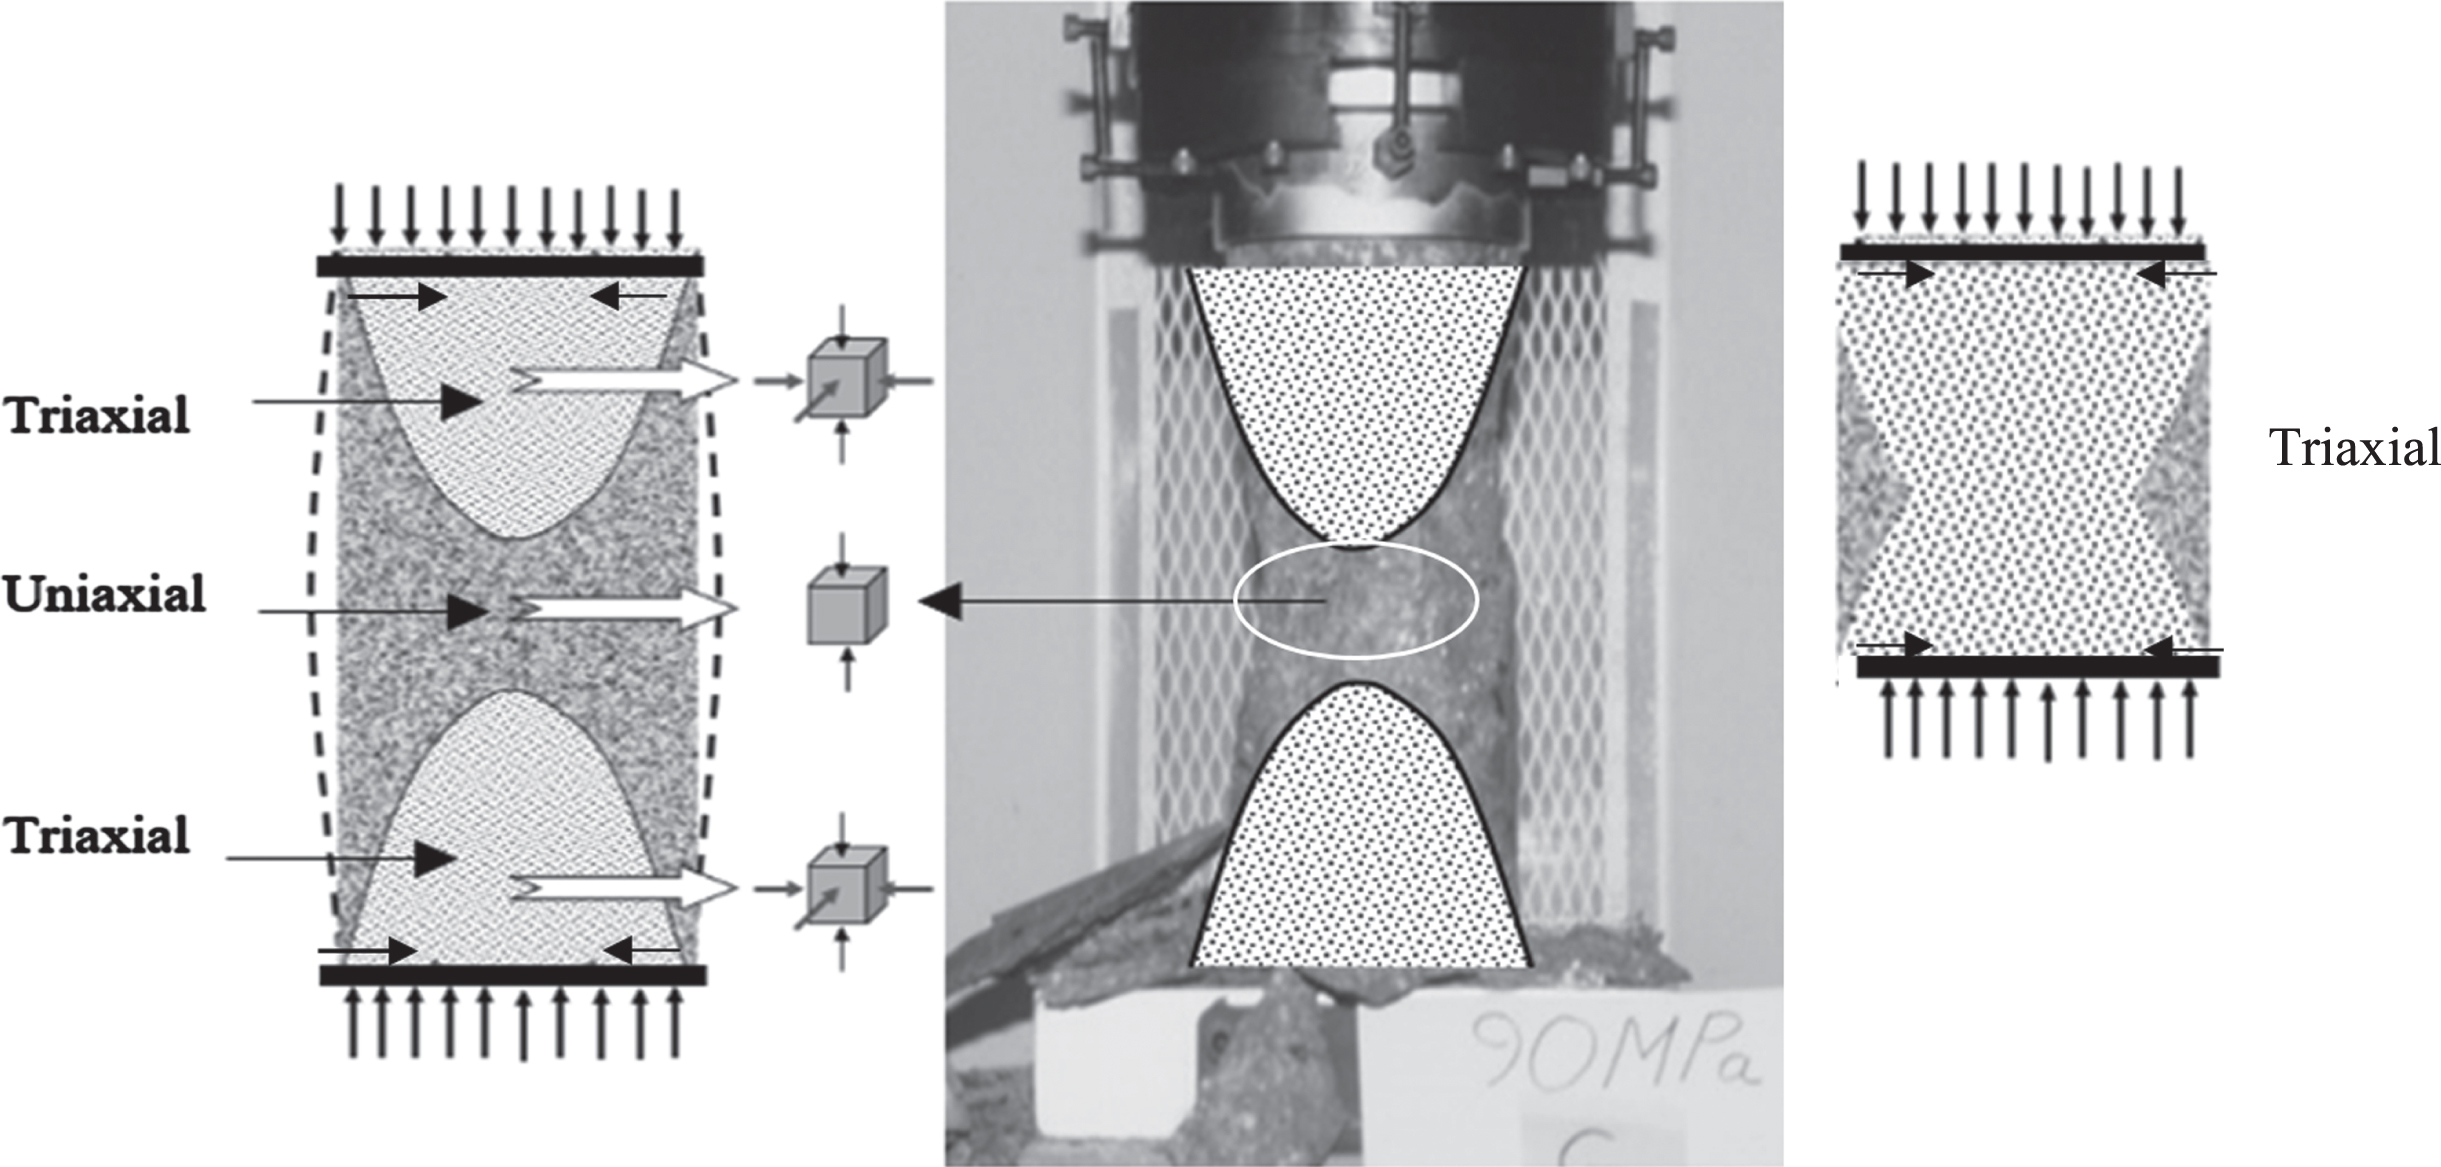
As the cylinder gets shorter, for the same diameter, the specimen will be in a triaxial state of stress, hence the strength of a standard cube or a 100 mm×100 mm core is higher than that of a 150 mm×300 mm standard cylinder as the triaxial stress produce a higher strength than the uniaxial.
In general, the strength of a standard cube 150 mm×150 mm×150 mm is equivalent to the strength of a core, 100 mm dia.×100 mm, both in triaxial stress during compression.
For design calculations it is the uniaxial strength that is important, that is the strength obtained by 150 mm×300 mm standard cylinders, as used.in e.g. Denmark, USA, and Canada.
BS and some EU codes, e.g. Sweden, Poland, UK, Holland and Germany, propose to use 150 mm×150 mm×150 mm cubes, equivalent to 100 mm×100 mm cores, which produce a 20 to 30% higher strength than cylinders cast from the same concrete batch depending on the stress level.
5Experimental correlations
Following completion of these analyses, the first major experimental correlations were made in Denmark at DTU, Danish Technical University, and in Sweden at CBI, Cement och Betong Institutet, Figs. 9 and 10.
Fig. 9
Correlations to cylinders made at DTU, Denmark [2, 10, 15, 21]: LOK-TEST to cylinders (left) and CAPO-TEST to cylinders (right).
![Correlations to cylinders made at DTU, Denmark [2, 10, 15, 21]: LOK-TEST to cylinders (left) and CAPO-TEST to cylinders (right).](https://ip.ios.semcs.net:443/media/brs/2024/20-1-2/brs-20-1-2-brs240220/brs-20-brs240220-g009.jpg)
Fig. 10
Correlations to cubes made at CBI, Sweden, [13, 14]: LOK-TEST to cubes (left) and CAPO-TEST to cubes (right).
![Correlations to cubes made at CBI, Sweden, [13, 14]: LOK-TEST to cubes (left) and CAPO-TEST to cubes (right).](https://ip.ios.semcs.net:443/media/brs/2024/20-1-2/brs-20-1-2-brs240220/brs-20-brs240220-g010.jpg)
In the years to follow, further major correlations were performed, Figs. 11 and 12 , by testing authorities in Denmark, Sweden, Norway, Holland, Canada, USA, Poland, England and KSA, investigating the influence on the correlation for the following parameters on normal concrete:
Fig. 11
Summary of the eighteen correlations [18] to standard 150×300 mm cylinder compressive strength.
![Summary of the eighteen correlations [18] to standard 150×300 mm cylinder compressive strength.](https://ip.ios.semcs.net:443/media/brs/2024/20-1-2/brs-20-1-2-brs240220/brs-20-brs240220-g011.jpg)
![Summary of the twelve correlations [18] standard cubes (or cores) compressive strength.](https://ip.ios.semcs.net:443/media/brs/2024/20-1-2/brs-20-1-2-brs240220/brs-20-brs240220-g012.jpg)
Fig. 13
The experimentally found correlation fcyl = 0.69F1.12 for cylinders compared to the findings of the theoretical analysis by Jensen/Bræstrup. [8] and Ottosen. [9].
![The experimentally found correlation fcyl = 0.69F1.12 for cylinders compared to the findings of the theoretical analysis by Jensen/Bræstrup. [8] and Ottosen. [9].](https://ip.ios.semcs.net:443/media/brs/2024/20-1-2/brs-20-1-2-brs240220/brs-20-brs240220-g013.jpg)
• types of cementitious materials
• water-cementitious materials ratio (w/cm)
• age
• air entrainment
• use of admixtures,
• curing conditions
• stresses in the structure
• stiffness of the members
• carbonation
• shape, type, and maximum nominal size of aggregate up to 40 mm
No influence was found on the general robust correlations, established by averaging, Figs. 11, 12 and 15.
SUMMARY:
In average, the correlation between pullout force F in kN (LOK or CAPO) and 150 mm×300 mm cylinder strength fcyl in MPa is found to be, Fig. 11: fcyl = 0.69F1.12 with a maximum deviation from this general correlation of about 2 MPa, despite the correlations being produced on different laboratory testing machines.
And in average, the correlation between pullout force F in kN (LOK or CAPO) and 150 mm×150 mm×150 mm cube or 100 mm×100 mm core strength fcube/core in MPa was found to be, Fig. 12: fcube/core = 0.76F1.16
What is also interesting is that the uniaxial cylinder correlation shown in Fig. 11, follows closely the analytical theoretical results shown in Fig. 3, summarized below.
LOK-TEST COMPARED TO CAPO-TEST
In Fig. 14, seven major comparisons are presented between LOK-TEST force and CAPO-TEST pull-out force, both in kN, showing a 1 : 1 relationship, meaning that the general robust correlations in Fig. 15 are applicable for both pullout systems.
Fig. 14
Comparison between LOK-TEST and CAPO-TEST.
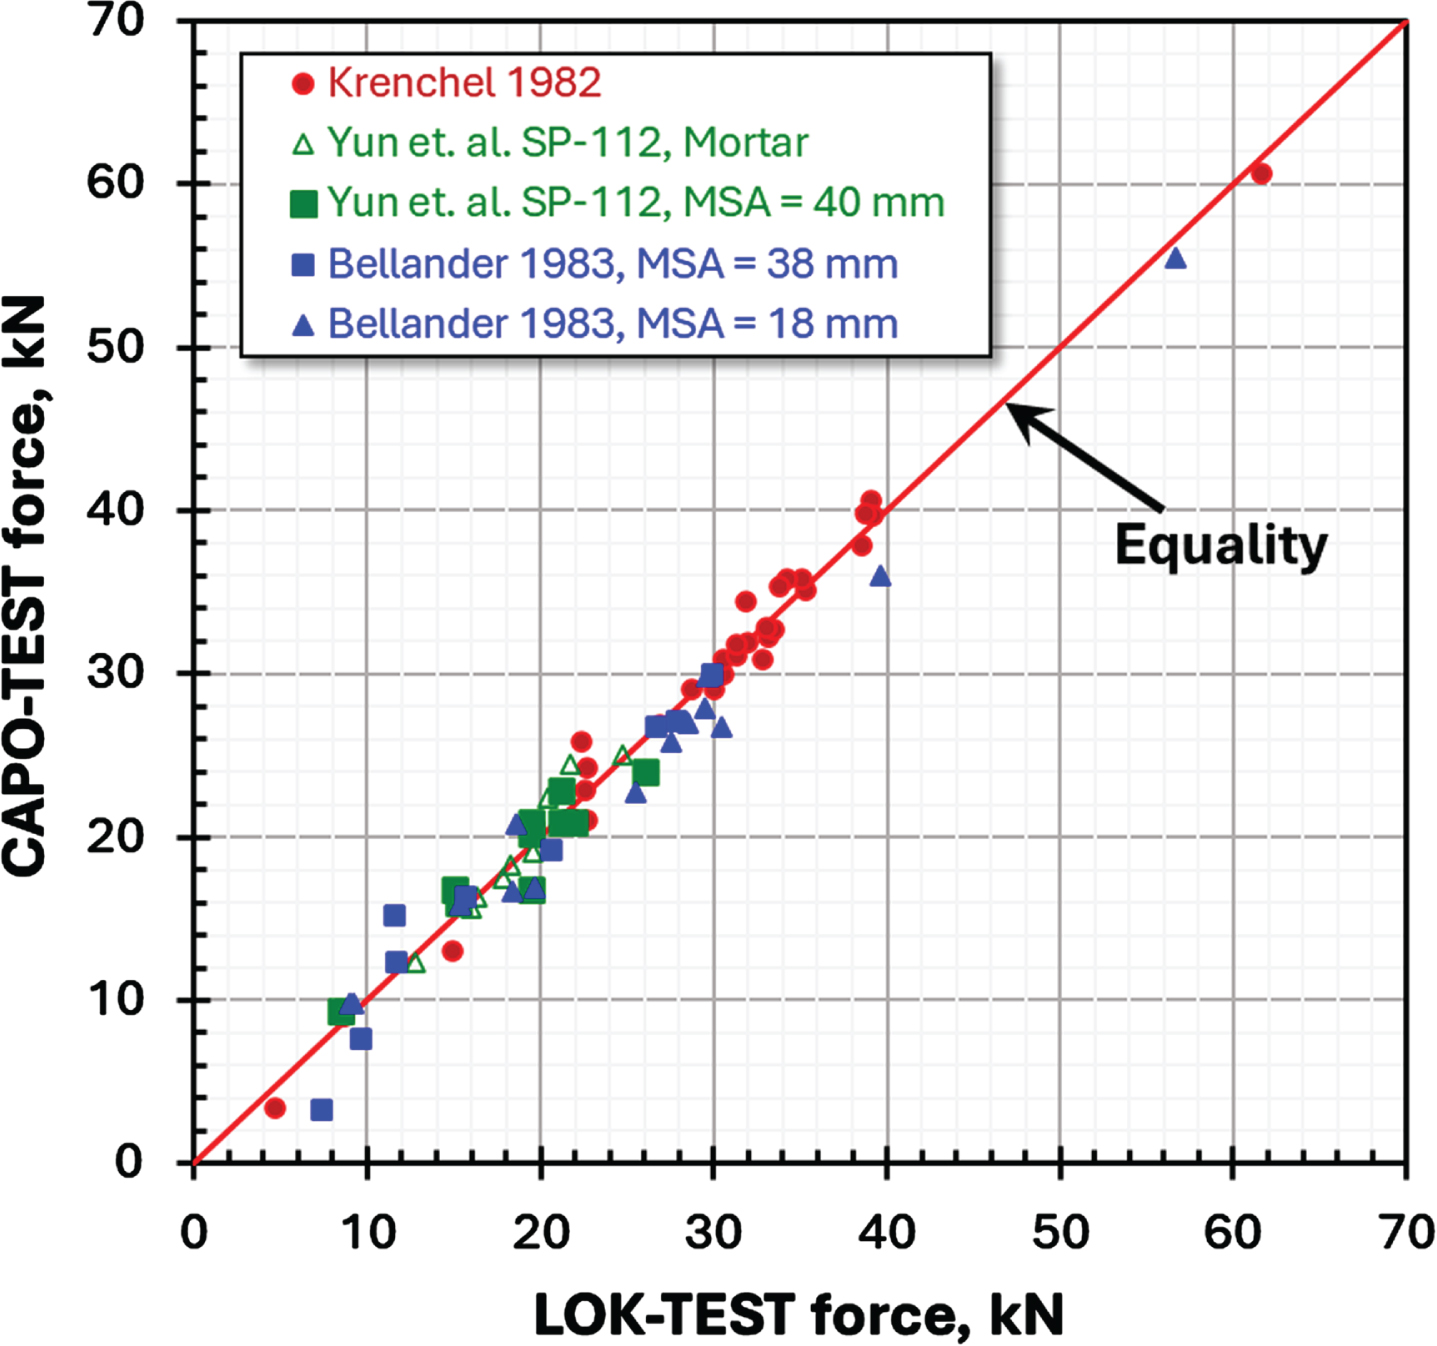
Fig. 15
The general robust correlations between pullout force by LOK or CAPO-TEST to standard cylinder or standard cube/core strength.
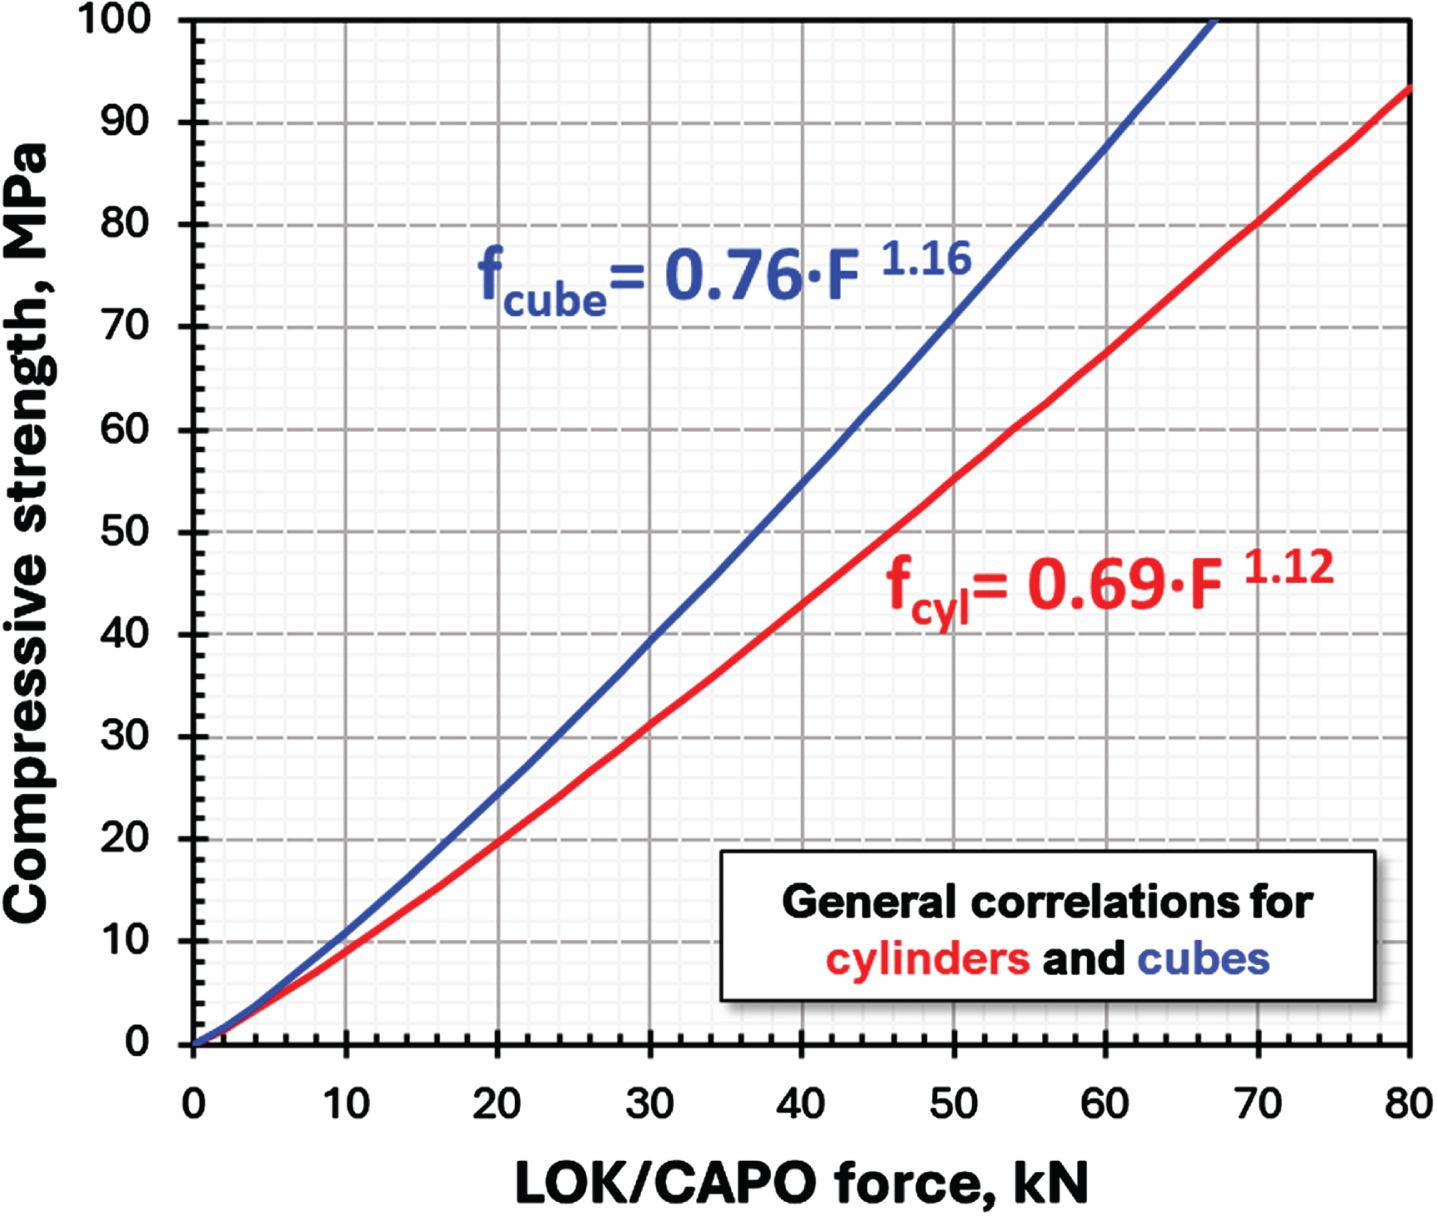
6The general robust correlations
The two general robust correlations are presented together in Fig. 15. For the same pullout load, cubes/cores produce 20% to 30% higher strength than the cylinder depending on the strength level.
7Variations
Variations were reported in large scale in 1984 [15, 16]. Table 1 shows the results in laboratory conditions and Table 2 are from testing on-site.
Table 1
Laboratory variations
| Procedure /Laboratory | Standard specimen | Pullout | ||
| COV | Nos | COV | Nos | |
| Danish | 4.3% | 1177 | 9.4% | 2188 |
| North American | 6.4% | 994 | 7.5% | 994 |
| Swedish/ Dutch/UK | 6.2% | 963 | 6.8% | 1180 |
Danish: 150×300 mm standard cylinders, and 200 mm cubes for pullout, centrally placed in the vertical faces, two LOK-TEST and two CAPO-TEST in each cube. North American: 150×300 mm standard cylinders and accompanying cylinders with LOK-TEST in the bottom. Swedish/Dutch/UK: 150 mm cubes and accompanying cubes for pullout, one LOK-TEST and one CAPO-TEST.
Table 2
Variations on-site
| Structure | LOK-TEST | CAPO-TEST | ||
| COV | Nos | COV | Nos | |
| Shotcrete | 3.2% | 820 | ||
| Slabs, bottom | 10.5% | 5320 | 7.1% | 35 |
| Slabs, top | 12.9% | 955 | 9.3% | 623 |
| Beams &Columns | 8.1% | 677 | 8.0% | 434 |
| Walls &Foundations | 10.1% | 1020 | 10.4% | 534 |
| Dubious Structuresa) | 14.7% | 1225 | 15.3% | 3334 |
a)Dubious structures: ASR reacted, non-uniform concrete, insufficient consolidation and curing, changed mixes, fire damaged structures and frozen concrete. Normal practice on-site is to use an average of two pullouts as one observation.
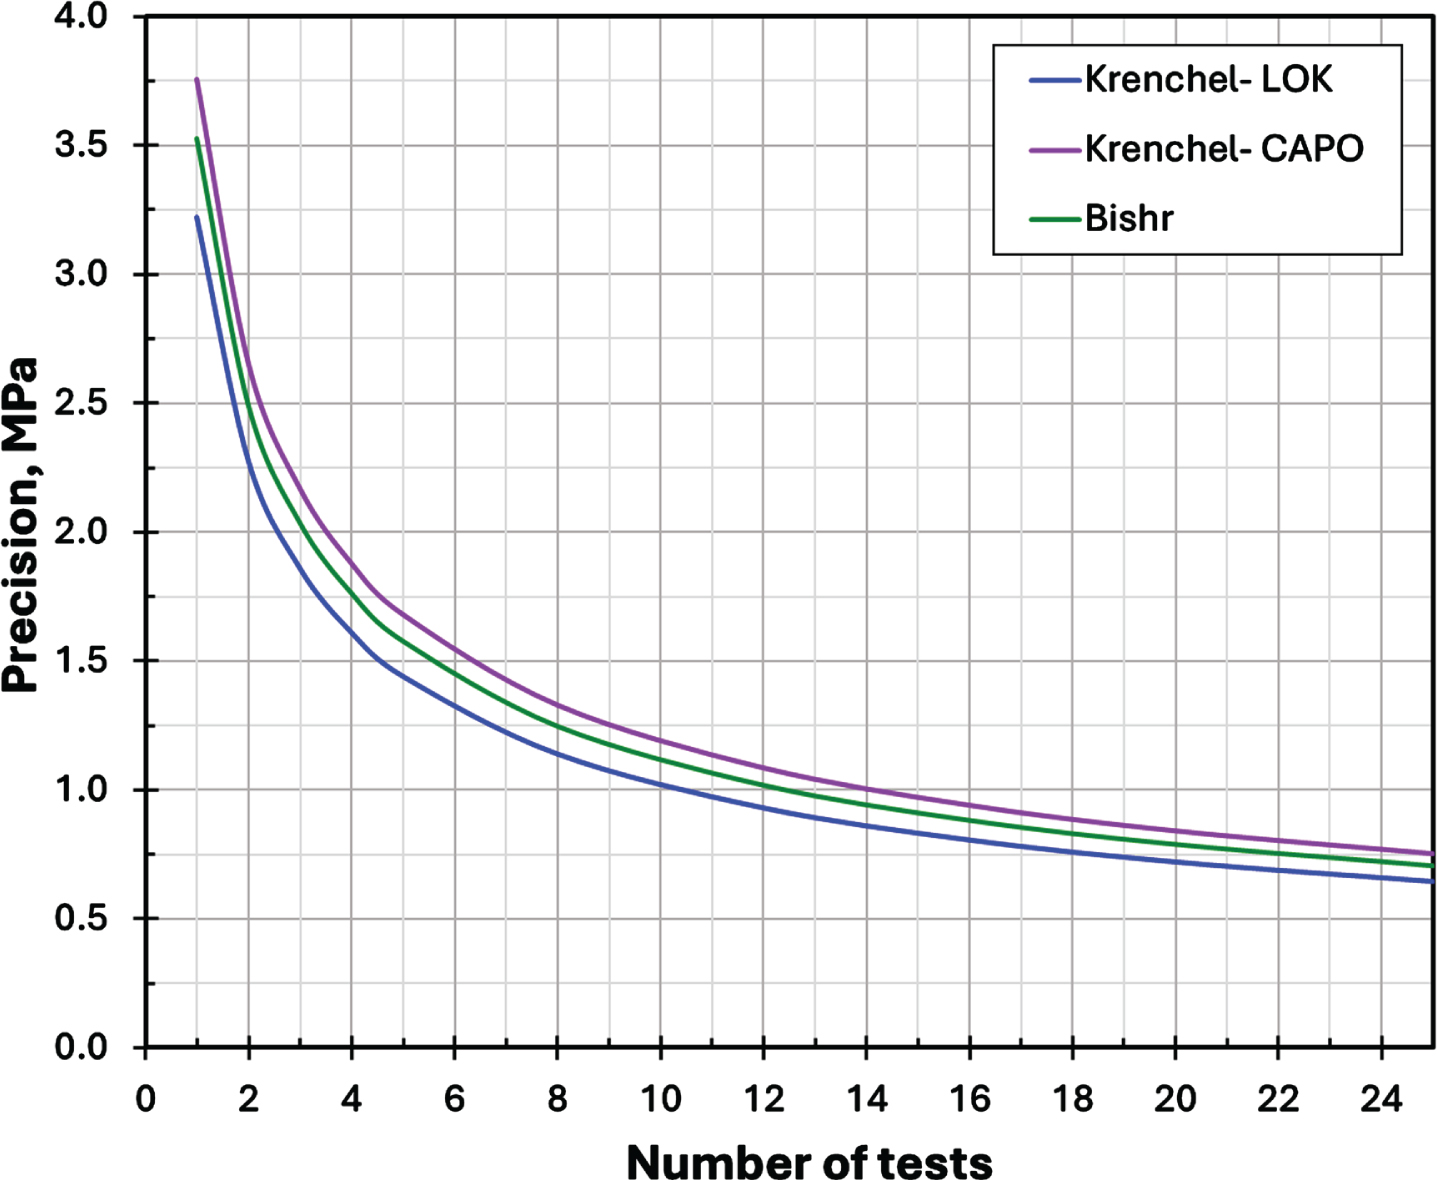
8Precision
As shown in Fig. 16, LOK-TEST and CAPO-TEST have a precision of 2.0 MPa for an average of two tests and 1.5 MPa for four tests. The precision is calculated based on correlations made by Krenchel Fig. 17 and Bishr, Fig. 18, matching the general robust correlation.
Fig. 16
The calculated precision in MPa of LOK-TEST and CAPO TEST in dependence of number of tests. 95% confidence level.
![Krenchel data for precision calculation [21].](https://ip.ios.semcs.net:443/media/brs/2024/20-1-2/brs-20-1-2-brs240220/brs-20-brs240220-g017.jpg)
![Bishr data for precision calculation [17].](https://ip.ios.semcs.net:443/media/brs/2024/20-1-2/brs-20-1-2-brs240220/brs-20-brs240220-g018.jpg)
PRECISION
P: Precision is the maximum error between the in-situ obtained sample average of pull-out force and the true average at a certain confidence level (ACI 437 R, ASTM E122),
Z, factor of the normal distribution = 1.96 for a 95% confidence level
n, sample size, number of in-situ Lok/Capo tests
Cv, coefficient of variation of the data sets,
x, mean of the data sets,
sp = Pooled standard deviation of the data sets
ni···m = number of tests per set, and
m = number of sets.
9Accuracy
As mentioned, the general correlations, Fig. 15, have been established by averaging multiple correlations with many different concrete mixes and all conceivable concrete parameters.
The general correlation to uniaxial compressive strength of a standard cylinder, the fcyl = 0.69 F1.12 match well the findings in two theoretical studies, Fig. 13, which substantiate it further.
To show how robust in terms of accuracy the general correlation is, the data from Krenchel of pull-out force vs standard lab cylinders [2] from 1970 can be used as an example.
Figure 19 shows the best fit line of the tests with its 95% confidence limits. The overlaid general correlation passes within the band limits and has a slope identical to the Krenchel 1970 correlation over the entire strength range up to 80 MPa.
Fig. 19
The general correlation passing through the 95% confidence limits of a properly made correlation program.
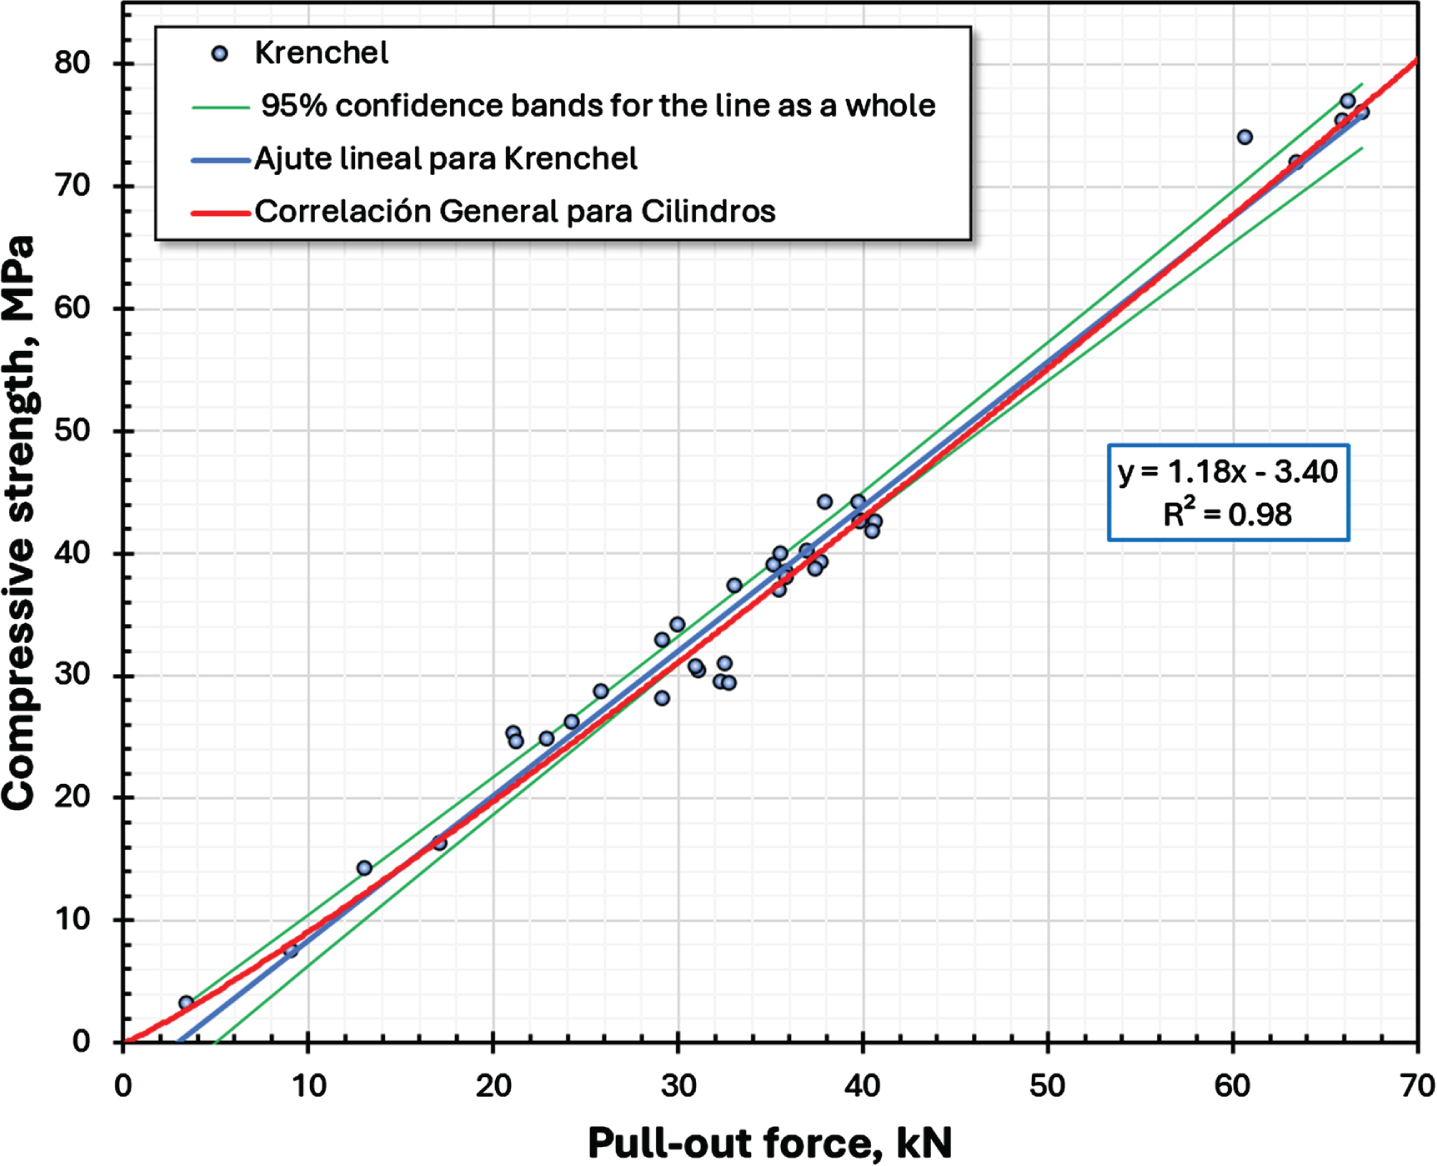
Fig. 20
The Great Belt Fixed Link in Denmark.
One can take any properly made correlation and do the same exercise to confirm the general correlation. Procedure for establishing such a proper correlation is detailed in [38] “Appendix 2. Relation of pull-out force versus compressive strength” p. 85–100, or in ACI 228.1R-19 [1].
Figure 35 is another example where the data corresponds to cores from the structure of different bridges vs pull-out force, and the general correlation, in this case for cubes (assuming the strength of a standard cube equals the strength of a 100 mm diam.×100 mm long core), runs perfectly within the confidence limits as well.
10Canadian LOK-TEST experience
During cooperation with Professor Herbert Krenchel of DTU, Denmark [21], Dr.John A. Bickley introduced the LOK-TEST in Canada, concentrating on reducing construction schedules of high-rise structures for safe and early loading, of which he became a champion, as illustrated in case 12.6.
Dr. John A. Bickley stated to the Author several times: “Claus, you are selling instruments, I am selling money.”
Dr. John A. Bickley published many papers related to this concept as well as other applications,
Data and variations of the LOK-TEST are referenced in [22–28 and 29].
In [27 and 29] are described revolutionary cases where only LOK-TEST was used for QC on large projects, wavering the standard laboratory cylinders and avoiding using laboratory testing machines on remote sites.
One of his conclusions is mentioned in [4], as early as in 1978: “The LOK-TEST system of pullout tests offers a simple, reliable, economic and non-destructive way of determining the actual in-place strength in a practical statistically valid manner”.
“Non-Destructive”- is performed by only loading the LOK-TEST right to the peak point on the load-displacement curve, or to a required strength without failing the concrete.
In Dr. John A. Bickley's autobiography “Anecdotes of My Life” p. 177, he appoints the LOK-TEST to be “The Holy Grail of Concrete Testing”, as it is “beautifully engineered and fit into a brief case, the pullout test specimen is 25 mm in diameter and the same distance inside the concrete making it practical for structural members like slabs, and the correlation between pullout and compressive strength is a straight line”.
An example of testing with LOK-TEST on a high-rise for safe and early form stripping is given in case 12.6.
11British pull-out experience
Professor John Bungey tested LOK-TEST and CAPO-TEST systematically in conjunction with standard and temperature-matched cubes [30–33 and 34] on major projects, concluding that “the combined correlation is surprisingly very close to the manufacturer’s correlation” and “one strength correlation can be used for both the LOK- and the CAPO-TEST”.
The systems were subsequently recommended as “Best Practice Guides for In-Situ Concrete Frame Building” [35].
12Cores and/or pullout, USA
In Dr. Nicholas Carino’s presentation, Cores ASTM, (45). He outlines that for cores the strength depends on a number of factors:
• Core size
• Location of core
• Direction of coring
• Moisture conditioning
• Length to diameter ratio
• End preparation
• Embedded steel
Additional information is presented in Dr. Carino’s presentation:
13Case studies
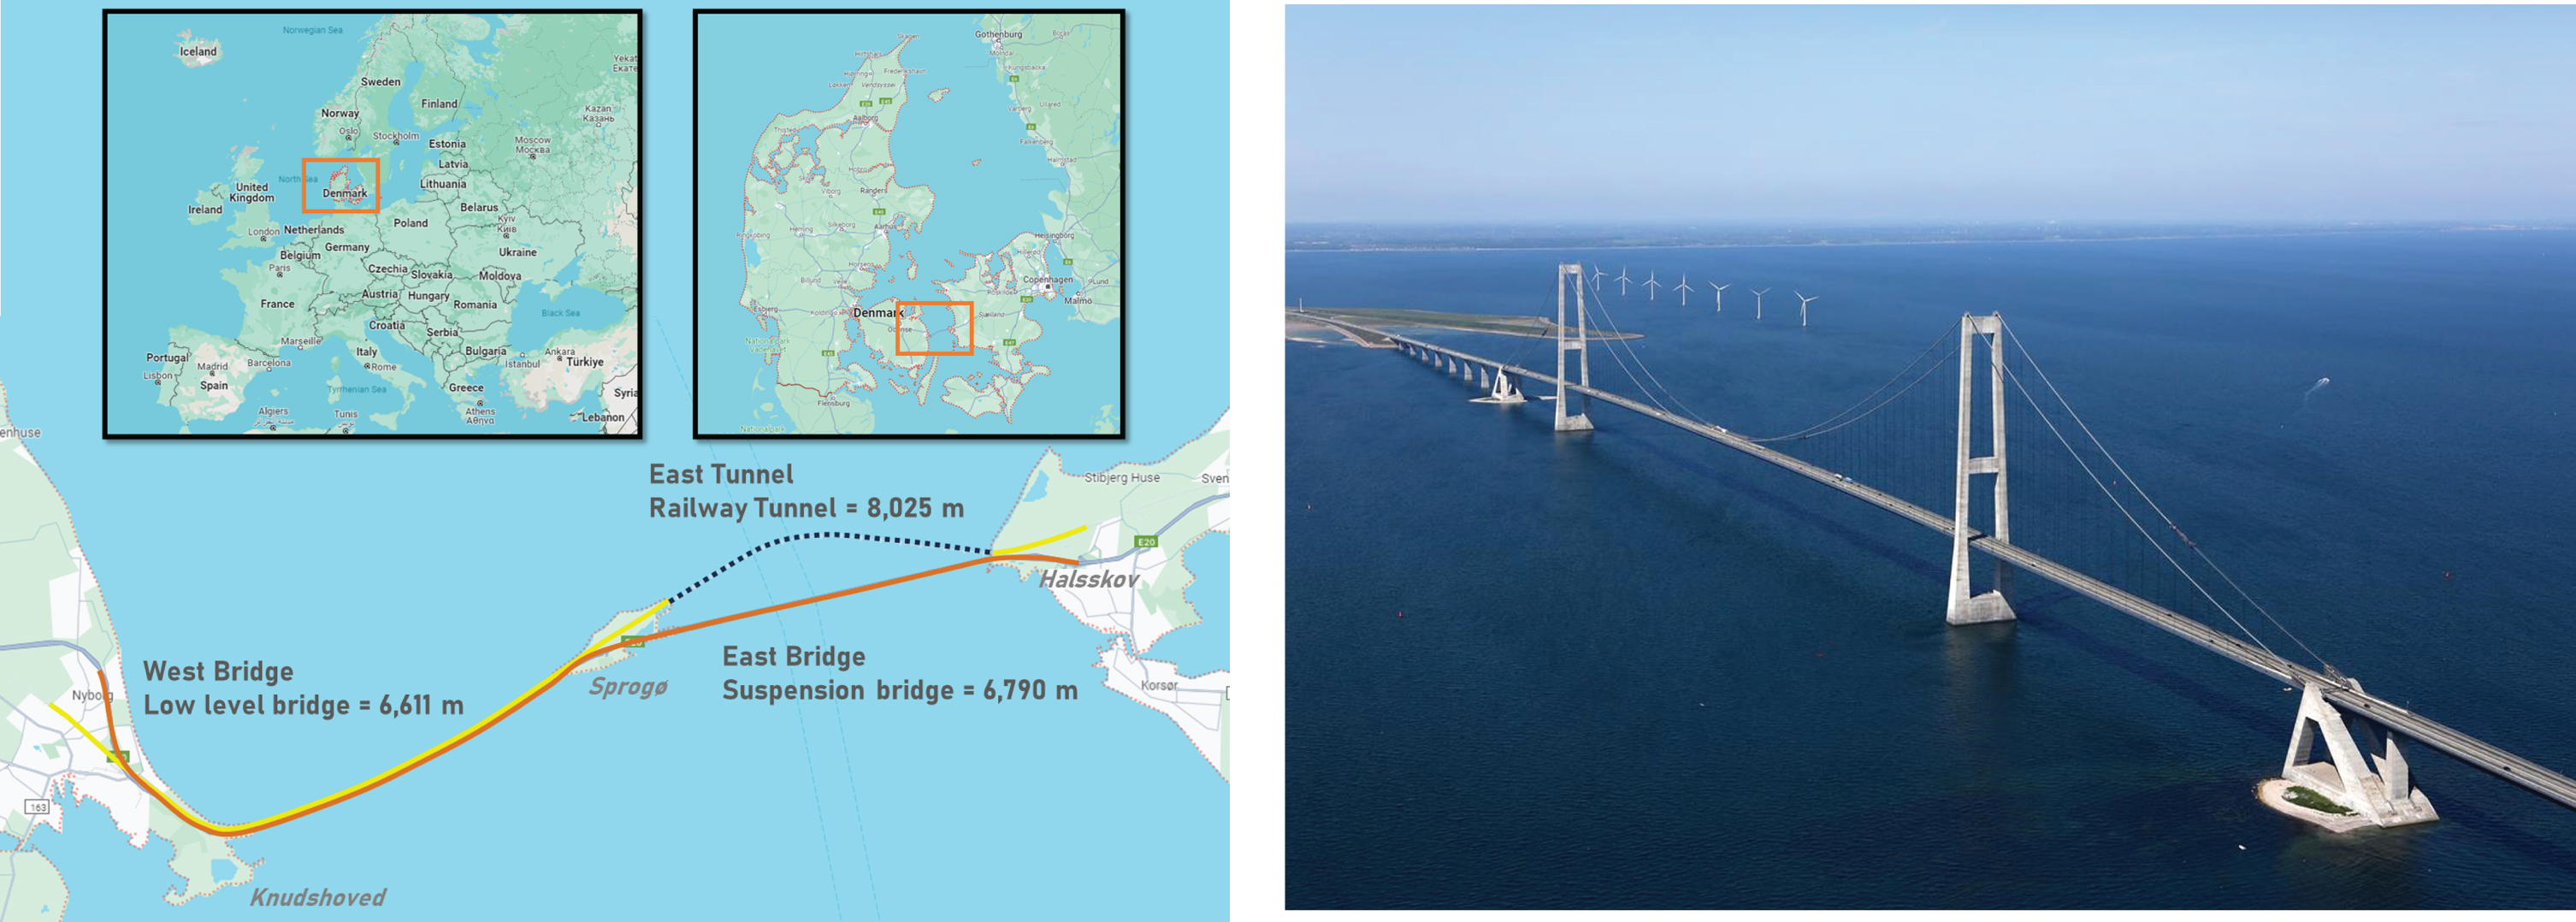
13.1Production testing at the great belt link, Denmark
For production testing the pullout was specified on the Great Belt Link, Denmark [36], not only for strength and durability but also for uniformity of the in-place concrete.
The construction work took place between 1988 and 1998 and because of its size and importance, implied that all aspects of durability were studied on an unprecedented scale in Denmark to keep the risk level at a minimum for a 100-year service life design period. One important objective was therefore to specify the requirements to prevent deterioration from alkali-silica reactions, frost attack, and reinforcement corrosion due to chloride ingress. In total, the project comprised 1.1 million m3 of concrete.
The potential compressive strength tested on well-compacted and cured lab specimens, and the achieved characteristic compressive strength at the cover layer was controlled using in-situ testing with LOK and CAPO tests [36–38].
The decision rule for in-situ acceptance in an inspection section was: {fc} ≥0.8knfck, where {fc} is the in-situ mean value of the strengths measured, and kn is a factor that depends on the number of tests and the coefficient of variation [38].
During full-scale trial castings of the abutment caissons of the West Bridge, it was realized that the in-situ CAPO strengths determined by the general correlation produced significantly lower results. The contractor produced hereafter his own correlations as shown in Fig. 21, to achieve acceptance. Curing conditions of the pullout specimens is unknown but believed to be air-cured.
Fig. 21
The correlations applied on the Great Belt Link.
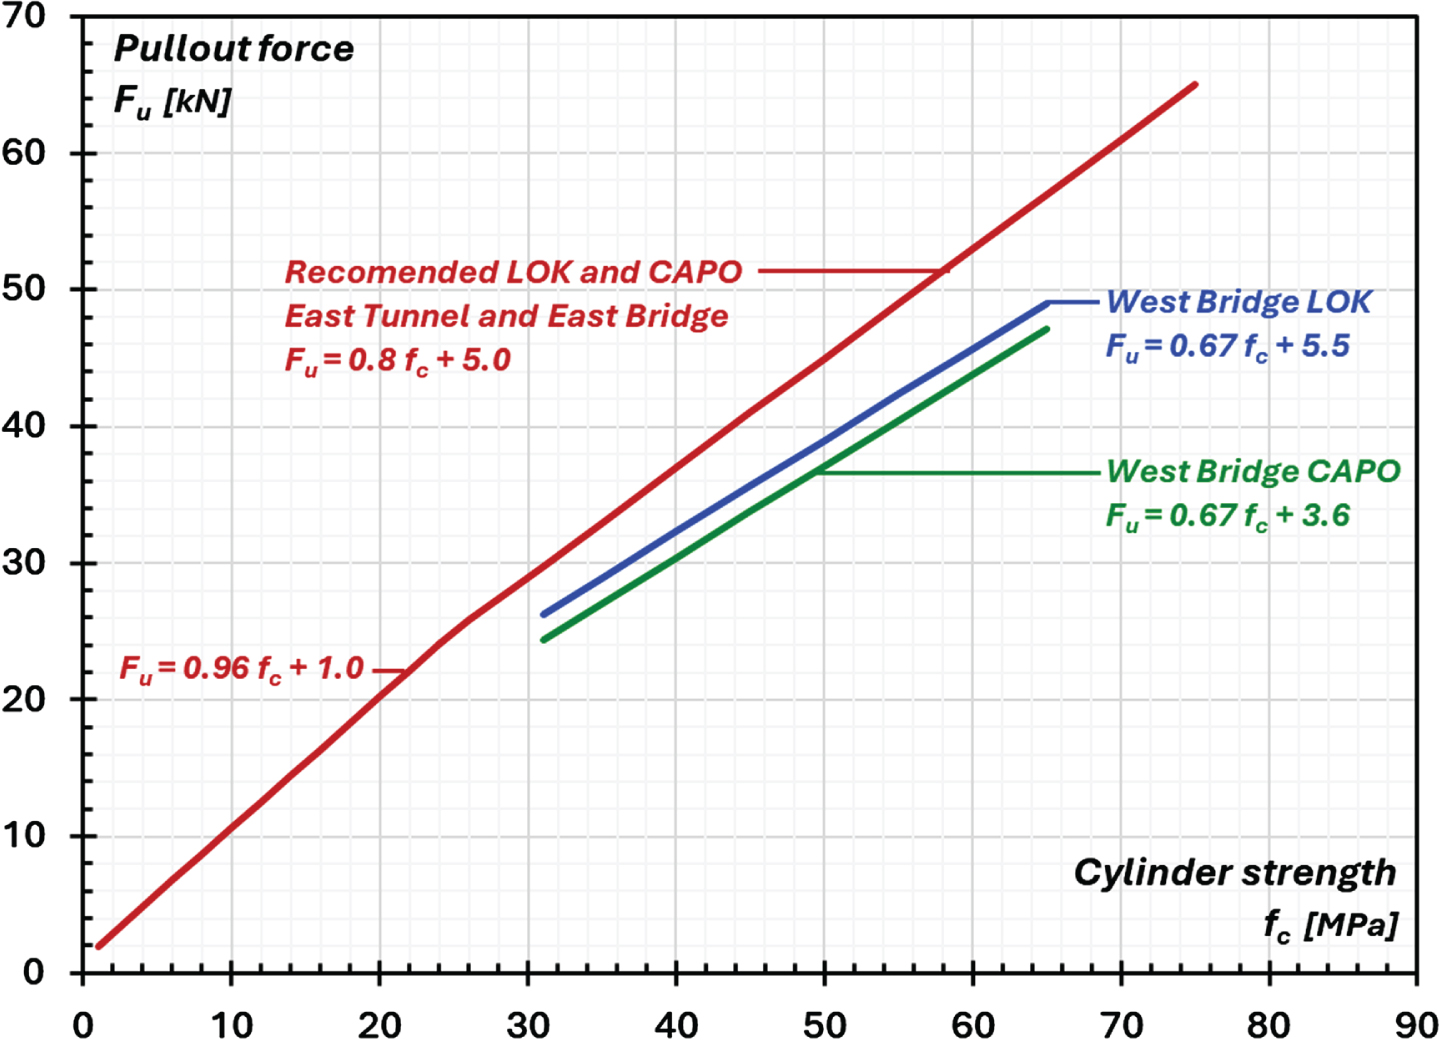
The reasons for the lower CAPO-TEST strength in the West Bridge caisson’s cover layer was discovered to be related to the slipform casting procedure.
“Petrographic results showed cracks, porosities and separation in the cement paste of the cover concrete. In particular, many surfaces parallel defects could be observed” [36, p. 211], Fig. 22.
Fig. 22
Petrographic testing showing separation in paste and paste/aggregates.

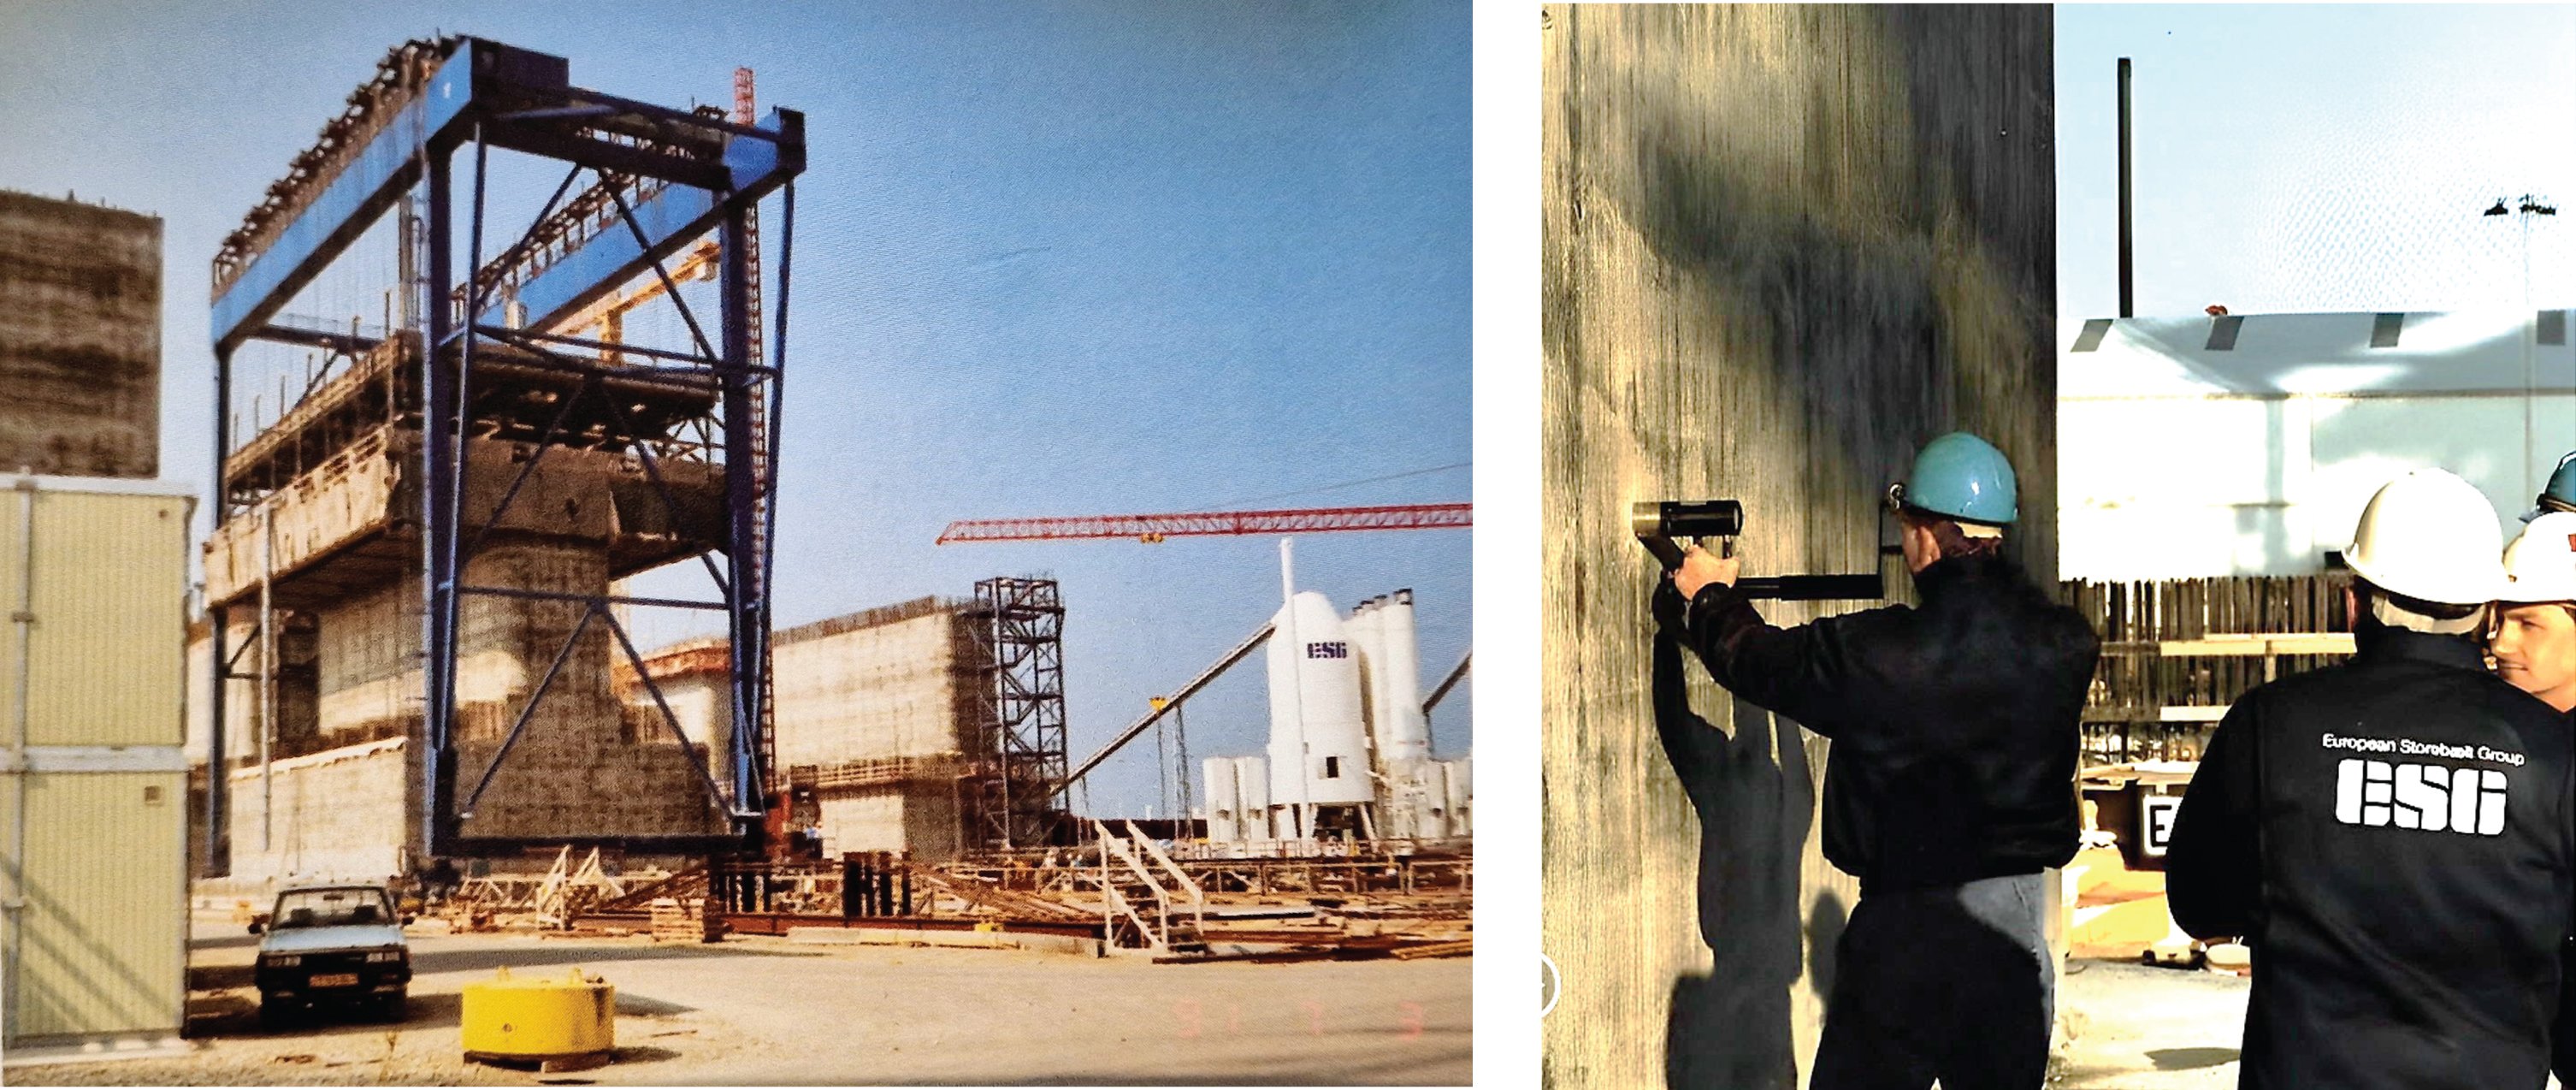
Fig. 23
Steel slipform used for the caissons (left), and CAPO-Testing (right).
Further findings and conclusions:
“Investigations showed that the defect in the cover layer could not be avoided, They were caused by the filling of the small slip, that occurred between the concrete and the steel form each time the form was lifted”, “Also. An investigation was made on other slipformed structures in Denmark. All these structures showed similar defects” [37, p. 129].
“At the time, where the problems were discovered, it was no longer possible to change the slip forming concept without causing serious delays to the whole project, and it was decided to proceed with the slip forming concept” [37, p. 130].
“In conclusion, the defects appeared to be an inherent part of the slip forming concept, and could not be avoided unless the production concept was changed, which was not practically and economically possible” [36, p. 212].
“To remedy the effects observed in the petrographic testing, it was decided to install cathodic protection systems on all the West Bridge's caissons” [35, p. 215].
For pullout testing the structures were subdivided into inspection sections, each of which was accepted or rejected after thorough statistical evaluation [38], The main quantities and number of required strength tests for one of the inspection sections are presented in Table 3 for the West Bridge.
Table 3
Details per inspection section in the West Bridge
| Concrete, m3 | No. of LOK/CAPO tests | No. of test cylinders | |
| Caissons (walls) | 2,500–2,900 | 100–116 | 50–58 |
| Pier shafts | 700–1,200 | 28–48 | 14–36 |
| Road girder | 2,300 | 92 | 46 |
| Rail girders | 1,700 | 84 | 34 |
An example of the outcome is shown in Fig. 24 for the West Bridge rail girder inspection sections by LOK-TEST compared to lab cylinders.
Fig. 24
Results of laboratory cylinders and in-situ LOK-TEST performed on the West Bridge's rail girder section. The reason for the drop in LOK-TEST is unknown.
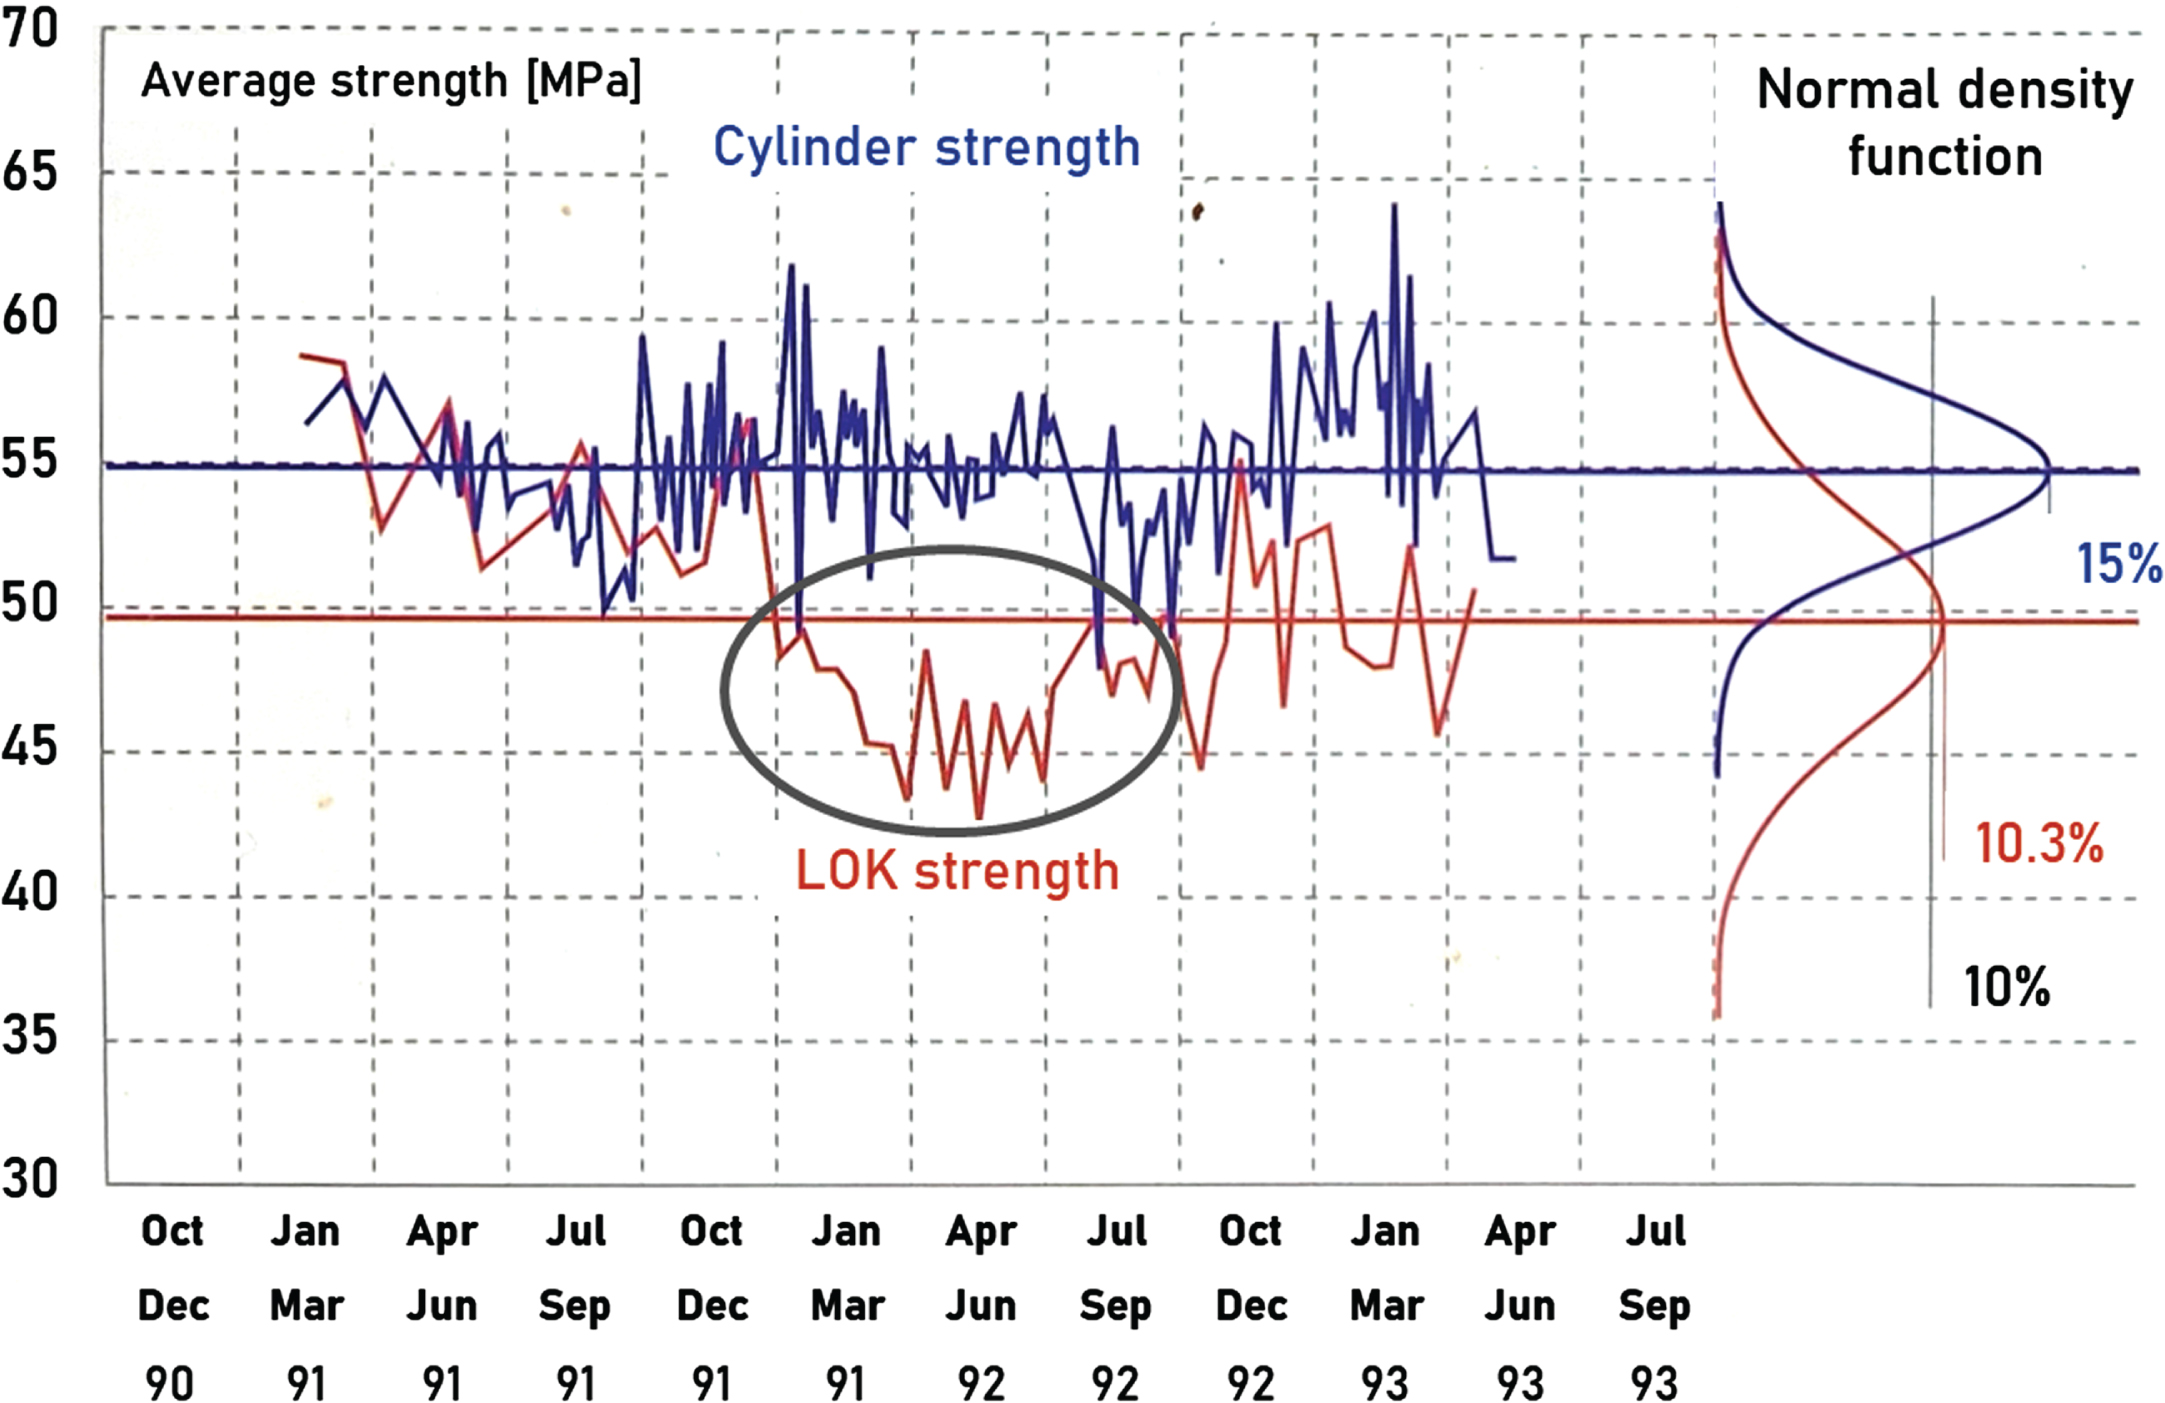
As will be seen, in the beginning of the test period the cylinder and in-situ strengths with LOK-TEST were almost identical until November 1991. From there on, the LOK-strength was lower because of poorer concrete quality in the concrete cover.
The final results of the comprehensive statistical evaluation of the major part of the project (Table 4) shows the differences between the strength and coefficient of variation, CV, obtained under lab conditions (cylinders) and under in-situ conditions, which in turn, evidence how important the control of transport, casting, compaction, and curing of the concrete is in order to maintain a proper level of quality. Without quantitative monitoring the structure, the works would have run in blind.
Table 4
Results of the comprehensive statistical evaluation
| 28-d LOK/CAPO strength, fL/C | 28-d cylinder strength, fc | Ratio | |||
| Structure/Concrete ID | Avg., MPa | CV, % | Avg., MPa | CV, % | fL/C/fc |
| East Tunnel A1 | 58.2C | 16.3 | 76.4 | 6.0 | 0.78 |
| East Bridge A | 55.4L | 11.6 | 55.8 | 7.6 | 0.99 |
| B | 51.8L | 13.3 | 53.0 | 6.9 | 0.98 |
| West Bridge A | 53.7L | 9.7 | 57.6 | 4.9 | 0.93 |
| B | 51.9C | 19.5 | 57.4 | 4.9 | 0.90 |
In-situ strength testing had never before been used for production tests in Denmark, but on the Great Belt Link LOK-test inserts were used for all structures (in average 1 observation for every 25 m3 totaling 35,000 LOK-TESTs) except the slip-formed caisson walls (West Bridge) and the tunnel lining segments, where CAPO-TESTs were used.
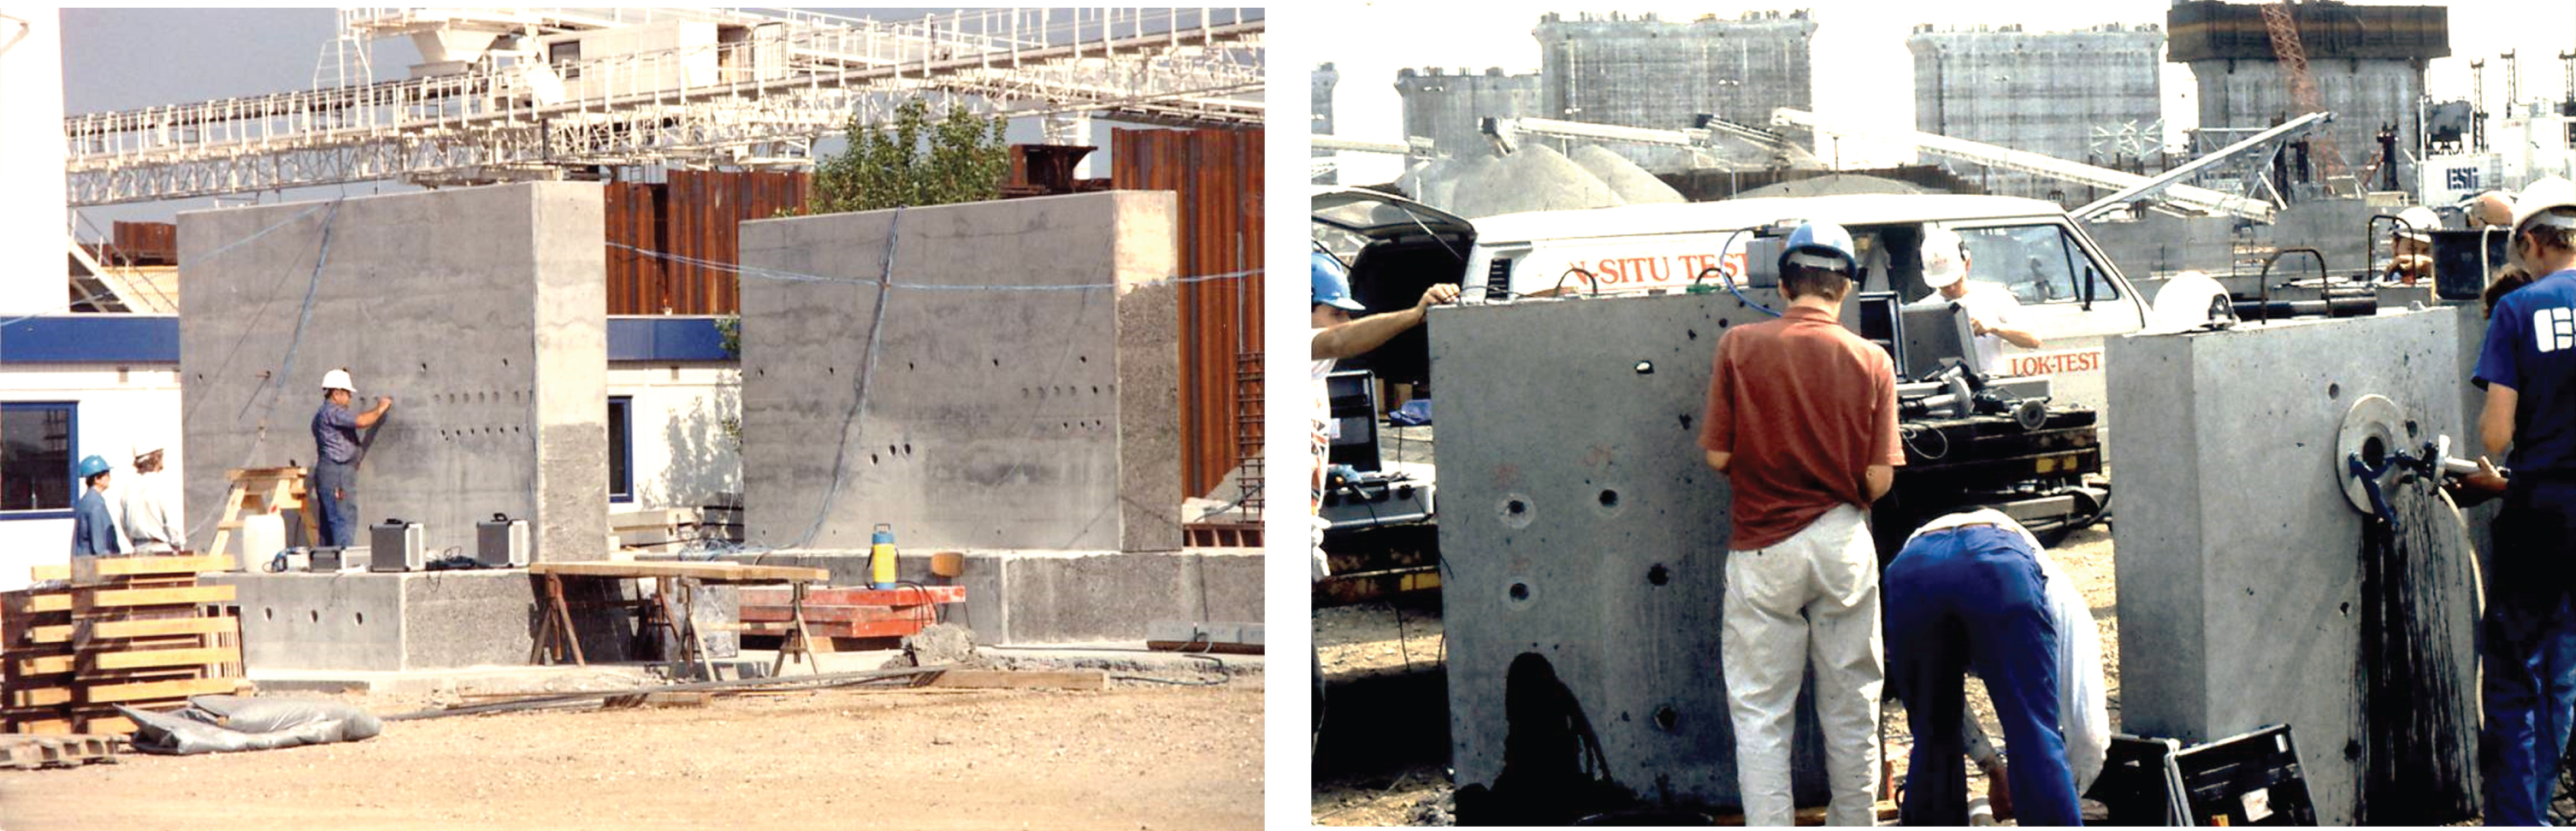
Well-planned pretesting and trial castings for the actual work methods, and prior certified training of the workforce, was a key aspect as well of training and technical follow-up during this Danish iconic project, Fig. 25.
Fig. 25
Trial testing for chloride migration and pullout (left) for the specified concrete, and Certification Course in testing with LOK-TEST and CAPO-TEST (right). Diploma was awarded if the technician could complete 4 LOK-TEST's and 4 CAPO-TEST's within 2 hours.
The conclusion by the owner of the Great Belt Link concerning using LOK-TEST and CAPO-TEST for production testing [36, p. 270] was:
“the use of pull-out testing (LOK and CAPO tests) is a primary recommendation for production testing, provided that problems relating to training test operators, placing test bolts, and statistical evaluation of results are solved.
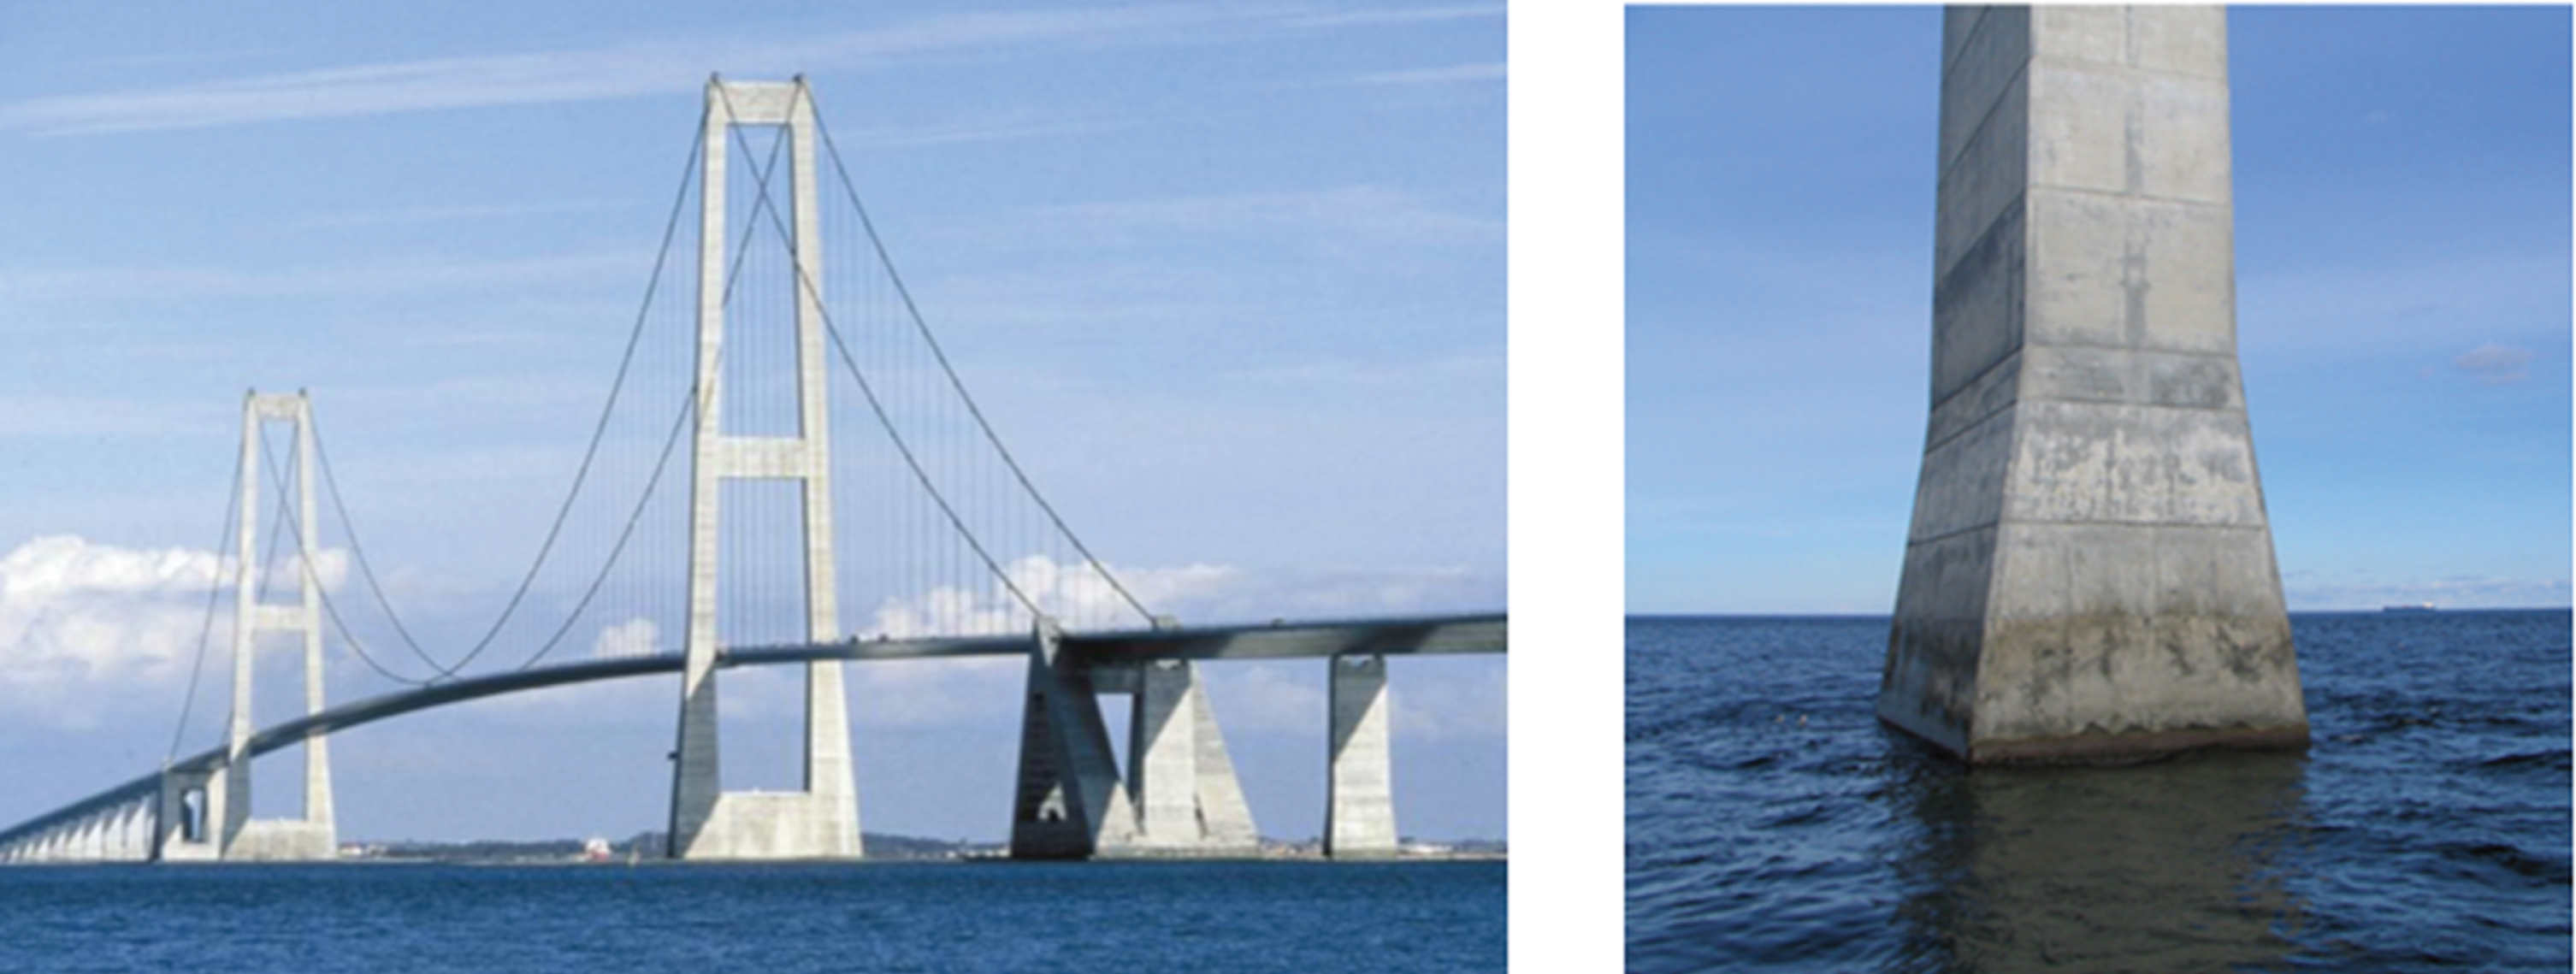
13.2Service life of bridge pier, Great Belt Link, Denmark
The East Bridge of the Great Belt Link project was finished in 1991, Fig. 26. In 1998 and again in 2005, chloride ion content profiles were obtained from various locations to evaluate the service life on the pier, D1 being in the splash zone.
Fig. 26
The Great Belt Link's suspension bridge and one of its piers selected for testing for service life. The pier was constructed using plywood form kept on for 2-3 days before stripping. LOK-TEST performed met the requirements.
Based on a cover layer thickness of 75 mm and a threshold chloride ion content concentration of 0.10 % by concrete weight, the estimated time for the initiation of chloride-induced corrosion at different elevations of the bridge piers was calculated using a simplified model of diffusion theory [40, 41], see Figs. 27 and 28.
Fig. 27
Chloride profiles obtained in 1998 at different locations on the pier.
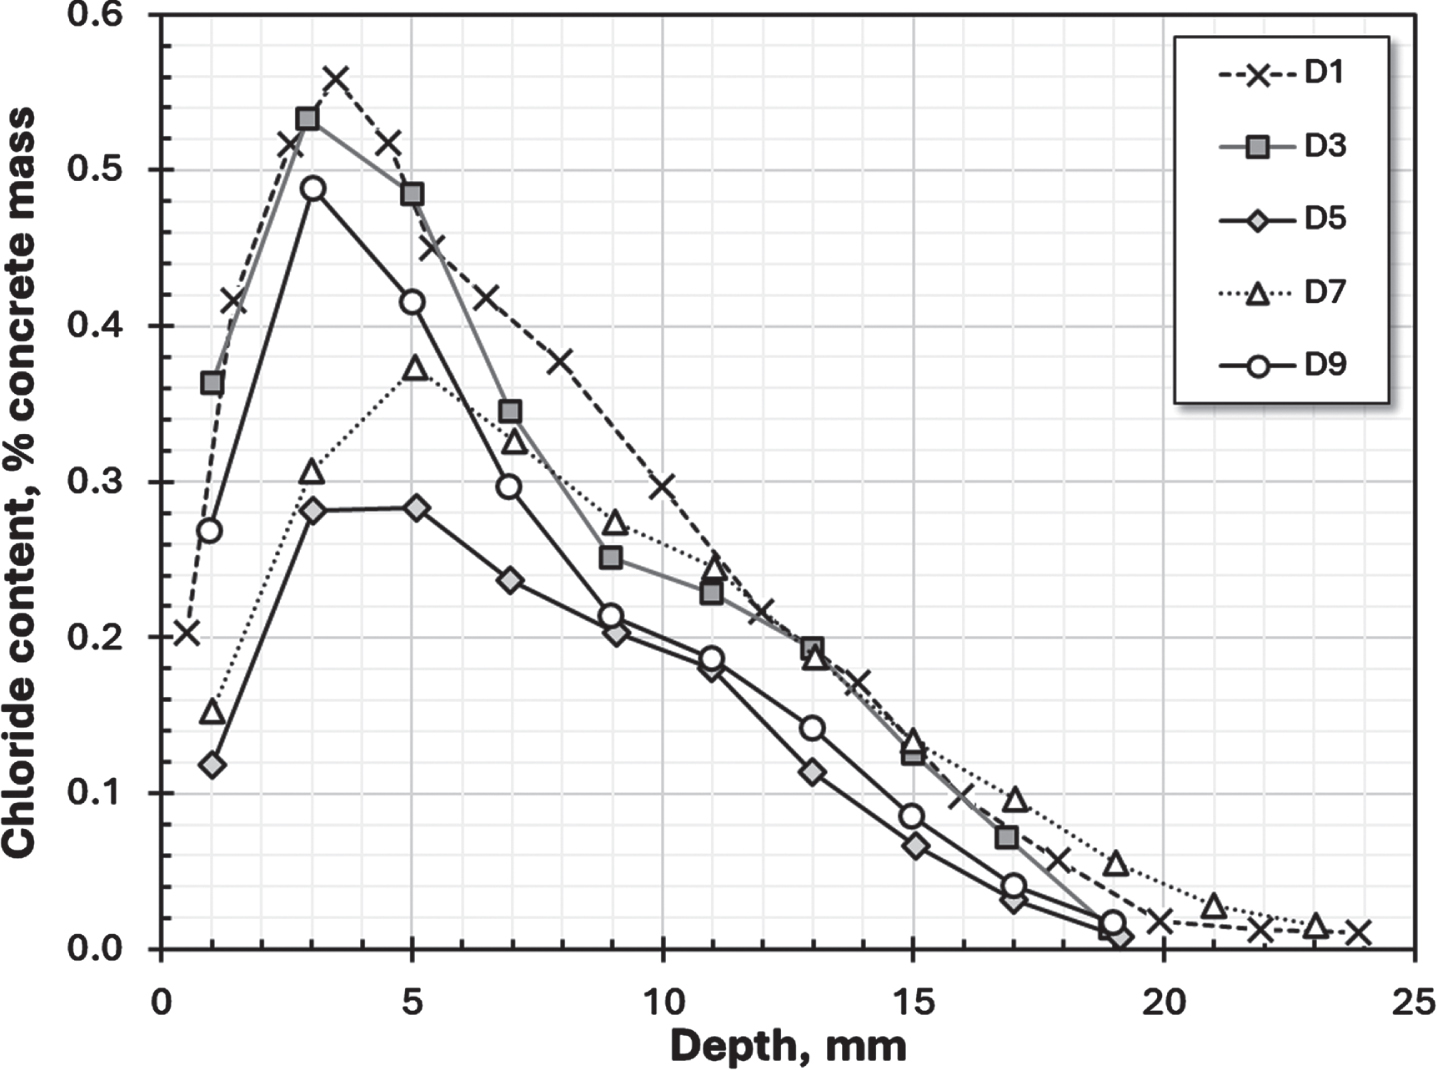
Fig. 28
Repeated measurements made in 2005 compared to the 1998 data for the pier in the splash zone.
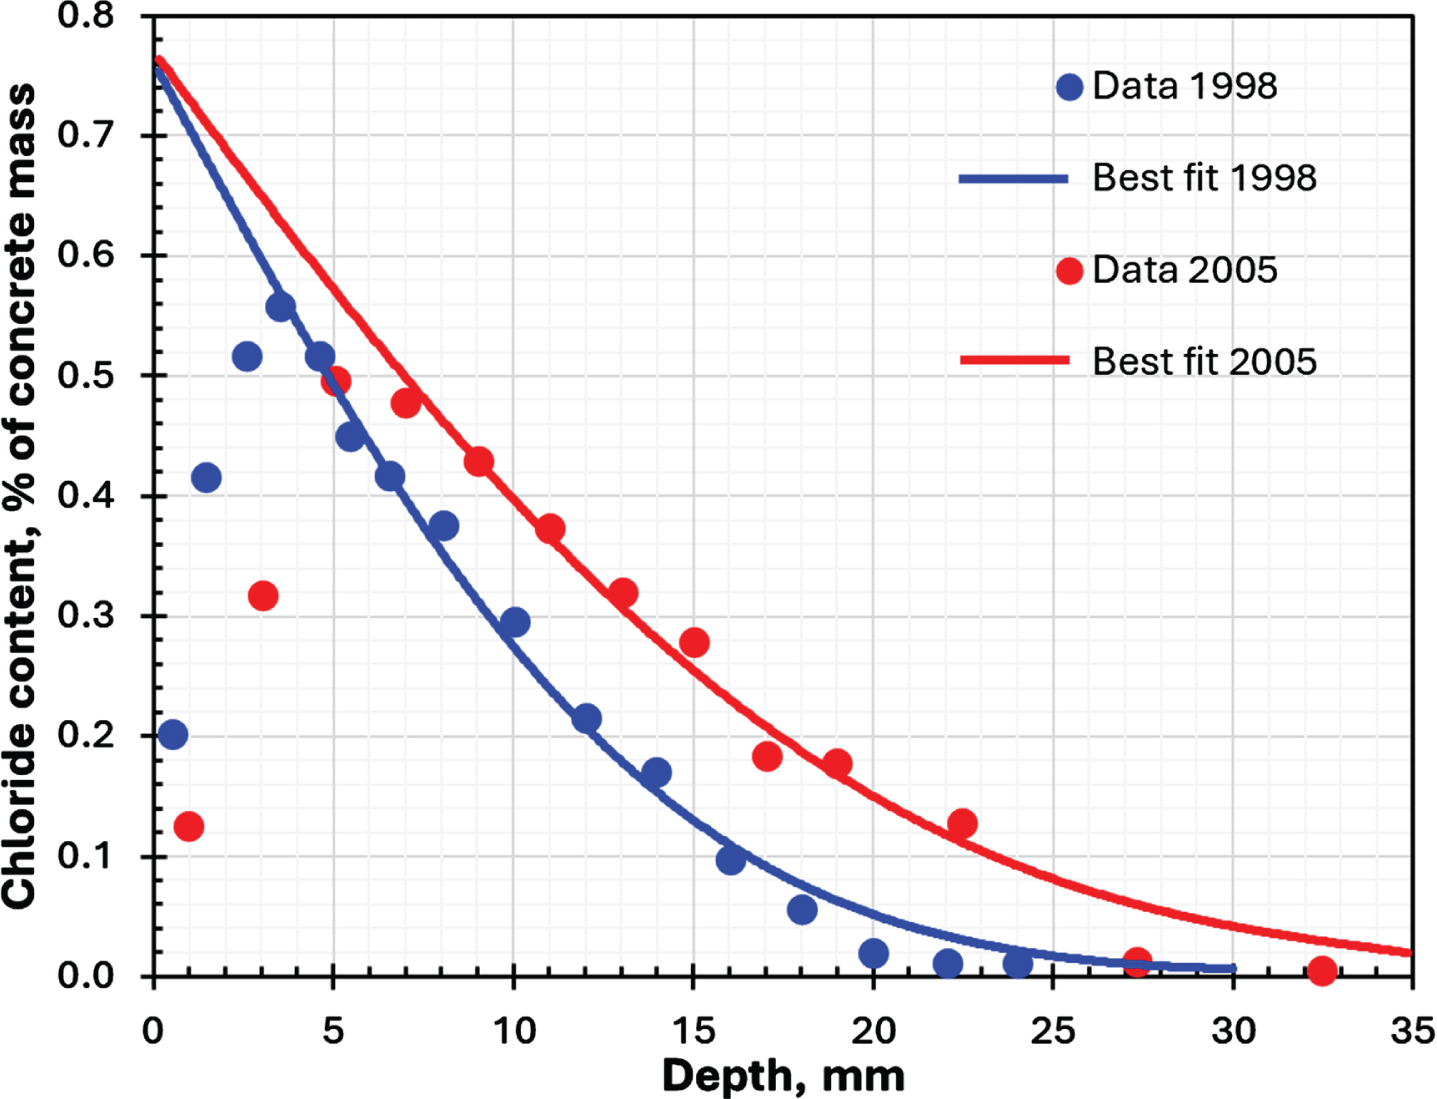
The final result of these calculations, in relation to remaining service life, is shown in Fig. 29 based on a simplified model using Fick's Second Law of diffusion.
Fig. 29
Service life in years calculated at different levels on the pier.
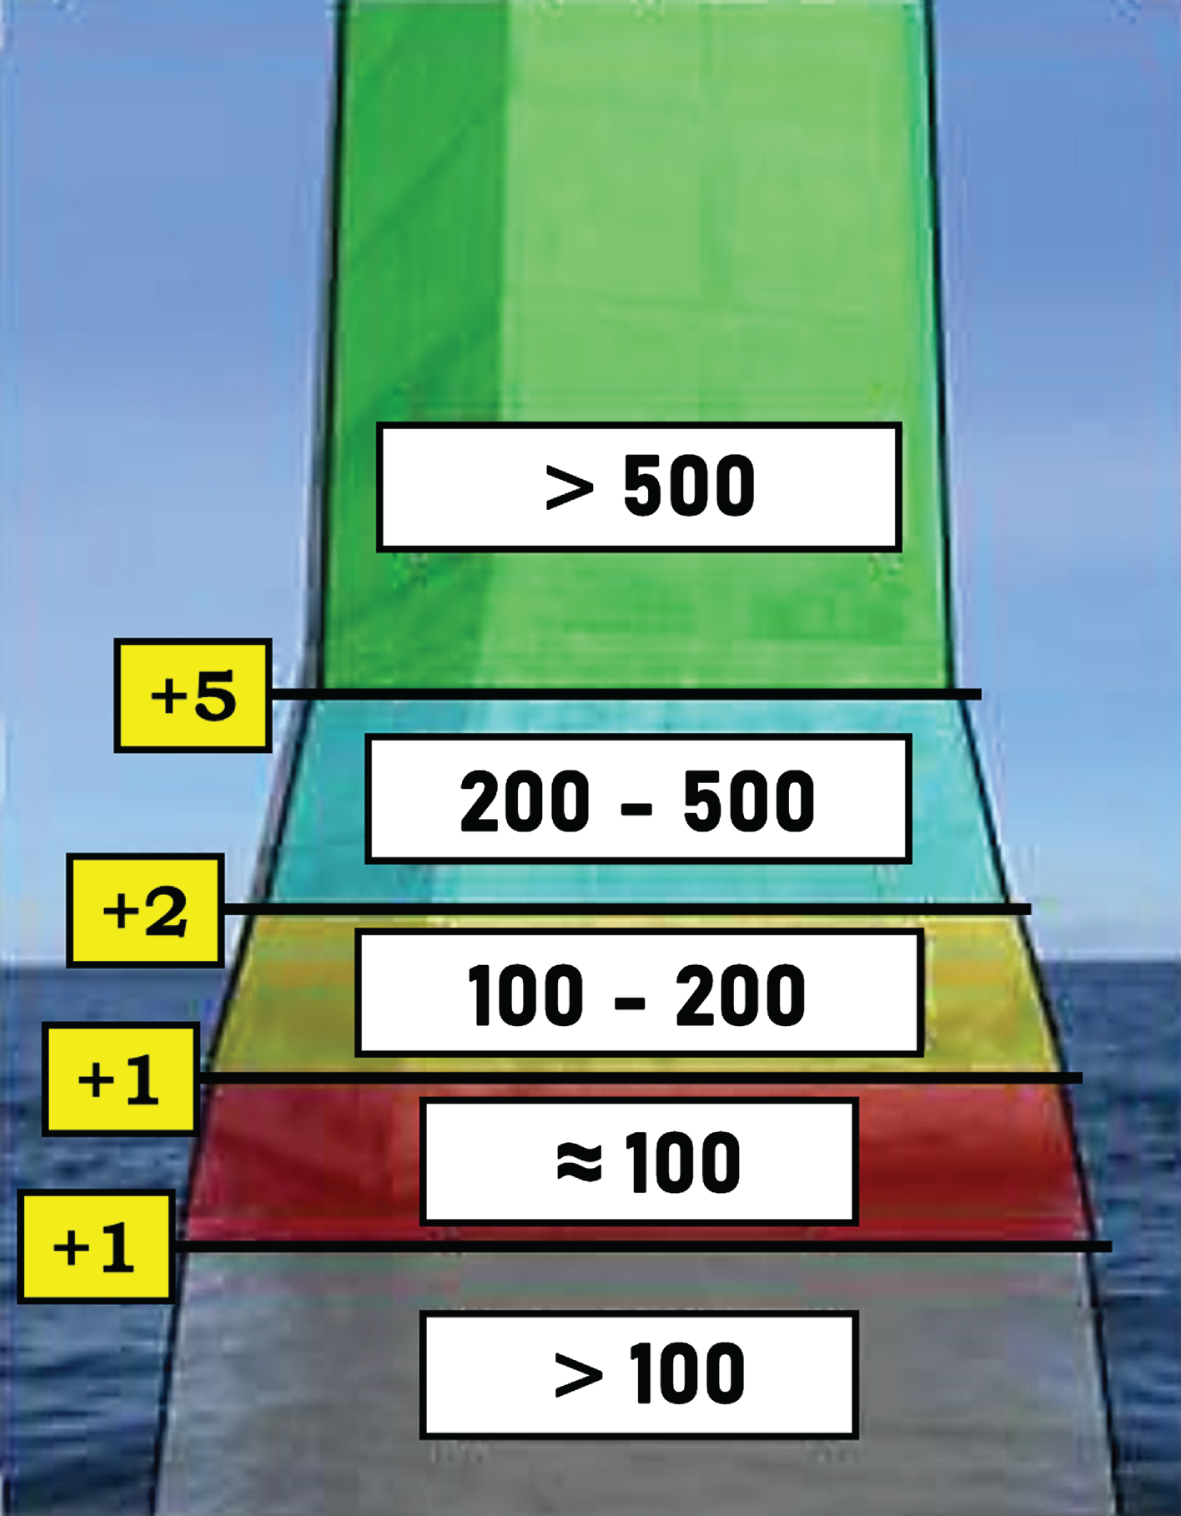
In the splash zone the estimated remaining service life is about 100 years, as required by the specifiers of the high-performance concrete (Professor Ervin Poulsen, DTU, Denmark. [38, 40]):
The very long service life (>500 years) above elevation +5 is attributed to the lower moisture content compared with the splash zone at elevation –1 to +1, where the concrete capillary pores are fully saturated.
The longer service life below sea level, compared with the splash zone, is attributed to the reduced oxygen content in submerged concrete.
13.3Curing of the cover layer evaluated by pullout and conductivity
Statement by Professor Ervin Poulsen, DTU, Denmark: ”The cover layer is the critical part of the structure in terms of durability, the interior only needs to be strong enough to withstand the forces applied”
For resistance to chlorides from, e.g., the sea or deicing salts, the cover layer is the “Peel of the Orange”, Fig. 30, protecting the reinforcement against corrosion. Similarly, with carbonation. This “PEEL” is the essential part of a new structure when it comes to durability, not the interior. To achieve a good, durable cover layer, the right mix has to be used, it has to be well compacted, have a sufficient thickness, and be well cured, Optimal curing is providing water or keeping the formwork in place during hydration (PCA recommendation is 7 days with formwork on), alternatively, using internal curing with LW fine aggregates or water-absorbent polymers, while less efficient curing is achieved if curing compounds or plastic sheets are applied.
Fig. 30
The cover layer is the “peel” of the orange.

No curing has significant detrimental effects, as does exposure to high temperature and wind (mis-curing). Early Danish research in 1969 at DTU showed a 31% reduction in LOK-TEST pullout strength for a w/c-ratio of 0.36, and 40% for a w/c-ratio of 0.50 when concrete is mis-cured compared to water curing at 20°C. But how about the resistance to chlorides?
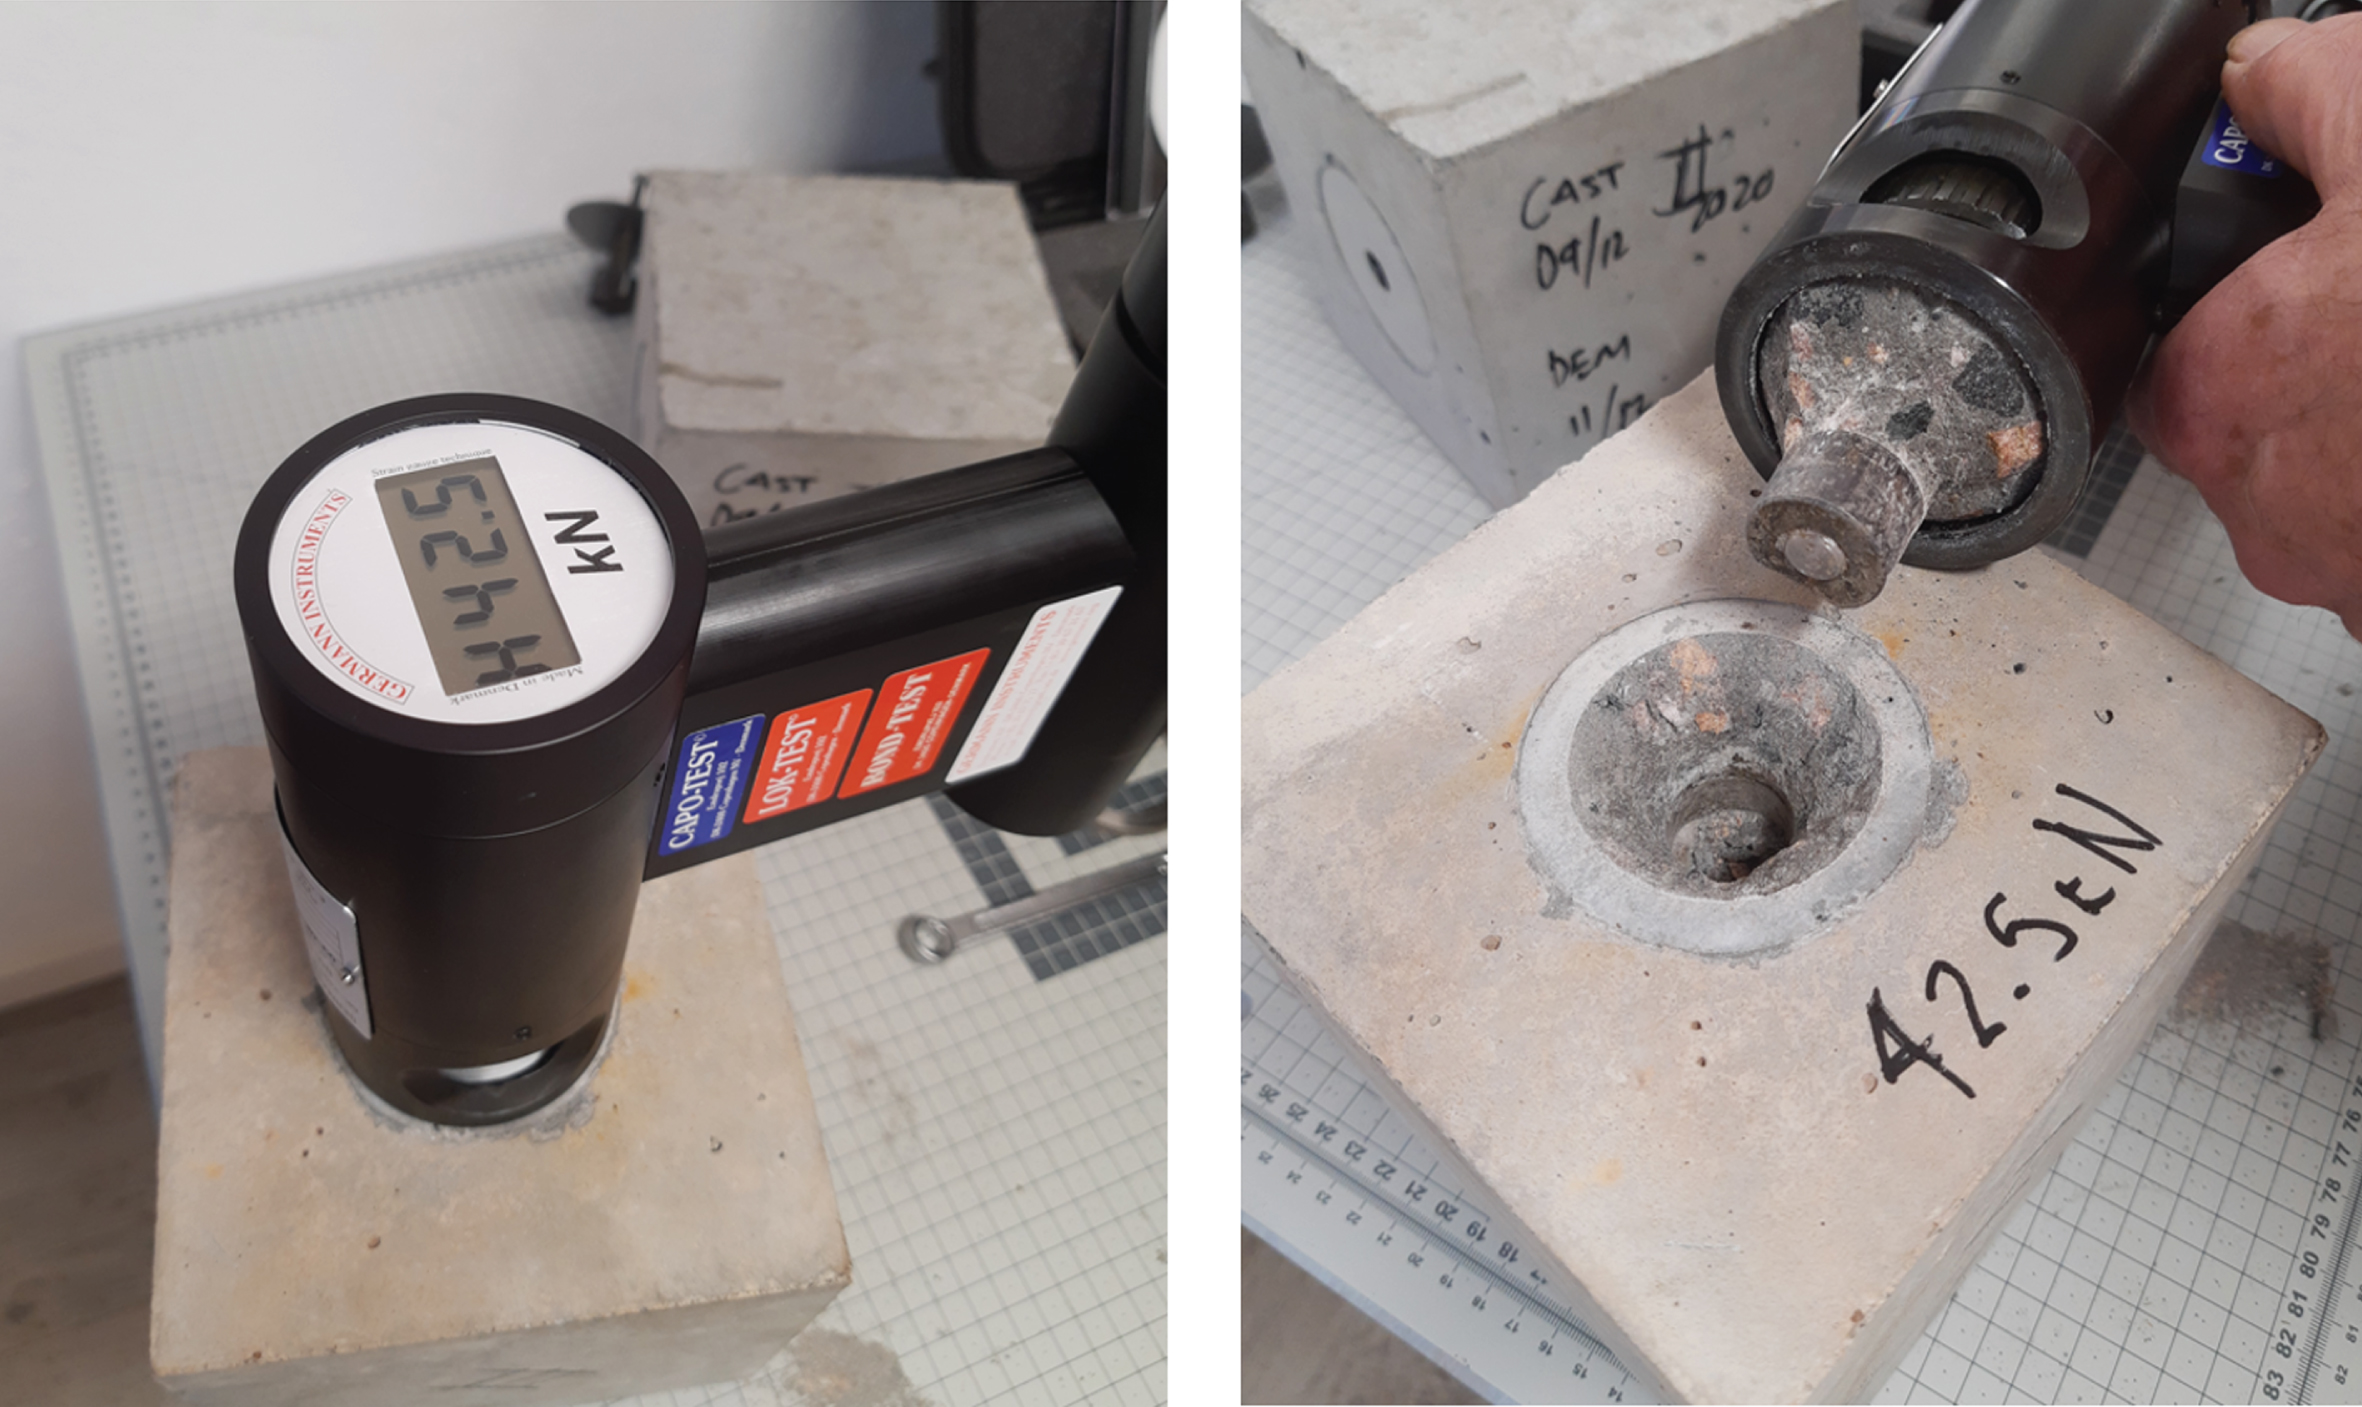
A recent comparison between LOK-TEST pullout strength and bulk conductivity was performed for estimating the chloride diffusivity and service life for wet-cured concrete and air-cured, for simplicity.
The concrete used was a high-performance C40/C50 class concrete (f’c 40 MPa on cylinders, 50 MPa on cubes), tested after 56 days.
The two standards applied were:
ASTM C900-19: “Standard Test Method for Pullout Strength of Hardened Concrete” [47]. (LOK-TEST, Fig. 31) and
Fig. 31
LOK-TEST pullout.
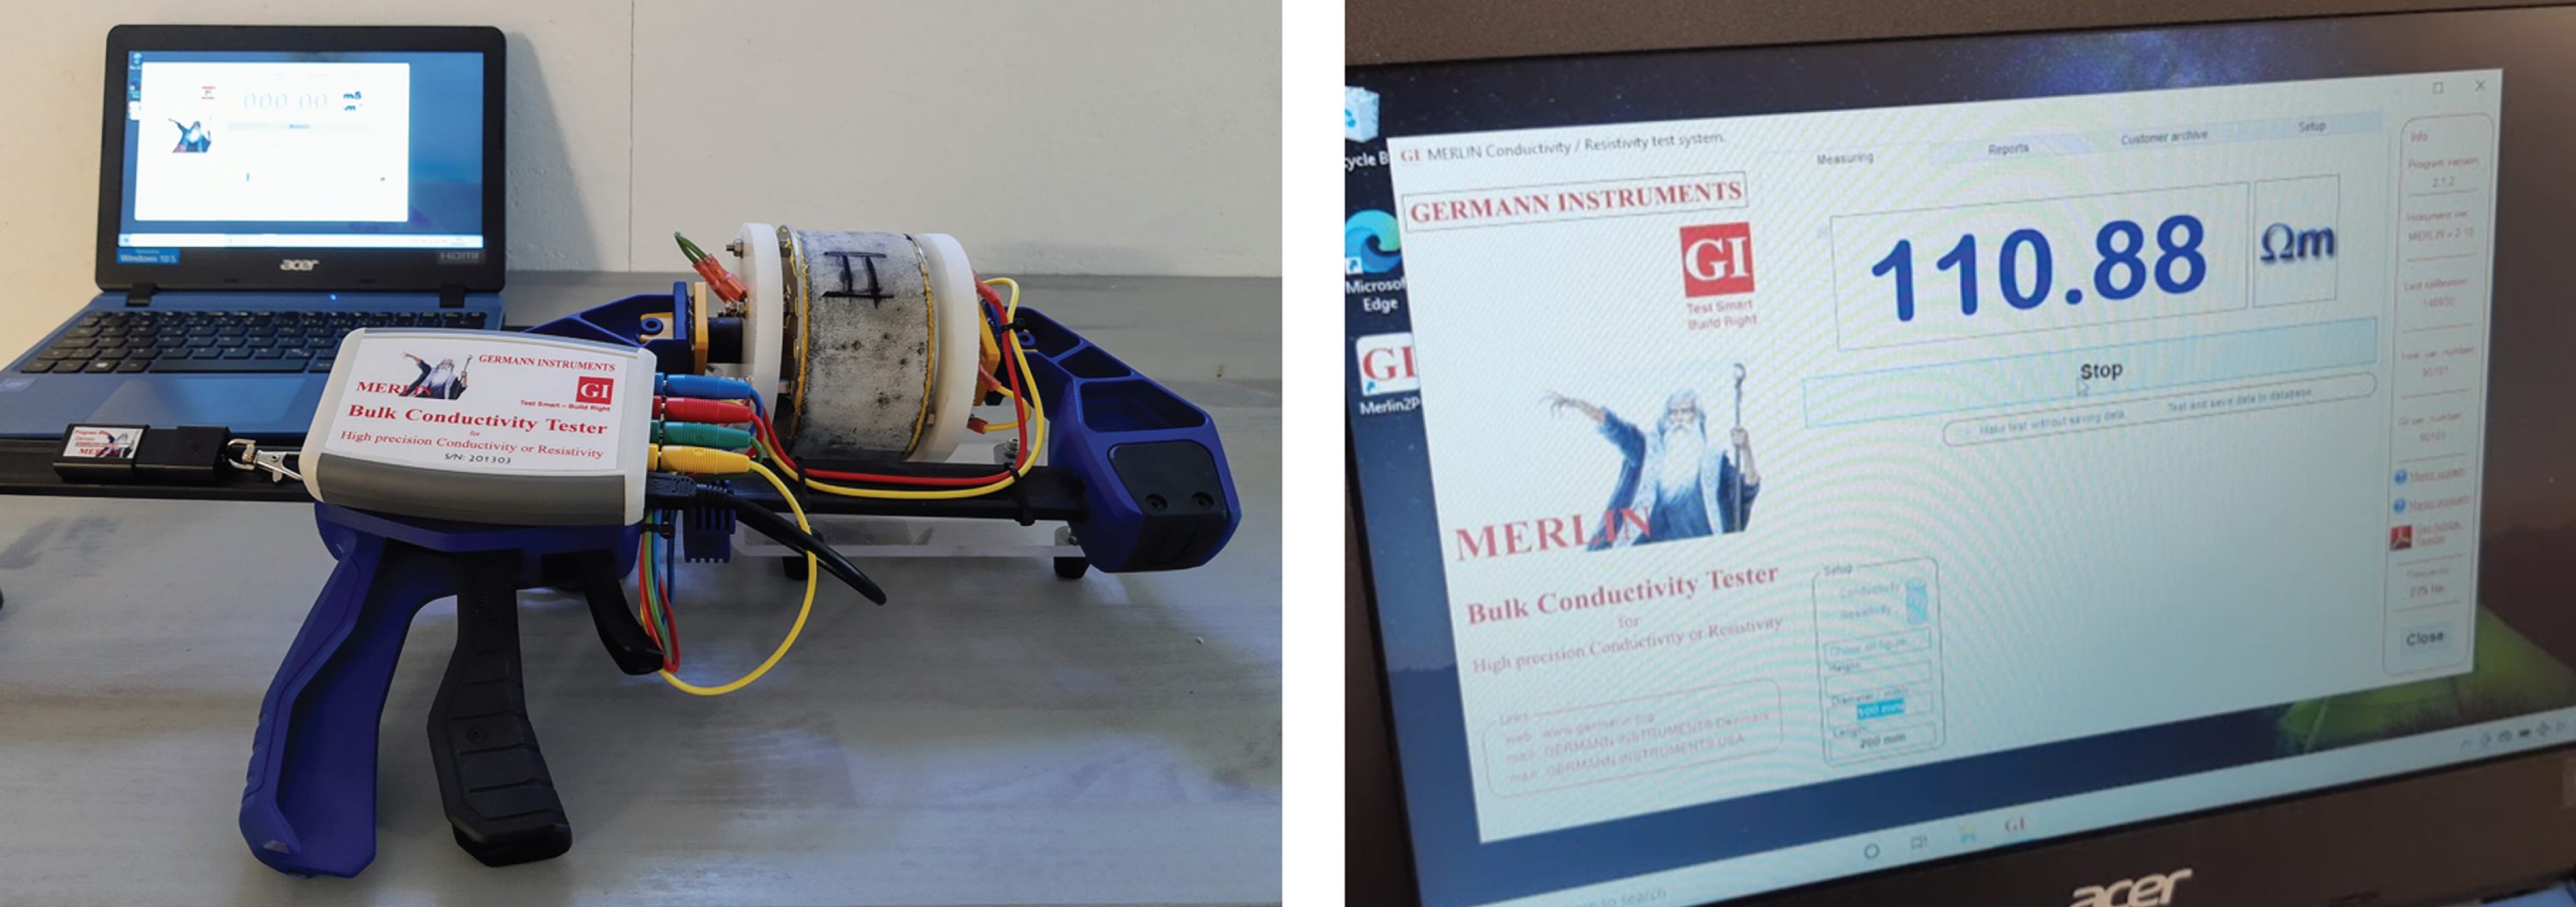
ASTM C1876-19: “Standard Test Method for Bulk Electrical Resistivity or Bulk Conductivity of Concrete” [50], (MERLIN device, Fig. 32), performed on slices of cores, estimating the chloride diffusion coefficient and the service life, defined here as the estimated time it takes to build up a critical chloride content at the depth of the steel reinforcement.
Fig. 32
MERLIN conductivity.
The LOK-TEST showed a 23% compressive strength reduction, Table 5.
Table 5
Results of pullout and resistivity
| Curing | LOK-TEST | Resistivity |
| Wet cured | 42.7 kN | 166Ω·m |
| Air cured | 33.0 kN | 111Ω·m |
The bulk resistivity testing with the MERLIN device on the 50 mm cover layer resulted in 166Ω·m for wet curing and 111Ω·m for air curing, which represents a 33% reduction. With simplified assumptions, these resistivity values can be transformed to a chloride diffusion coefficient, Da, using the Nernst-Einstein relation. This way, wet curing would correspond to a chloride diffusion coefficient of 27.2 mm2/y and air curing to 41.5 mm2/y.
By means of the Life 365TM Software (free available at www.life-365.org), based on Fick’s second law of diffusion, the expected service life in years, t, can then be estimated for a given cover layer and exposure condition.
For a 50 mm cover layer and seawater splash exposure condition, the estimation shows a 40% reduction of the service life regardless of the critical limit for corrosion of the reinforcement is considered to be 0.050% Cl– or 0.100% Cl– by concrete mass (Table 6 and Fig. 33. For mis-cured concrete (wind and higher temperature), the reduction would be even larger.
Table 6
Estimated service life
| Critical chloride level | Wet curing | Air curing |
| 0.05 % Cl–/mass | 66 years | 37 years |
| 0.1 % Cl–/mass | 92 years | 56 years |
Fig. 33
Chloride ingress, wet and air cured concrete specimens.
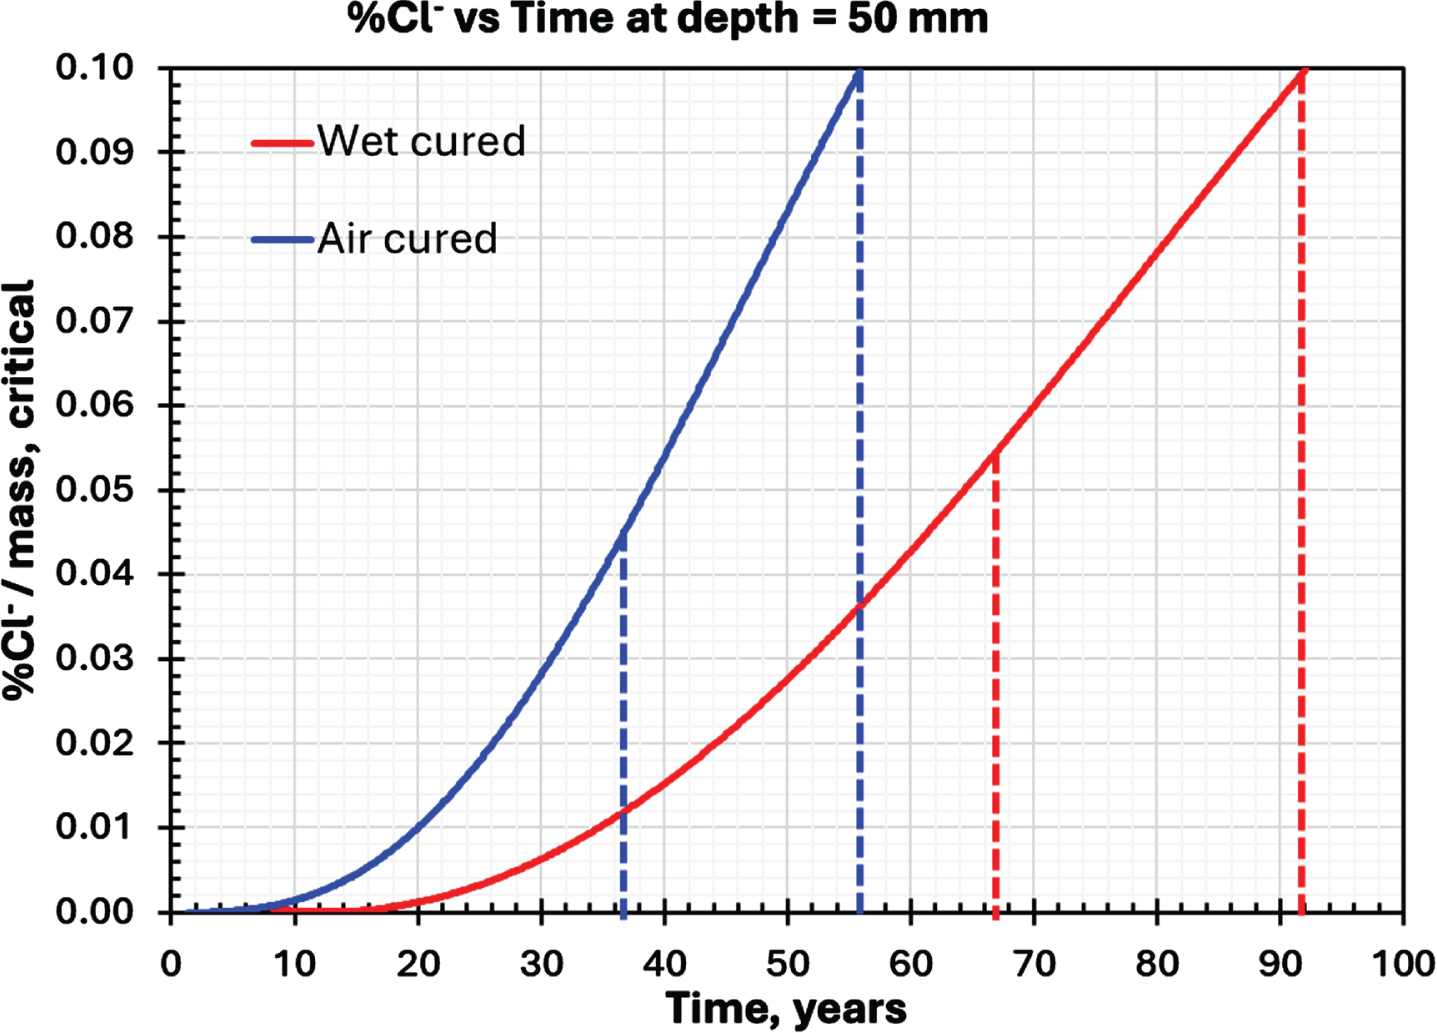
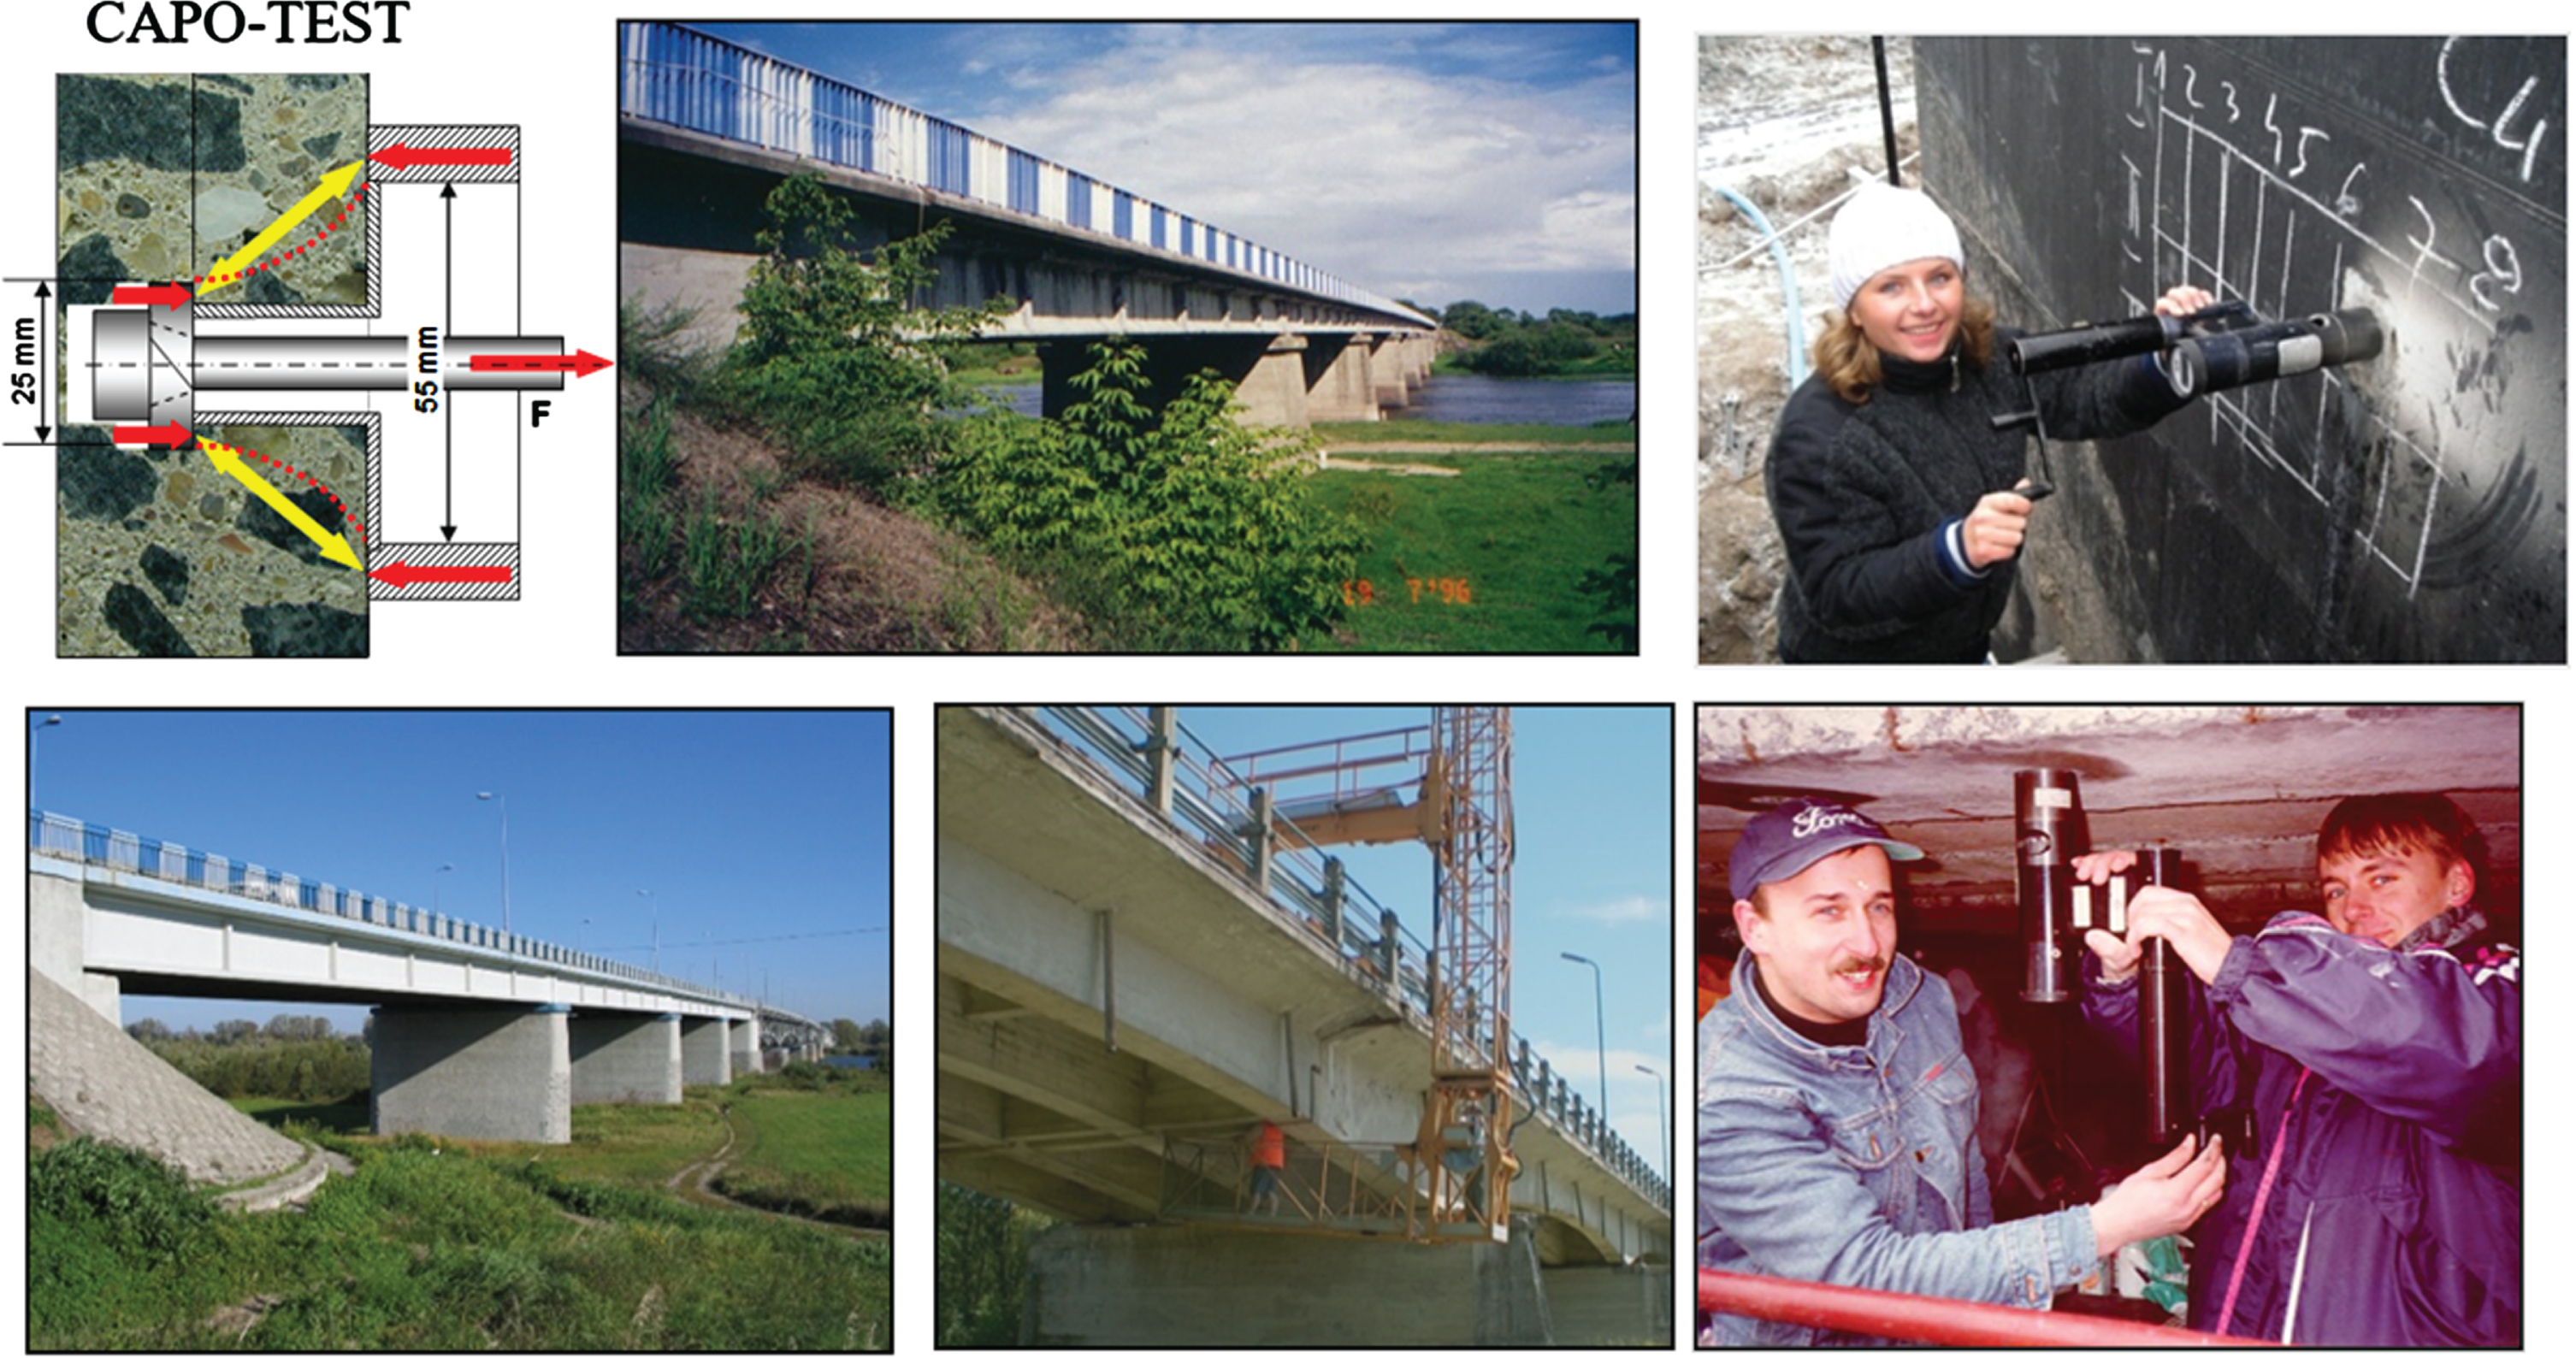
Fig. 34
Examples of Polish bridges tested for upgrading –higher loading–shown with CAPO-TEST.
In this manner, a quick on-site strength test, the LOK-TEST or the CAPO-TEST, will immediately indicate the cover layer quality when compared to lab cylinders.
If lower than expected, cores may be drilled out from the cover layer, sliced and water-saturated for further testing with the MERLIN for bulk resistivity (or its inverse, conductivity) and estimating the remaining service life in a chloride environment.
13.4Strength testing with CAPO-TEST for further loading of old bridges in Poland
As part of strength testing of 50 old bridges to be upgraded for increased loading from army tanks, fifteen bridges, ranging in age from 25 to 52 years, were investigated initially, establishing first a correlation curve between 100 mm×100 mm cores and the CAPO-TEST (ASTM C-900 and EN 12504-3), with a special focus on the effect on carbonation. The depth of carbonation varied from 2 mm to 35 mm on the bridges. The strength of the bridges ranged from 20 MPa to 50 MPa.
The number of 100 mm×100 mm cores and CAPO-TEST's for each bridge are reported in the referenced ACI publication [18]. The average values are plotted in Fig. 35.
Fig. 35
The correlation obtained from the Polish bridges.
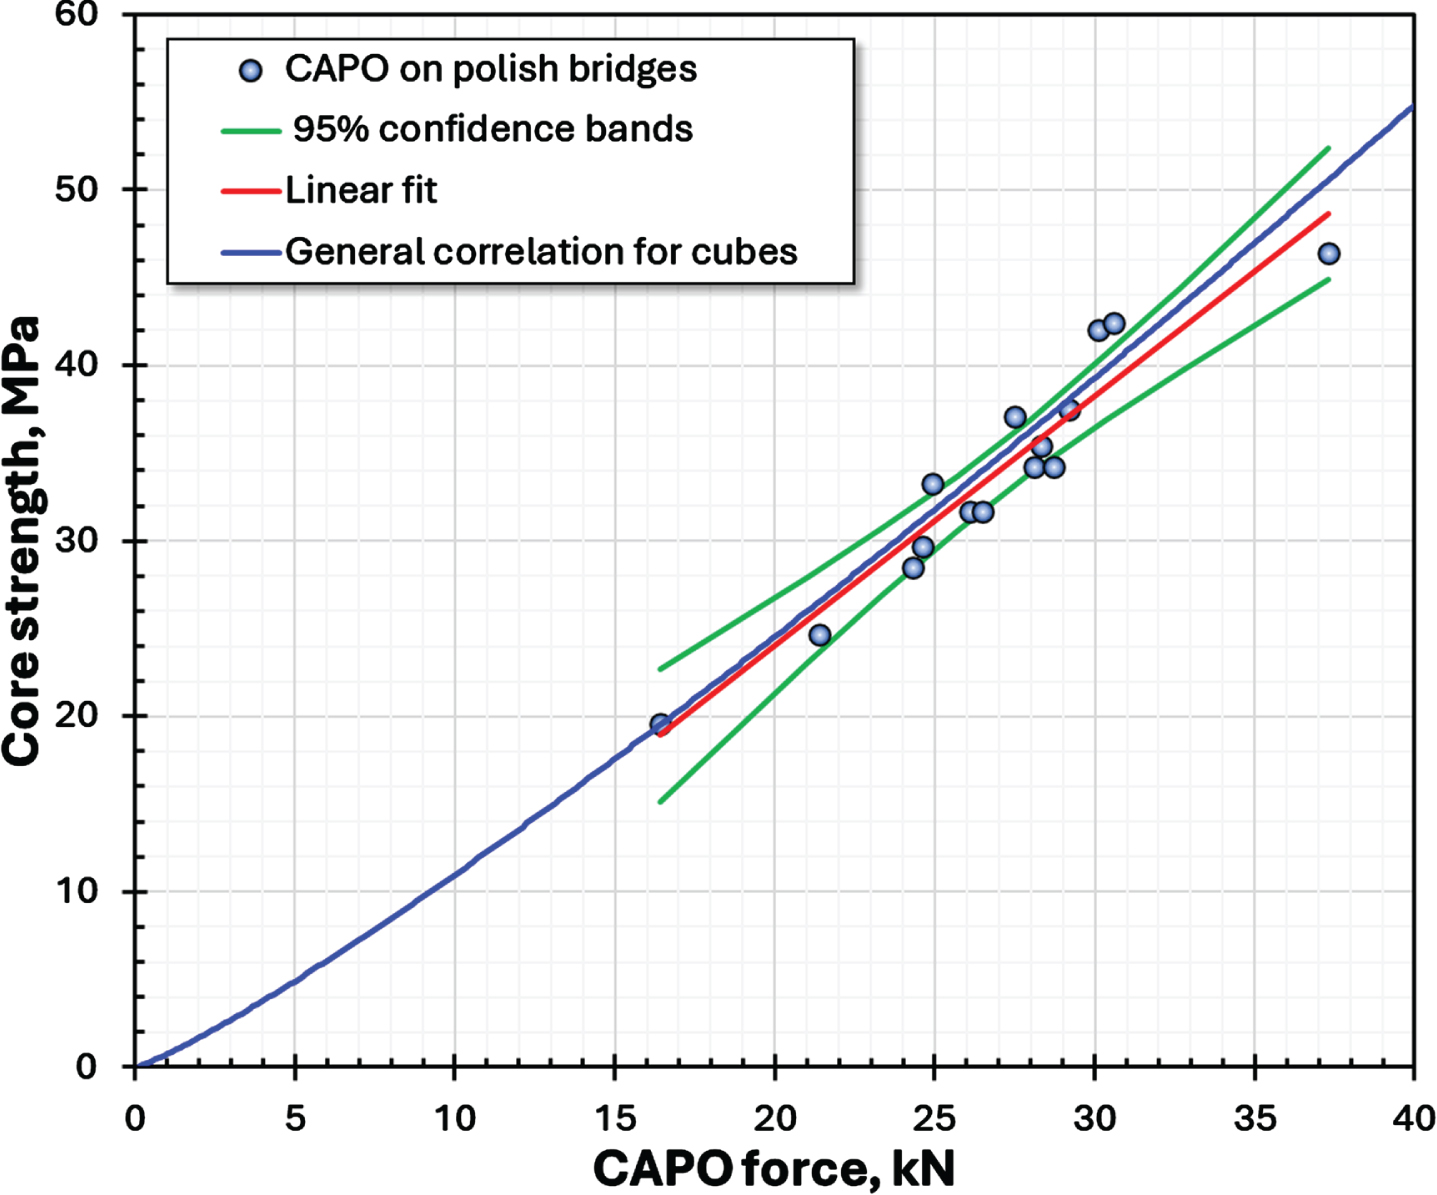
As will be seen the best-fit curve (purple) matches the robust general correlation for cubes (red): fcube = 0.76 F1.16 with a COV on the cores of 7.4% and 8.8% on the CAPO-TEST, on average.
Most interestingly, the effect of carbonation is only minimal on the CAPO-TEST and there is no correlation between the depth of carbonation and the relative error of the estimate based on the CAPO-TEST, [18].
Schmidt Rebound Hammer testing was also performed. The estimated strength from this test showed about 80% higher strength than cores using the correlation recommended by the manufacturer of the Schmidt Hammer.
Subsequently, testing of the remaining bridges was performed by CAPO-TEST.
Another example of testing with CAPO-TEST before additional loading is given in ref. [39] from Houston, USA
13.5In-Situ compressive strength testing of quarantined precast concrete tunnel lining segments using CAPO-TEST, UK
Tunnel elements were produced at the Translink Joint Venture, on the Isle of Grain, UK, and hardened in a heating tunnel on a moving conveyer belt. For strength estimation, cubes were placed alongside. The production took place in large numbers, automatically. The cube strength, after heating, was specified to be 60 MPa. During a period, the cube strength dropped, but production continued until the drop was realized.
All the elements produced in that period were quarantined. Scrutinizing the reason for the drop, it was established that the reason was a change in the cement used in the mix; the gypsum component in the cement had been changed.
To test the final strength of the quarantined elements, two systems were selected as candidates, coring or CAPO-TEST. Testing with cores was too time-consuming, uncertain, and costly, and considered to cause too much destruction. CAPO-TEST was selected, also due to the minimal damage by which the element tested could be used.
A calibration program was conducted in relation to cube strength ranging from 35 MPa to 100 MPa, partly between production cured cubes and CAPO-TEST, and partly between standard cured cubes and CAPO-TEST (Fig. 36). Testing was made in relation to maturity at 4, 7, 28, 154 and 329 actual days.
Fig. 36
The correlation obtained between CAPO-TEST and standard cubes, and CAPO-Testing in progress on the elements.
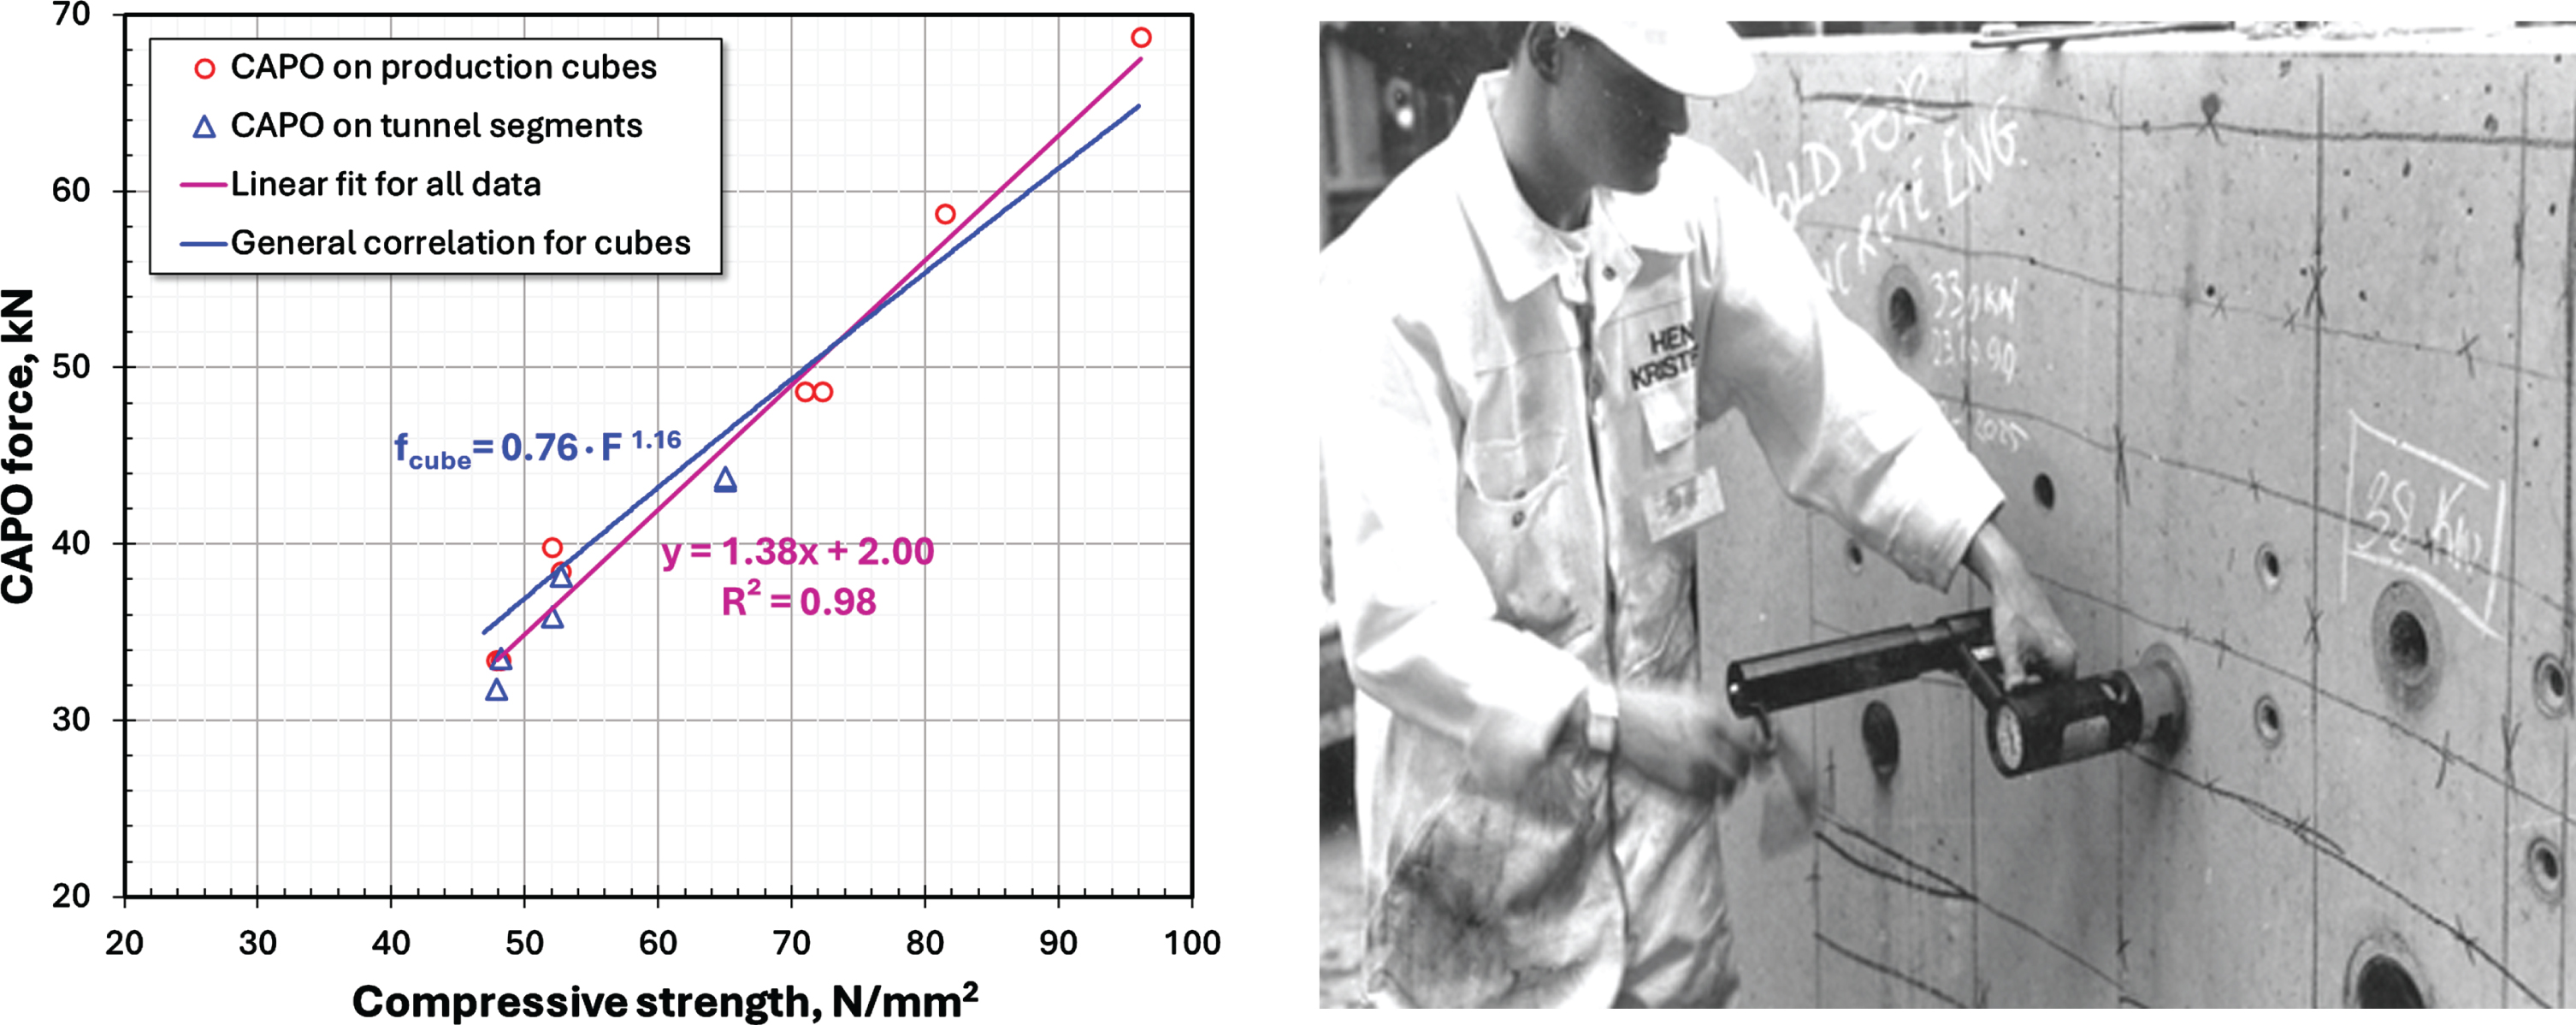
The correlation obtained (blue line), Fig. 36, matched perfectly the general one between CAPO-TEST and cube strength (red) and was used for evaluation of the in-situ strength.
All the quarantined elements older than 150 days were accepted for erection in the tunnel, as the strength with CAPO-TEST related to cube strength showed strength over 60 MPa from 150 days and onwards.
Variation in the CAPO-TEST was on average 9.6%, ranging from 7.9% to 11.5% for all the elements. Testing on each element lasted about 1 hour for each set of 3 CAPO-TEST
13.6Safe and early loading with LOK-TEST, Canada
Not only for accelerating construction schedules but also for safety, the LOK-TEST pullout system is used extensively for testing the strength of slabs during construction on high-rise residential and office structures in Canada.
The test system is used in conjunction with optimized concrete mixes, by which a scheduled time of construction can be reduced, saving interest, costs on formworks, reshoring, winter heating, and earlier rental [22, 24, 28, 29].
In a 100 m3 slab pour, 10 to 15 LOK-TEST inserts are installed equally distributed on the bottom of the slab through prepared port holes in the flying form systems, Fig. 37.
Fig. 37
LOK-TEST being performed for safe and early form stripping in a high-rise building.
Inserts can also be installed as floating inserts on the top, but the bottom installation is preferred due to simplicity and speed.
Experience has shown that top installment of inserts produce about 10% lower strength compared to the bottom, due to better compaction and curing at the bottom, [25].
At the time of testing a couple of inserts are tested, and if meeting the expectations, the remaining inserts are tested. 10 inserts can be tested in about 1 hour. The LOK-TEST pullout forces are converted to equivalent cylinder strength in MPa by means of a pre-established relationship following the general, robust correlation.
The standard deviation is calculated, followed by the calculation of the “Minimum in-place strength” as: Average Strength less a k-factor times the Standard Deviation. The “k” factor relates to the 10% fractile of the T-distribution. If the “Minimum in-place strength” is higher than 75% of the f’c, stripping/reshoring takes place, otherwise, testing of remaining inserts is performed later, e.g., after another 6 hours, and the “Minimum in-place strength” is recalculated.
This procedure has been adhered to in numerous cases for safe and early loading of slabs in high rises. An example is shown in Fig. 38, the Scotia Plaza in Toronto, Canada, where earnings due to speeding up the construction schedule were reported to be 1.5 million dollars.
Fig. 38
Scotia Plaza, Toronto, Canada.
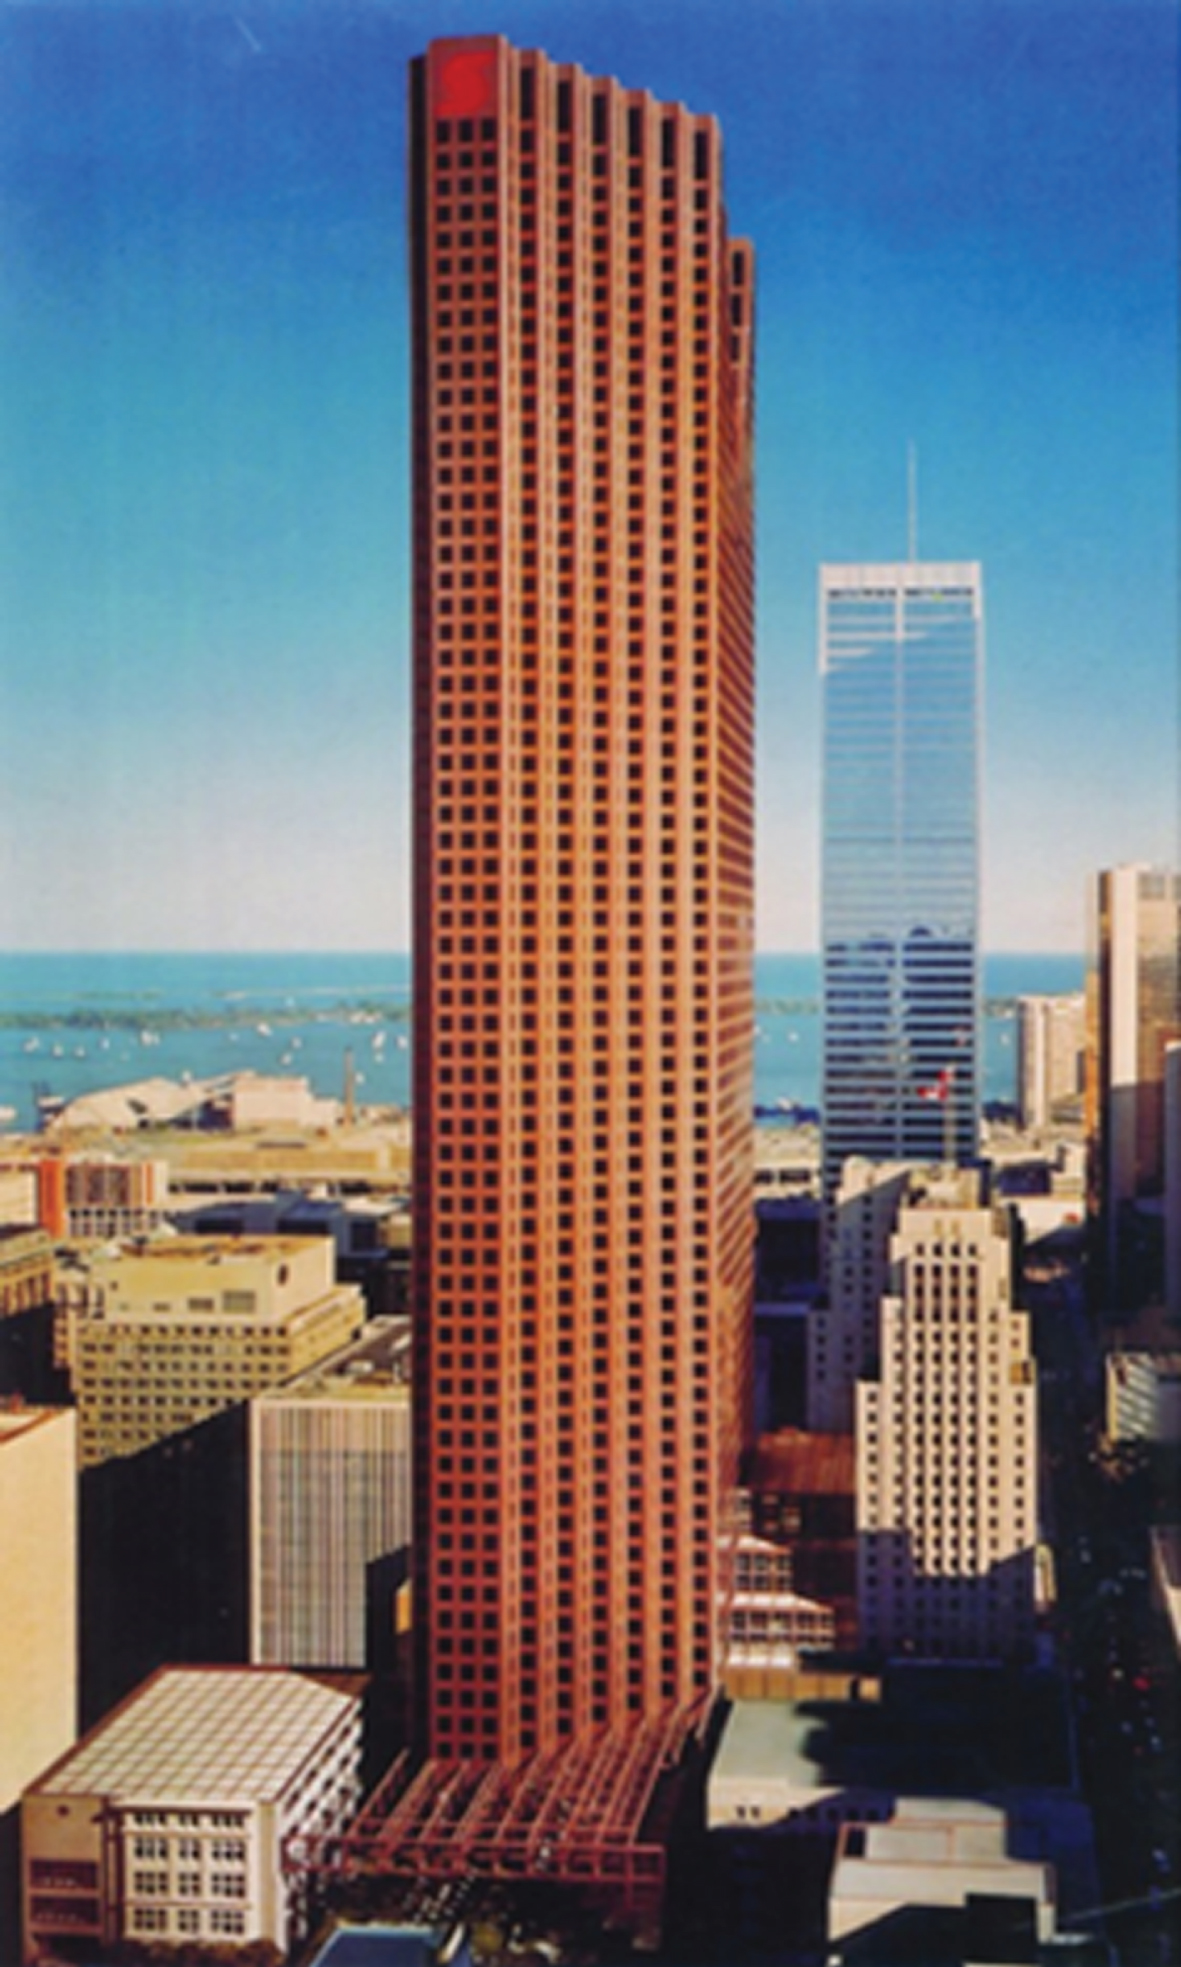
Optimized concrete mixes were used, allowing forms to be removed as quickly as after 1.5 actual days, even in cold winter conditions. On the other hand, in the substructure, strength is not needed that quickly. Here e.g., fly ash, slag cement, or other supplementary materials is used in the mix, reducing the costs of the concrete mix.
Full descriptions, including documented correlations, variability, and reports from 18 projects are referenced in [22–26].
On projects as reported in Trinity Square [27], the building officials allowed the elimination of the usual mandatory standard cylinder tests, only relying on Lok-Test for in-place strength.
The Canadian Standard CSA-A23.2-15C [48] outlines the procedure for performing the LOK-TEST properly, including testing deeper in the structure, if needed.
14Conclusions
Pullout testing is a physical test, like compression testing of standard cylinders, standard cubes or cores. In pullout, the compression and crushing of the concrete happens in the “Strut” between the cast-in disc (LOK-TEST) or the expanded ring in a recess (CAPO-TEST) and the counterpressure on the testing surface.
Robust correlations between pullout force and standard cylinders, or standard cubes/cores exist and can be used with great confidence without further correlations involving traditional laboratory testing for all normal concrete mixes (maximum nominal aggregate size 40 mm).
The precision of pullout testing is at a 95% confidence level 2 MPa for an average of 2 tests in the testing range to 80 MPa and 1.5 MPa for an average of 4 tests. Accuracy can be taken from correlation data from the 1970, Fig. 19 with its established confidence limits.
In [38] statistics are detailed for production testing in relation to the number of batches in a placement and the coefficient of variation.
In this manner, only the hydraulic pull-machine with accessories needs to be brought along to the site for testing the structure avoiding bundles of lab specimens. This obviates the need for traditional laboratory testing equipment, cases as reported in [27, 29] or on remote sites where the lab compression machine was too troublesome to bring along. Examples are from the construction of the harbor piers at the island Tristan da Cunha in the Atlantic Ocean, and the construction at the Federal Research Base 6 hours flight north of Montreal, resulting in reduced casting time from 14 days to 7 days and with considerable savings [29].
If needed, for potential strength assessment 200 mm cubes, with inserts installed centrally in the vertical faces, can be cast, compacted, water cured, and tested at specific time intervals and using the general correlations for transforming the pullout forces to MPa’s of cylinders or cubes, eliminating the need of the traditional compression machine in the laboratory.
LOK-TEST, (US patent 3541845), is the most simple and quick test system for strength in-place, only requiring planning and installments of inserts in a statistically valid manner in critical areas, on new structures. Loading may take place to a required level, and if no failure occur the LOK-TEST is a truly Non-Destructive test. Performed to the peak-load there is only little visible damage to the surface. If the pull-out cone is dislodged, the surface has to be patched. In such cases the test is semi-destructive.
If more pullouts are needed during testing CAPO-TEST can be used. This test is semi-destructive.
CAPO-TEST has proven to be a useful inspection tool in condition evaluation of old structures, not at least when the reinforcement is densely installed and cutting of reinforcement (for example on highly loaded columns) has to be avoided. Also, on slim columns where coring can weaken the column, CAPO-TEST has been preferred. CAPO-TEST is excellent for strength testing of shotcrete.
Pullout testing can for durability be an efficient indicator of the cover layers’ quality followed by conductivity measurements of sliced cores for service life estimation, if insufficient.
CAPO-TEST can substitute cores, they are quicker, (15–20 minutes per test for a trained technician), give immediate reliable results, unaffected by moist, more economical, cause less intrusion, and eliminate the factors affecting the core (e.g. core size, L/D, moist, coring direction and end preparation).
Both tests are 25 mm deep. Lower pull-forces will be exhibited for bad surface layers. To scrutinize such conditions deeper embedment of the LOK-TEST inserts may be planned, and for CAPO-TEST the starting testing surface may be positioned deeper by the initial surface grinding.
References
[1] | ACI 228.1R-19. Report on Methods for Estimating In-Place Concrete Strength, Reported byACI Committees 228, American Concrete Institute, Jan 2019, ISBN: 1-64195-050-3. |
[2] | Krenchel H . Lok-strength testing of concrete, Report No. S/69, Structural Research Laboratory, Danish Technical University, DTU, 1970 and 1974. |
[3] | Kierkegaard-Hansen P . Lok-Strength, Nordisk Betong, No. 3, 1975. |
[4] | Kierkegaard-Hansen P , Bickley JA . In-situ strength evaluation of concrete by the LOK-TEST system, ACI Fall Convention, Nov. 3rd, 1978. |
[5] | Kierkegaard-Hansen , LOK-TEST until today, Danish Engineering Academy (DIAB), Copenhagen, Denmark, Oct. 1978. |
[6] | Petersen CG . CAPO-TEST, Nordisk Betong, No. 5-6, 1980. |
[7] | Petersen CG . Development of the CAPO-TEST Strength testing at the Hestetorvet slab, Roskilde, Denmark,NDTitan case EC-1, 1975. |
[8] | Jensen BC , Bræstrup MW . Lok-Test determine the compressive strength of concrete, Nordisk Betong, No. 2, 1976. |
[9] | Ottosen NS . Nonlinear finite element analysis of pull-out test. Journal of the Structural Division, ASCE (1981) ;107: (ST4). |
[10] | Krenchel H , Shah SP . Fracture analysis of the pullout test. Dept. of Structural Engineering, Technical University of Denmark, RILEM, Materials and Structures, Dunod, Nov–Dec. 1985 no 108. |
[11] | Krenchel H , Mossing P . LOK-Styrkeprøvning af Beton, Brudmekanisk Analyse. Department of Structural Engineering, Technical University of Denmark, Serie R, No 198, 1985. |
[12] | Jensen JKrJ . Influence of stresses in a structure on the LOKTEST pullout force. Department of Building Technology and Structural Engineering. AUC, Denmark, 1987. |
[13] | Bellander U . Strength in concrete structures. Swedish Cement and Concrete Research institute, CBI Report Ra 1:78, Stockholm 1978, 15 pp. |
[14] | Bellander U . Kvalitetskontroll av Betonkonstruktioner. Nordisk Betong 3-4 198322. Krenchel, H. LOKStyrkepr00F8vning og CAPO-Styrkeprøvning af Betons Trykstyrke. Department of Structural Engineering, Technical University of Denmark, Serie I, No 71, 1982. |
[15] | Krenchel H , Petersen CG . In-Situ Pullout Testing with Lok-Test, Ten Years Experience. Int Conf on In-Situ/Non- Destructive Testing of Concrete. CANMET, ACI, Canadian Society of Civil Engineers and National Bureau of Standards, Canada, Oct, 1984. |
[16] | Petersen CG . Lok-Test and Capo-Test pullout testing, Twenty Years Experience. British Institute of Non- Destructive Testing in Civil Engineering Conference at Liverpool, April, 1997. |
[17] | Bishr HAM . Assessment of Concrete Strength by Lok and Capo Tests. Thesis, Faculty of the College of Graduate Studies, King Fahd University of Petroleum & Minerals, Dharan, Saudi Arabia, June, 1990, 214 pages. |
[18] | Moczko A , Carino NJ , Petersen CG . CAPO-TEST to Estimate Concrete Strength in Bridges. ACI Materials Journal. Nov. Dec. 2016, Technical Paper, title no. 113-M76. |
[19] | Petersen CG . Practical cases in the application of the pullout method (LOK-TEST and CAPO-TEST) for in-place compressive strength, Concrete Solution Conference 361, 0 (2022). |
[20] | Carino Nicholas J . PhD, Consultant. Chagrin Falls, OH, USA. In-Place StrengthWithout Testing Cores: The Pullout Test. 6th International Seminar on Advances in Cement & Concrete Technology for Sustainable Development, ACI, 2016. |
[21] | Krenchel H , Bickley JA . Pullout Testing of Concrete, Historical Background and Scientific Level Today. Nordic Concrete Research, The Nordic Concrete Federation, Publication No. 6, 1987. |
[22] | Bickley JA . Concrete optimization. Concrete International. . (1982) ;4: (6). |
[23] | Bickley JA . The evaluation and acceptance of concrete quality by in-place testing. SP 82-6, ACI, 1982. |
[24] | Bickley JA . Achieving safety and economy in high rise concrete structures through the use of in-place testing. Third International Conference on Tall Buildings, Chicago, USA, Jan. 1986. |
[25] | Bickley JA , Fasullo S . Analysis of Pull-Out test data from construction sites. TRB, Washington, USA, Jan. 1981. |
[26] | Bickley JA . The variability of pullout tests and in-place concrete strength. Concrete International. April 1982. |
[27] | Bickley JA . Trinity square: Commentary on concrete test date. Cement, Concrete, and Aggregate, CCAGDP. (1984) 6: (1):28–32. |
[28] | Bickley JA , Hindo KR . Howto build faster for less –The role of in-place testing in fast track construction. ACI, Spring Convention, San Francisco, USA, 1994. |
[29] | Bickley JA . A brief Historien of Pullout Testing: With particular reference to Canada,APersonal Journey. International Conference on Non-DestructiveTesting,ACI, Seville, Spain, Oct 2009. |
[30] | Bungey JH . Monitoring concrete early age strength development. non-destructive testing (Proc. 12th), Elsevier Science Publishers, The Netherlands, 1997. |
[31] | Bungey JA . Assessment of insitu concrete strength, overview of test procedures. Department of Civil Engineering, University of Liverpool, UK, 1998. |
[32] | Bungey JH JA . Strength development monitoring, case studies. Department of Civil Engineering, University of Liverpool, UK, 1999. |
[33] | Soutsos MN , Bungey JH , Long AE . In-situ strength assessment of concrete, The European Concrete Frame Building Project. Department of Civil Engineering, University of Liverpool, UK, 1999. |
[34] | Bungey JH , Soutsos MN . Reliability of partially destructive tests to assess the strength of concrete on site. Department of Civil Engineering, University of Liverpool, UK, 1999. |
[35] | BCA, BRE, Construct, Reinforced Concrete Counsil & DETR Early age strength assessment of concrete on site. Best Practice Guides for In-Situ Concrete Frame Buildings, J.H. Bungey, A.E. Long, M.N. Soutsos & G.D. Henderson, BRE Report 387, CRC Ltd, UK, 2000. |
[36] | Great Belt Link Concrete Technology. Edited by Niels J. Gimsing, Copenhagen, Denmark, 1999, A/S Storebæltsforbindelsen, ISBN 87-89366-92-3. |
[37] | Great Belt Link. West Bridge. Edited by Aksel G. Frandsen and Niels Gimsing, Copenhagen, Denmark, 1997, A/S Storebæltsforbindelsen, ISBN 87-89366-1. |
[38] | Petersen CG , Poulsen E . Pullout testing by Lok-Test and Capo-Test with particular reference to the in-place concrete of the Great Belt Link. Dansk Betoninstitut A/S, Birkerød, Denmark, 1991. |
[39] | Zhengqi Li , Desai J , Wesley B . In-place estimation of concrete compressive strength using postinstalled pullout test –A case study. Journal of Testing and Evaluation, ASTM, August 31, 2018. |
[40] | Poulsen E , Mejlbro L . Diffusion of Chlorides in Concrete, Theory and Application, Modern Concrete Technology Series, Taylor and Francis, 2006, ISBN13:9-78-0-419-25300-6. |
[41] | Petersen CG , Orozco HD . Service life evaluated by chloride profiling. XII International Conference on Structural Repair and Rehabilitation, 26–29th October, 2016, Porto, Portugal. |
[42] | Germann Instruments RCT, Instruction and Maintenance Manual. March 2023, Germann Instruments A/S, Emdrupvej 102, DK-2400 Copenhagen NV, Denmark. |
[43] | Germann Instruments Profile Grinder. March 2023, Germann Instruments A/S, Emdrupvej 102, DK-2400 Copenhagen NV, Denmark. |
[44] | Ministry of Transportation Method of test for determination of electrical resistivity of concrete. Test Method LS-444, Ontario, Canada. |
[45] | Carino Nicholas J ,PhD, Consultant. Chagrin Falls, OH, USA Core Testing. Obtaining and Testing Cores ASTM and ACI Approaches, presentation at the International NDT workshop, Athens, Greece, 2021. |
[46] | Petersen CG . CAPO-TEST pullout testing on Shotcrete, Procedure and On-Site Testing Examples. Germann Instruments, September 1st. 2023. |
[47] | ASTM C900 –19. Standard Test Method for Pullout Strength of Hardened Concrete. ASTM, Philadelphia, USA. |
[48] | Canadian Standard CSA A23.2-15C. Evaluation of concrete strength in place using the pullout test. 2014 CSA Group, Canada. |
[49] | EN 12504-3. Testing concrete in structures –Part 3; Determination of pull-out force. European Committee for Standardization, Brussels, Belgium. |
[50] | ASTM C1876-19. Standard Test Method For Bulk Electrical Resistivity or Bulk Conductivity of Concrete. ASTM, Philadelphia, USA. |
[51] | ASTM C42/C42M-18. Standard Test Method for Obtaining and Testing Drilled Cores and Sawed Beams of Concrete. ASTM, Philadelphia, USA. |


