
Innovative fatigue design of orthotropic steel decks
Abstract
Orthotropic steel decks (OSDs) consist of a complex network of stiffeners and the deck plate itself. Working as a whole, it takes part in the structural working of the overall bridge, which in its turn results in a lightweight and durable deck concept. Orthotropic steel decks are nevertheless very sensitive to fatigue damage, because of the large number of welded connections. Innovative research focuses on the application of fracture mechanics as well as the influence of residual stresses on the fatigue lifetime. An analysing tool using Linear Elastic Fracture Mechanics (LEFM) is proposed. Manufacturing processes such as welding cause residual stresses, which are present in most civil structures. Including these results in determining the fatigue life using LEFM leads to improved OSD lifetime. Overall, it can be stated that the OSD remains a valuable bridge concept, especially for larger span bridges, that can be understood better using modern research techniques.
1Introduction
Due to their contribution to the general resistance of the structure, by significantly reducing the total weight of the construction, orthotropic steel deck plates are one of the most commonly used deck systems for larger span bridges. This contribution also allows the design of tied arch bridges of a more moderate span but with an extremely low structural depth, e.g. a structural depth of only 1 m for a double track railway bridge with a length just over 110 m. The recent design practice in Belgium has used this advantage for about 13 arch bridges, most of them a part of the development of the European network of High Speed Lines where a considerable number of short to medium span bridges for the high-speed railway lines have been designed. Other applications include movable bridges crossing the lock doors of the Port of Antwerp, Belgium. However, orthotropic deck plates are also highly sensitive to fatigue damage, requiring an in-depth fatigue analysis, ensuring it fulfills all fatigue criterions. This problem is mainly caused by the many stress concentrations and the large amplitudes of stress variations, caused by road traffic in particular. Recent international research has extensively studied this phenomenon.
The complex stress field in an orthotropic road bridge can be attributed to three different actions working in union. The first of these actions is caused by the membrane stresses arising because of the bending of the lateral main girders of the bridge, with the bridge deck itself acting as their upper flanges. This action represents in fact the main action of the overall bridge concept. The orthogonal anisotropy (i.e. orthotropic behavior) of the deck with the distribution of the load working on the deck corresponding to the different rigidities of the ribs and the crossbeams is responsible for the second action existing in the deck plate. Finally, the local bending along longitudinal or transversal axis of the deck plate elements under direct wheel loading causes the third action existing in an orthotropic road bridge. The largest stress concentrations for this deck concept are found at the ribs where longitudinal stiffeners are connected to the deck plate and both hogging and sagging bending effects are found, as well as at the intersection of both longitudinal and cross stiffeners.
Road pavements on the deck plate may contribute to the dispersal of concentrated wheel loads from road traffic. This has also been observed for railway loading, where the ballast may disperse the track loads. However, wearing courses and pavements are not always available or sufficient to reduce the heavy traffic loads, for instance in the case of movable bridges. An example of this is the Calandbridge in Rotterdam, which was examined more closely and where severe damage due to cracking and fatigue has been found. In Belgium, large span bridges with orthotropic plated deck (for instance the Vilvoorde viaduct in Brussels) do not suffer from this cracking, but smaller movable bridges also show this sensitivity. This situation has to be considered in view of the ever-increasing axle loads and more compact wheel loads introduced by road traffic. The design and fatigue loads as mentioned by Eurocode 1, which were intended as higher bond values of European traffic, may well be circulating frequently at present. In view of these considerations, the conclusion must be to find systems to decrease the aggressive effects of concentrated wheel loads on orthotropic plated decks, or to eliminate these effects.
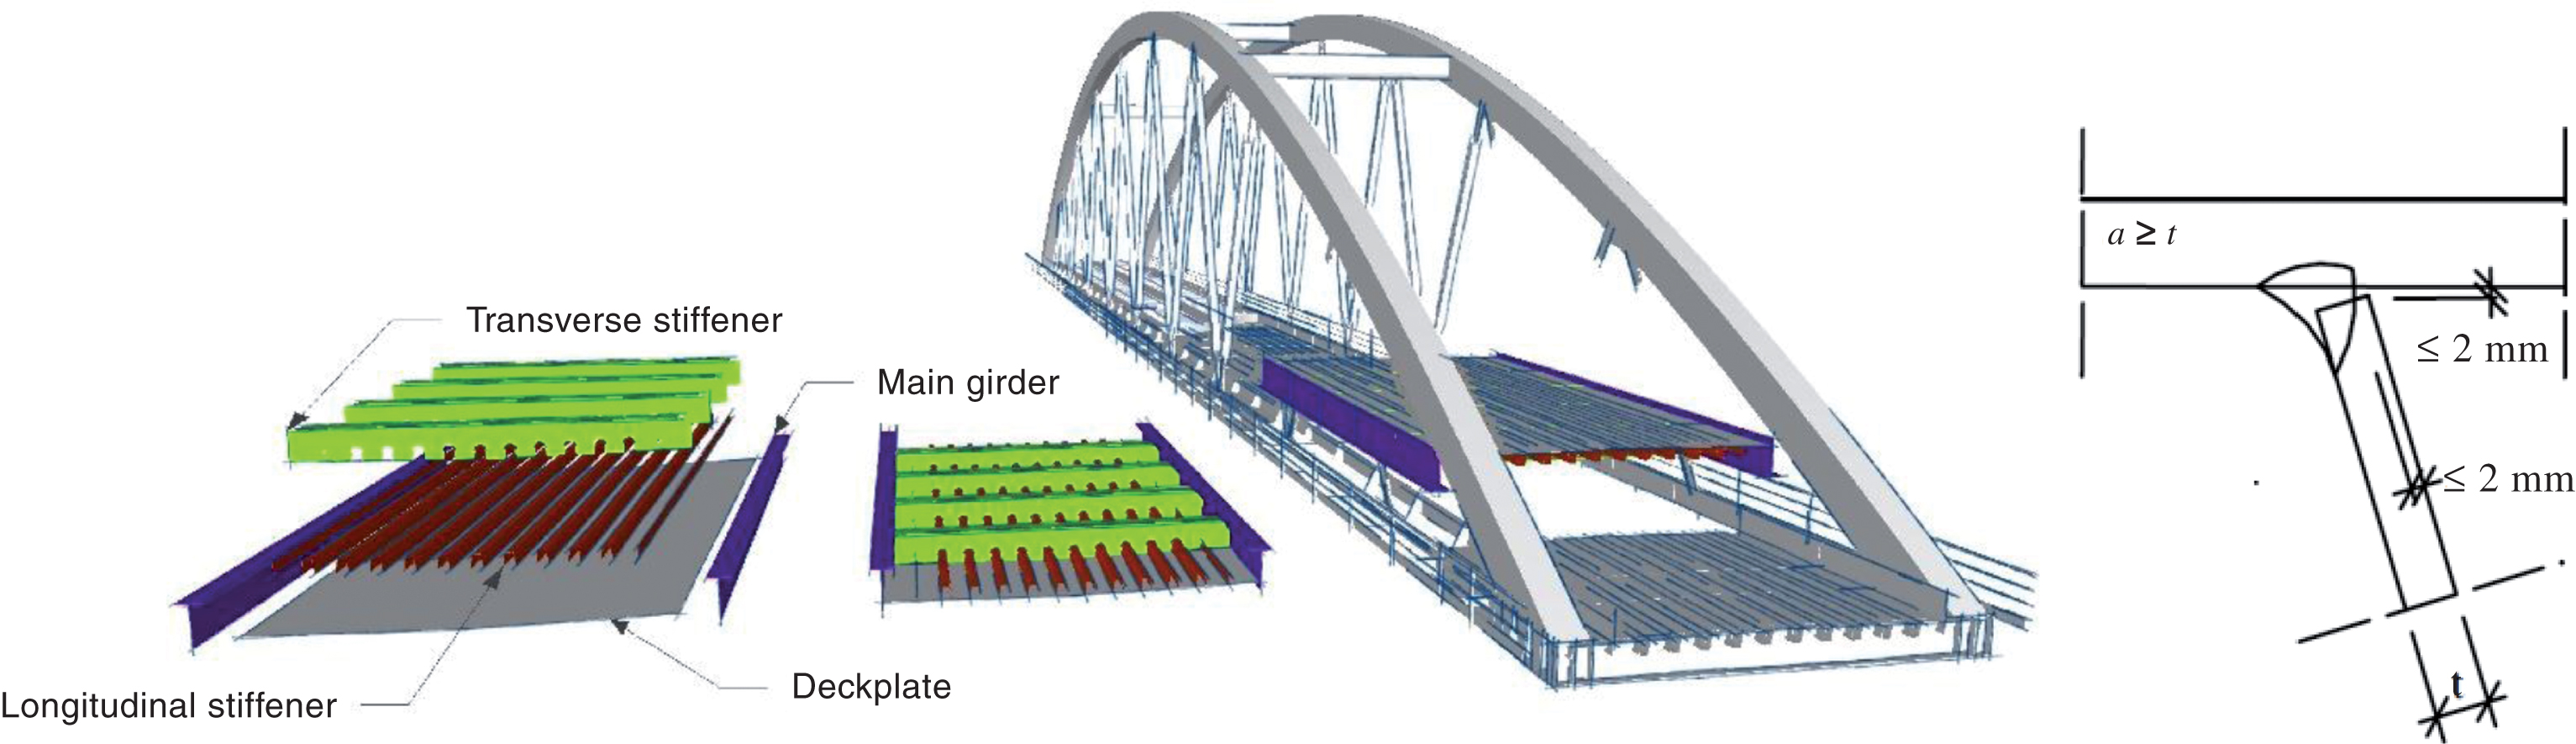
This paper focuses on the connection of the deck plate to the trapezoidal closed longitudinal ribs (Fig. 1) and more in particular at the location mid span two transverse stiffeners. This is one of the most common locations where fatigue problems occur. At the manufacturing level, welding details have to make use of the available standards. Following the recommendations of Eurocode 3, Part 2 [1], a weld penetration of minimum 67% – 75% should be achieved. In addition, the some code used to prescribe even higher weld penetration. Despite the latter, the manufacturers already try to achieve full weld penetration as much as possible. When welds are executed with care, the reference value Δσc for the fatigue strength increases. However, when taking into account current construction technologies, Eurocode is still considering the outdated reference values Δσc, as shown in Eurocode 3, part 1–9 [2]. Therefore, present fatigue calculations are very conservative. For the weld detail of the stiffener-to-deck plate connection (right-hand side of Fig. 1), a reference value Δσc of 71 MPa applies. According to recent fatigue tests, higher reference values up to 140 MPa are found [3], indicating that the fatigue resistance could be higher than expected. Unfortunately, the designer has to use the Eurocode guidelines resulting in a tendency to use thicker deck plates and stiffeners, thus reducing the advantage of having a light weighted construction. To investigate and quantify the real fatigue behavior, a much more in-depth method is used, based on Linear Elastic Fracture Mechanics (LEFM). With this method, a detailed crack behavior can be evaluated and the total fatigue life can be estimated as well as the expected crack pattern. The latter can be very useful for weld details similar to the one presented in this paper because the crack could start at positions invisible to any visual inspection tool. In the case of a stiffener-to-deck plate connection, the crack would start at the weld root, which is on the inside of the longitudinal stiffener. Therefore, when a fatigue crack becomes visible in such details, there is already sufficient damage to cause failure of the orthotropic steel deck [4].
Fig.1
Orthotropic steel bridge deck and welding procedure according to NBN EN 1993-2 : 2009.
2Possible solutions – the use of wearing courses
2.1Geometry of the finite element model
In order to determine the fatigue life of the orthotropic decks being considered for the new bridges, a highly detailed finite element model is designed. Two consecutive deck plate sections as well as the three surrounding crossbeams are included in the model. The entire modeled section will fit precisely between nodes of the truss girders at the sides of each deck. As boundary conditions, the orthotropic deck is supported in the nodes of the truss girders. The deck plate thickness of the basic design equals 16 mm, while the longitudinal trapezoidal stiffeners are 8 mm thick. The thicknesses of crossbeam web and flange are 15 mm and 20 mm respectively. Crossbeam cutouts are modeled in detail. The steel parts of the deck are all modeled using Mindlin shell elements. All wearing courses will be modeled using Mindlin volume elements. All of the wearing course, described in paragraph 2.4, as well as a situation without wearing courses are studied.
2.2Eurocode calculations
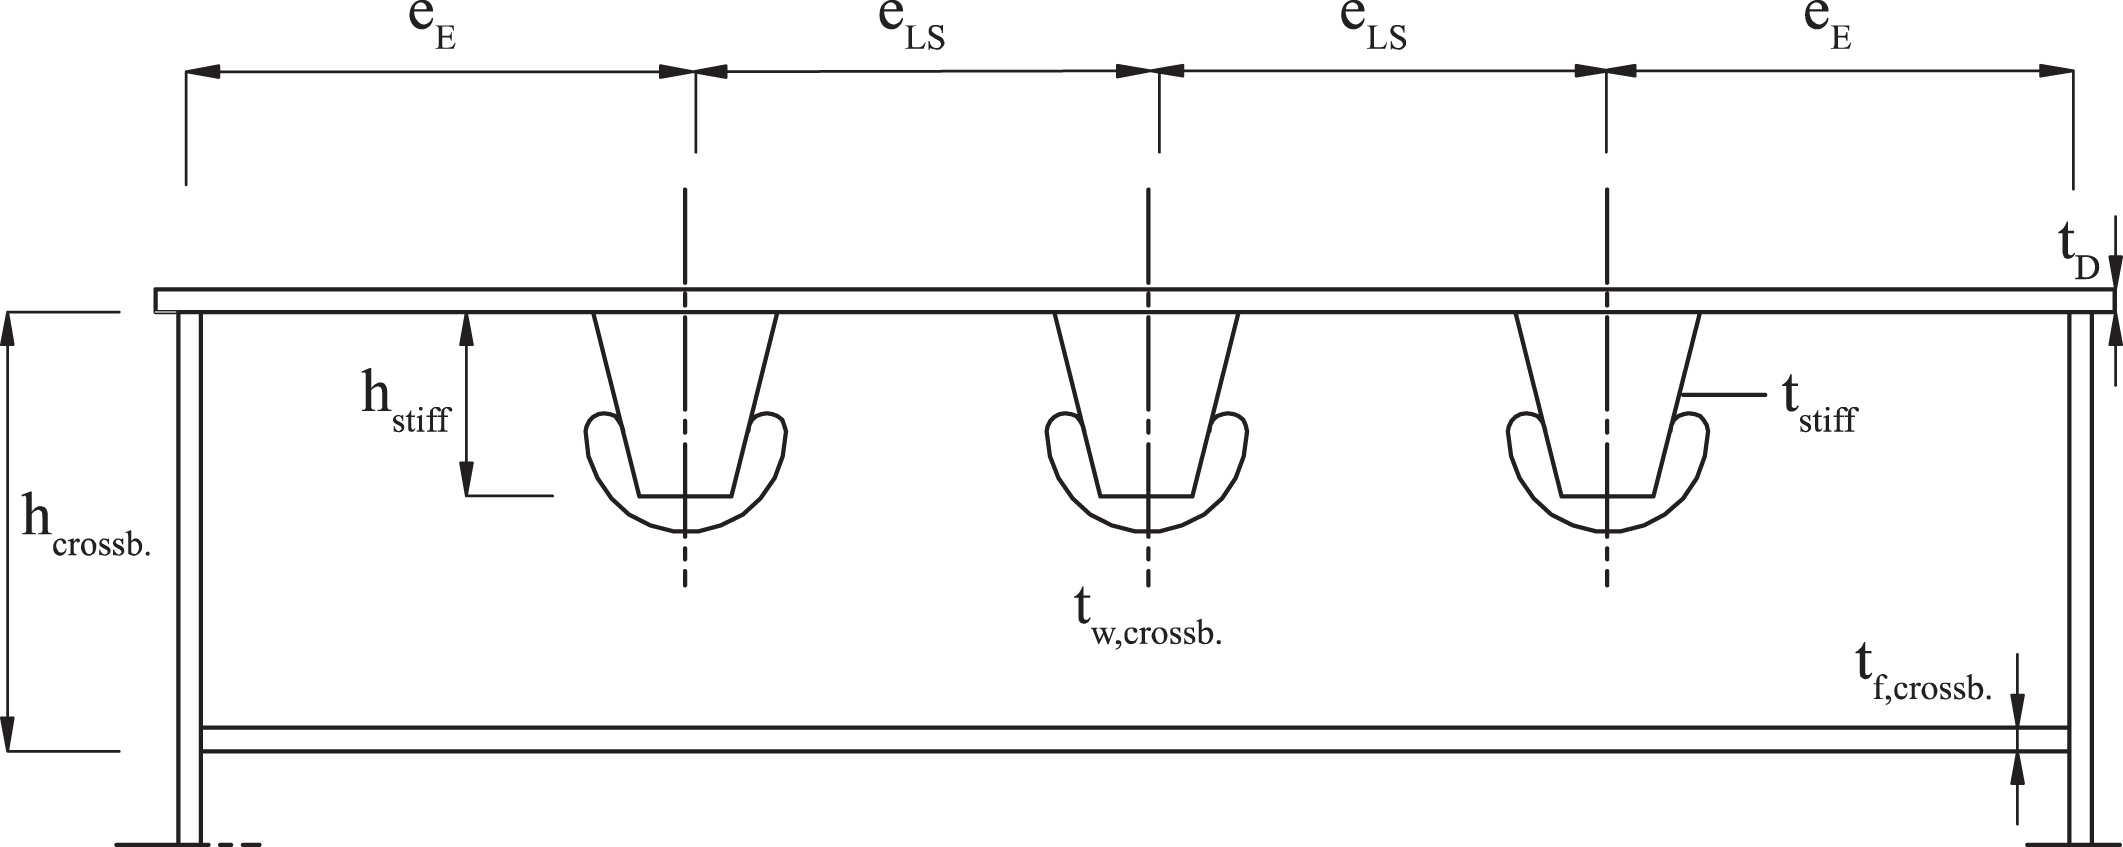
In the standard NBN EN 1993-2 [1], several recommendations can be found for a proper design of OSDs (Fig. 2). First of all, the deck plate hboxthickness should be selected based on the possible composite action of the used wearing courses. For OSDs constructed for resisting heavy traffic loads, the deck plate thickness tD should be at least 14 mm if an asphalt layer of 70 mm or more is used. When the asphalt layer is reduced, the deck plate thickness tD should be at least 16 mm. The spacing eLS between the longitudinal stiffeners should be less or equal to 300 mm. In addition, the ratio eLS/tD has to be less than 25. Finally, the standard recommends to use a minimal longitudinal stiffener thickness tstiff of 6 mm. If these recommendations are taken into account, a verification of the bending moments in the bridge deck is not needed.
Fig.2
Recommended geometry for OSDs.
For the fatigue life assessment, Eurocode prescribes the use of the linear dam- age accumulation phenomenon, described by the Palmgren-Miner hypothesis. Although it can give a first impression of the remaining fatigue life of a construction detail, it has some serious shortcomings due to its simplicity. The real fatigue behavior is non-linear and depends on for example the used load sequence. The latter is totally neglected with the Palmgren-Miner hypothesis. In addition, when using this hypothesis for assessing the remaining safety of a bridge deck, it is necessary to have an accurate prediction of the load cycle history of the bridge deck. This is however not easy to determine. The reference values for the main weld details of an OSD are summarized in Fig. 3 and Table 1.
Fig.3
Critical areas for the fatigue calculation of an orthotropic steel deck according to Eurocode.
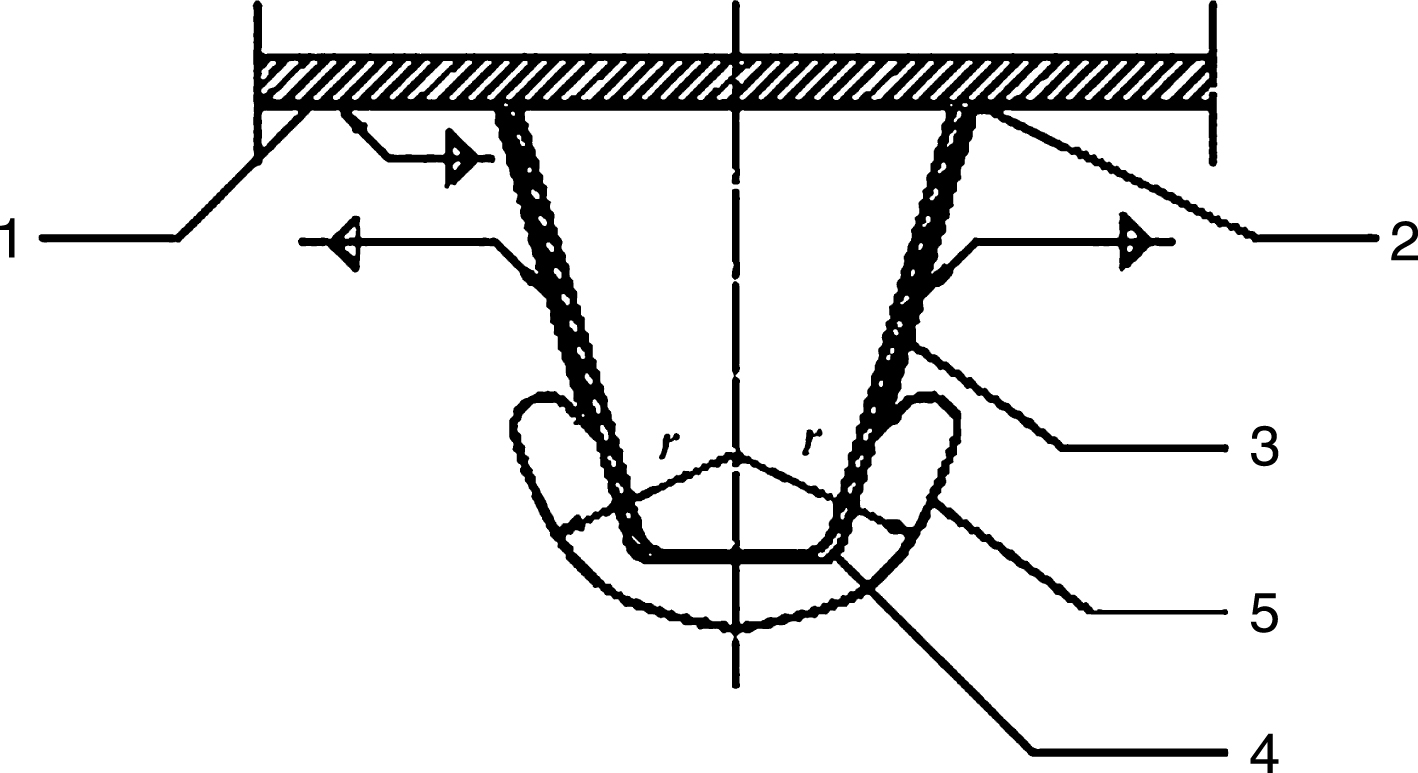
Table 1
Weld categories according to Eurocode
| Area | Detail | Category (MPa) |
| 1 | Longitudinal stresses in the deck at the transversal welds | 71 |
| 2 | Longitudinal stresses in the deck at the crossbeam connection | 80 or 100 |
| 3 | Welded connection of a closed stiffener with the crossbeam | 80 |
| 4 | Welded connection between closed stiffeners with backing strip | 71 |
| 5 | Free edge of the cutout in the crossbeams | 112 |
| 6 | Weld between closed stiffener and the deck | 71 |
The classical fatigue calculation for this bridge deck, based on the use of nominal stresses for each fatigue detail, will be performed using Fatigue Load Model 4 of the Eurocodes (FLM4). This model uses a number of normalized trucks. For most of the bridges where an OSD is considered, long distance traffic is the most relevant choice. It is also the heaviest fatigue traffic mix. When looking at the percentages in this traffic mix, it is quite obvious that lorry number 3 will always be the most influential. The finite element model studies the crossing of each of the 5 Eurocode lorries and the resulting stress variations in each fatigue detail of the bridge. A transversal influence line was used to determine the optimal position of each lorry in the transversal direction of the bridge deck to result in the highest stress variations. Although the Eurocodes allow for a reduction of the load values based on a distribution of the loads due to the influence of the wearing courses, it was not considered for these calculations. Partly because the layers will be modeled in detail, but also since experience has shown this influence is quite limited. The wearing course thickness for movable bridge is almost always smaller than 20 mm. In addition, this Eurocode reduction is purely based on the thickness of the layer and not on a composite behavior of both wearing course and orthotropic deck plate.
The wearing courses are modeled using volume elements instead of shell elements. For the base design model, a 7-mm thick wearing course is included. The connection between wearing course and steel deck plate is assumed to be perfect. The chosen wearing course is standard asphalt characterized by a temperature and load frequency dependent Young’s modulus. The calculations assume the Young’s modulus to be about 880 MPa at a temperature of 15°C. The contribution of the wearing course in reducing the stress variations will be lower at lower temperatures since the Young’s modulus will then be considerably higher. Taking in mind the average temperature at this location (between 2 and 17 °C) and the non-linear relation between temperature and resulting fatigue life, this temperature seems to be a safe assumption.
The following fatigue details are studied in this comparison:
• The stiffener to deck plate detail, as shown in Fig. 1. Eurocode 3 illustrates that when working with nominal weld details, this fatigue check needs to be performed based on the bending moment variation in the deck plate at the location of the weld, but using the geometrical characteristics of the longitudinal stiffener. The corresponding detail category is 71.
• The other fatigue details are mainly situated at the confluence of longitudinal stiffeners and crossbeam and are shown in Fig. 3 and Table 1.
Not all of the critical regions, shown in Fig. 3 and Table 1, are as important for the studied deck plate geometry. At this step of the design phase, no information is known concerning the transverse fillet welds in the deck plate, so this critical region is not studied in detail. It is assumed that all transverse welds are located so that they are not location characterized by maximal moment variation of the stiffener to deck plate detail. This was one of the main reasons for the fatigue crack occurring at the Temse Bridge [1]. The connection between longitudinal stiffeners was not checked for the same reasons. For all of the considered calculations, no stresses higher than 45 MPa were found at the edges of the cutouts in the crossbeam webs. Since this is lower than the cut-off limit for critical region 5, this detail is not discussed further on in this article.
2.3Stiffener-to-deck plate detail
When following Eurocode 3 to the letter, it states that in non-welded details or stress-relieved welded details, the mean stress influence on the fatigue strength may be taken into account by determining a reduced effective stress range in the fatigue assessment when part or all of the stress cycle is compressive. The effective stress range may be calculated by adding the tensile portion of the stress range and 60% of the magnitude of the compressive portion of the stress range. However, no clear definition is given of the necessary weld treatment. The application of this rule, as well as the interpretation is left to the choice of the designer. In its strictest form, the weld treatment consists of reheating to a temperature of 500–600°C of the entire welded deck, which is practical for small elements but not really for orthotropic deck plates. Because of this, a large number of variations to this technique exist. These include, locally reheating immediately after welding to 200–300°C, shot-peening, etc. Most of these have a positive but difficult to quantify influence and not all are frequently applied, although they will additionally influence residual stresses greatly. Because of this, it was chosen to discard this reduction of the stress variations, because it sometimes results in an underestimation of the fatigue effect, unless more detailed models including residual stresses are considered as discussed in the following paragraphs.
The calculated fatigue life for each detail of the considered bridge, based on the above is:
• Classical method:
∘ Stiffener to deck plate detail: 233 year
∘ Critical region 2: 104 year
∘ Critical region 3: 101 year
• Hot Spot method:
∘ Stiffener to deck plate detail:
■ Deck plate 89 year
■ Stiffener 454 year
∘ Critical region 2: 353 year
∘ Critical region 3: 371 year
The stiffener to deck plate detail is the only fatigue detail that does not reach 100 years and this only when using the hot spot method of Annex B form Eurocode 3 [2]. However, it is important to remark that no transverse distribution of the actual loads was taken into account. In addition, the use of the hot spot method might be a bit conservative for this finite element model.
2.4Parametric study
Although the fatigue behavior of this initial design does not seem to be problematic a number of variations of the most important parameters are studied: plate thickness of the steel deck plate, thickness of the wearing courses, type of wearing course.
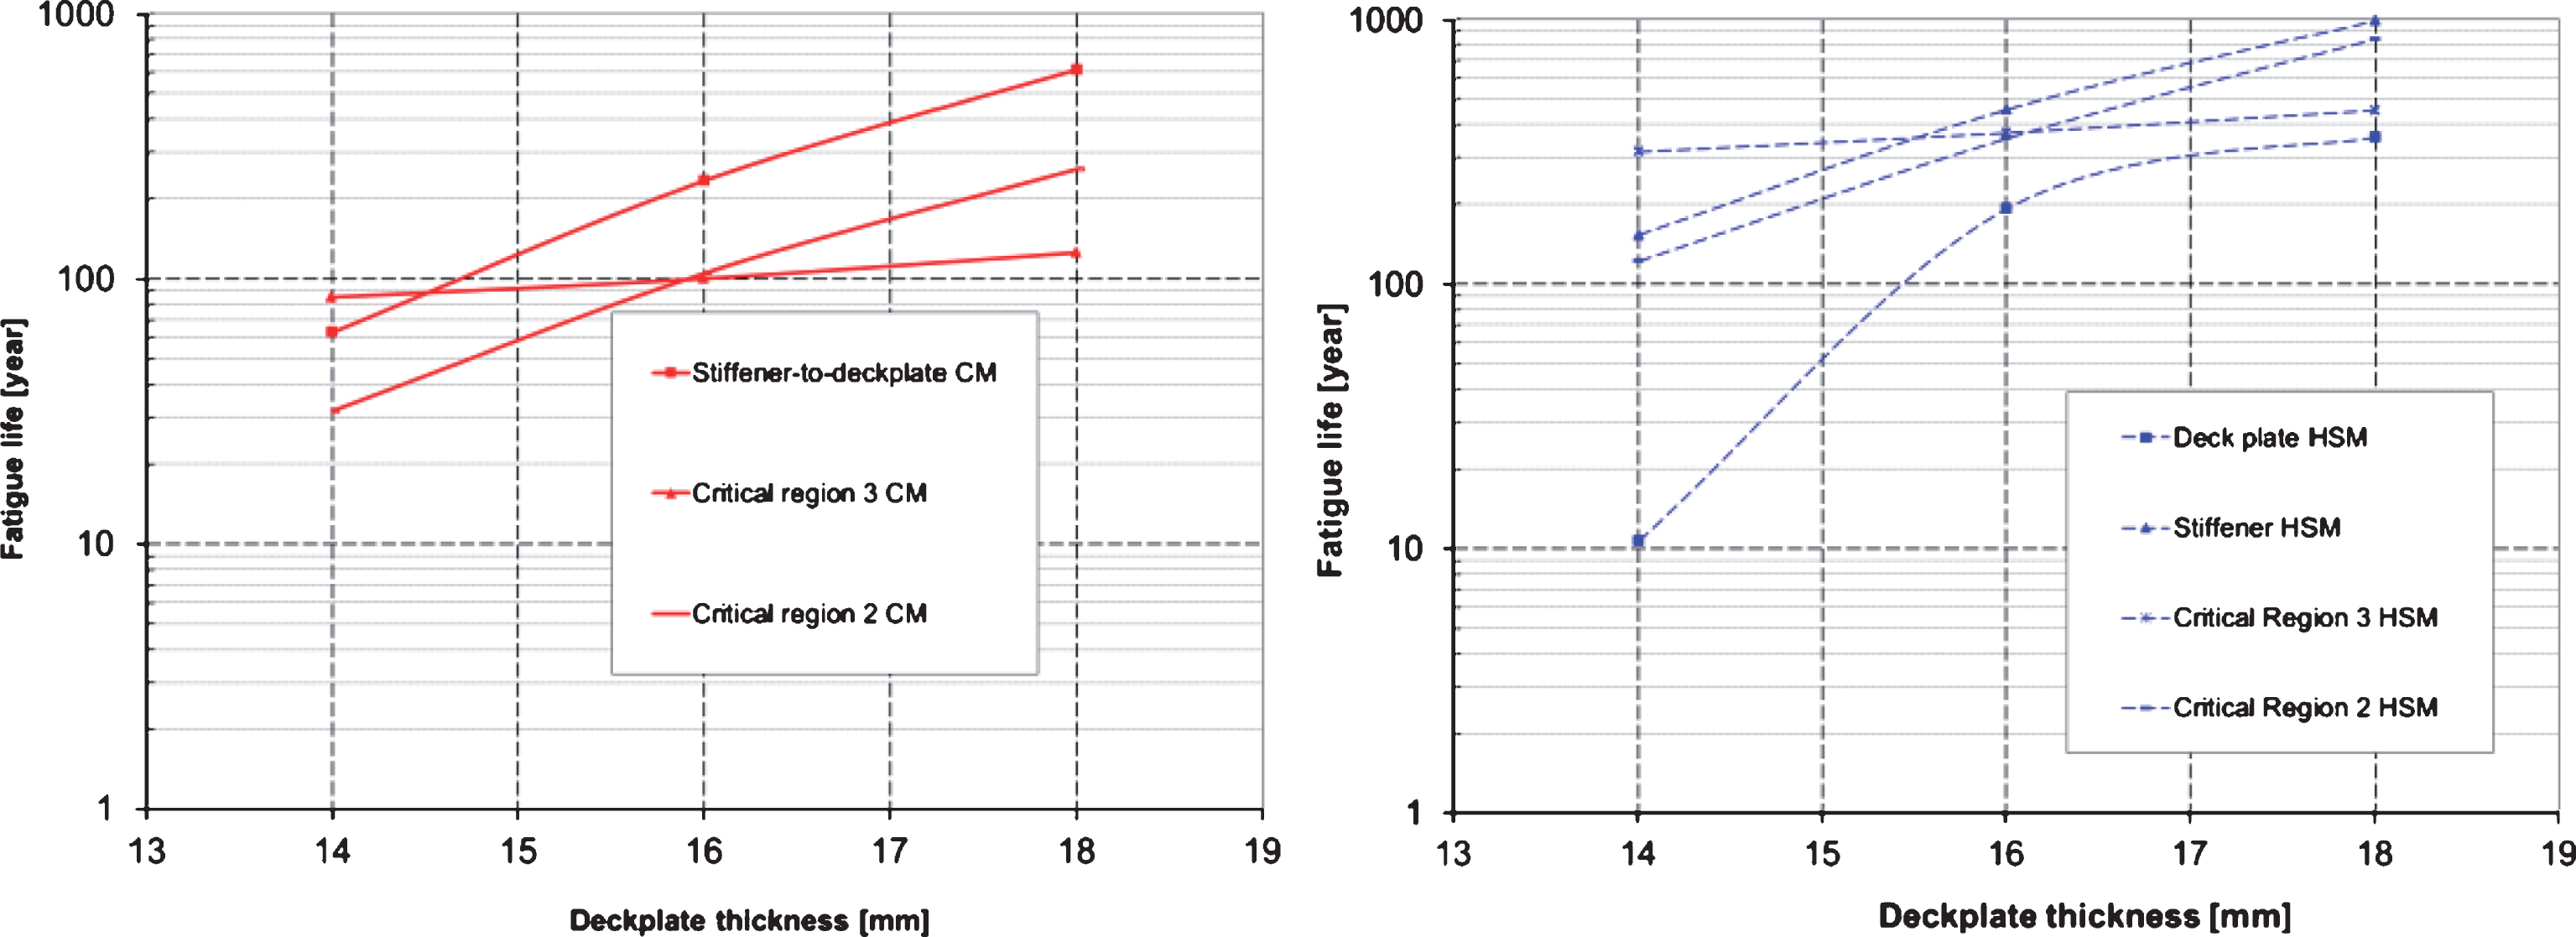
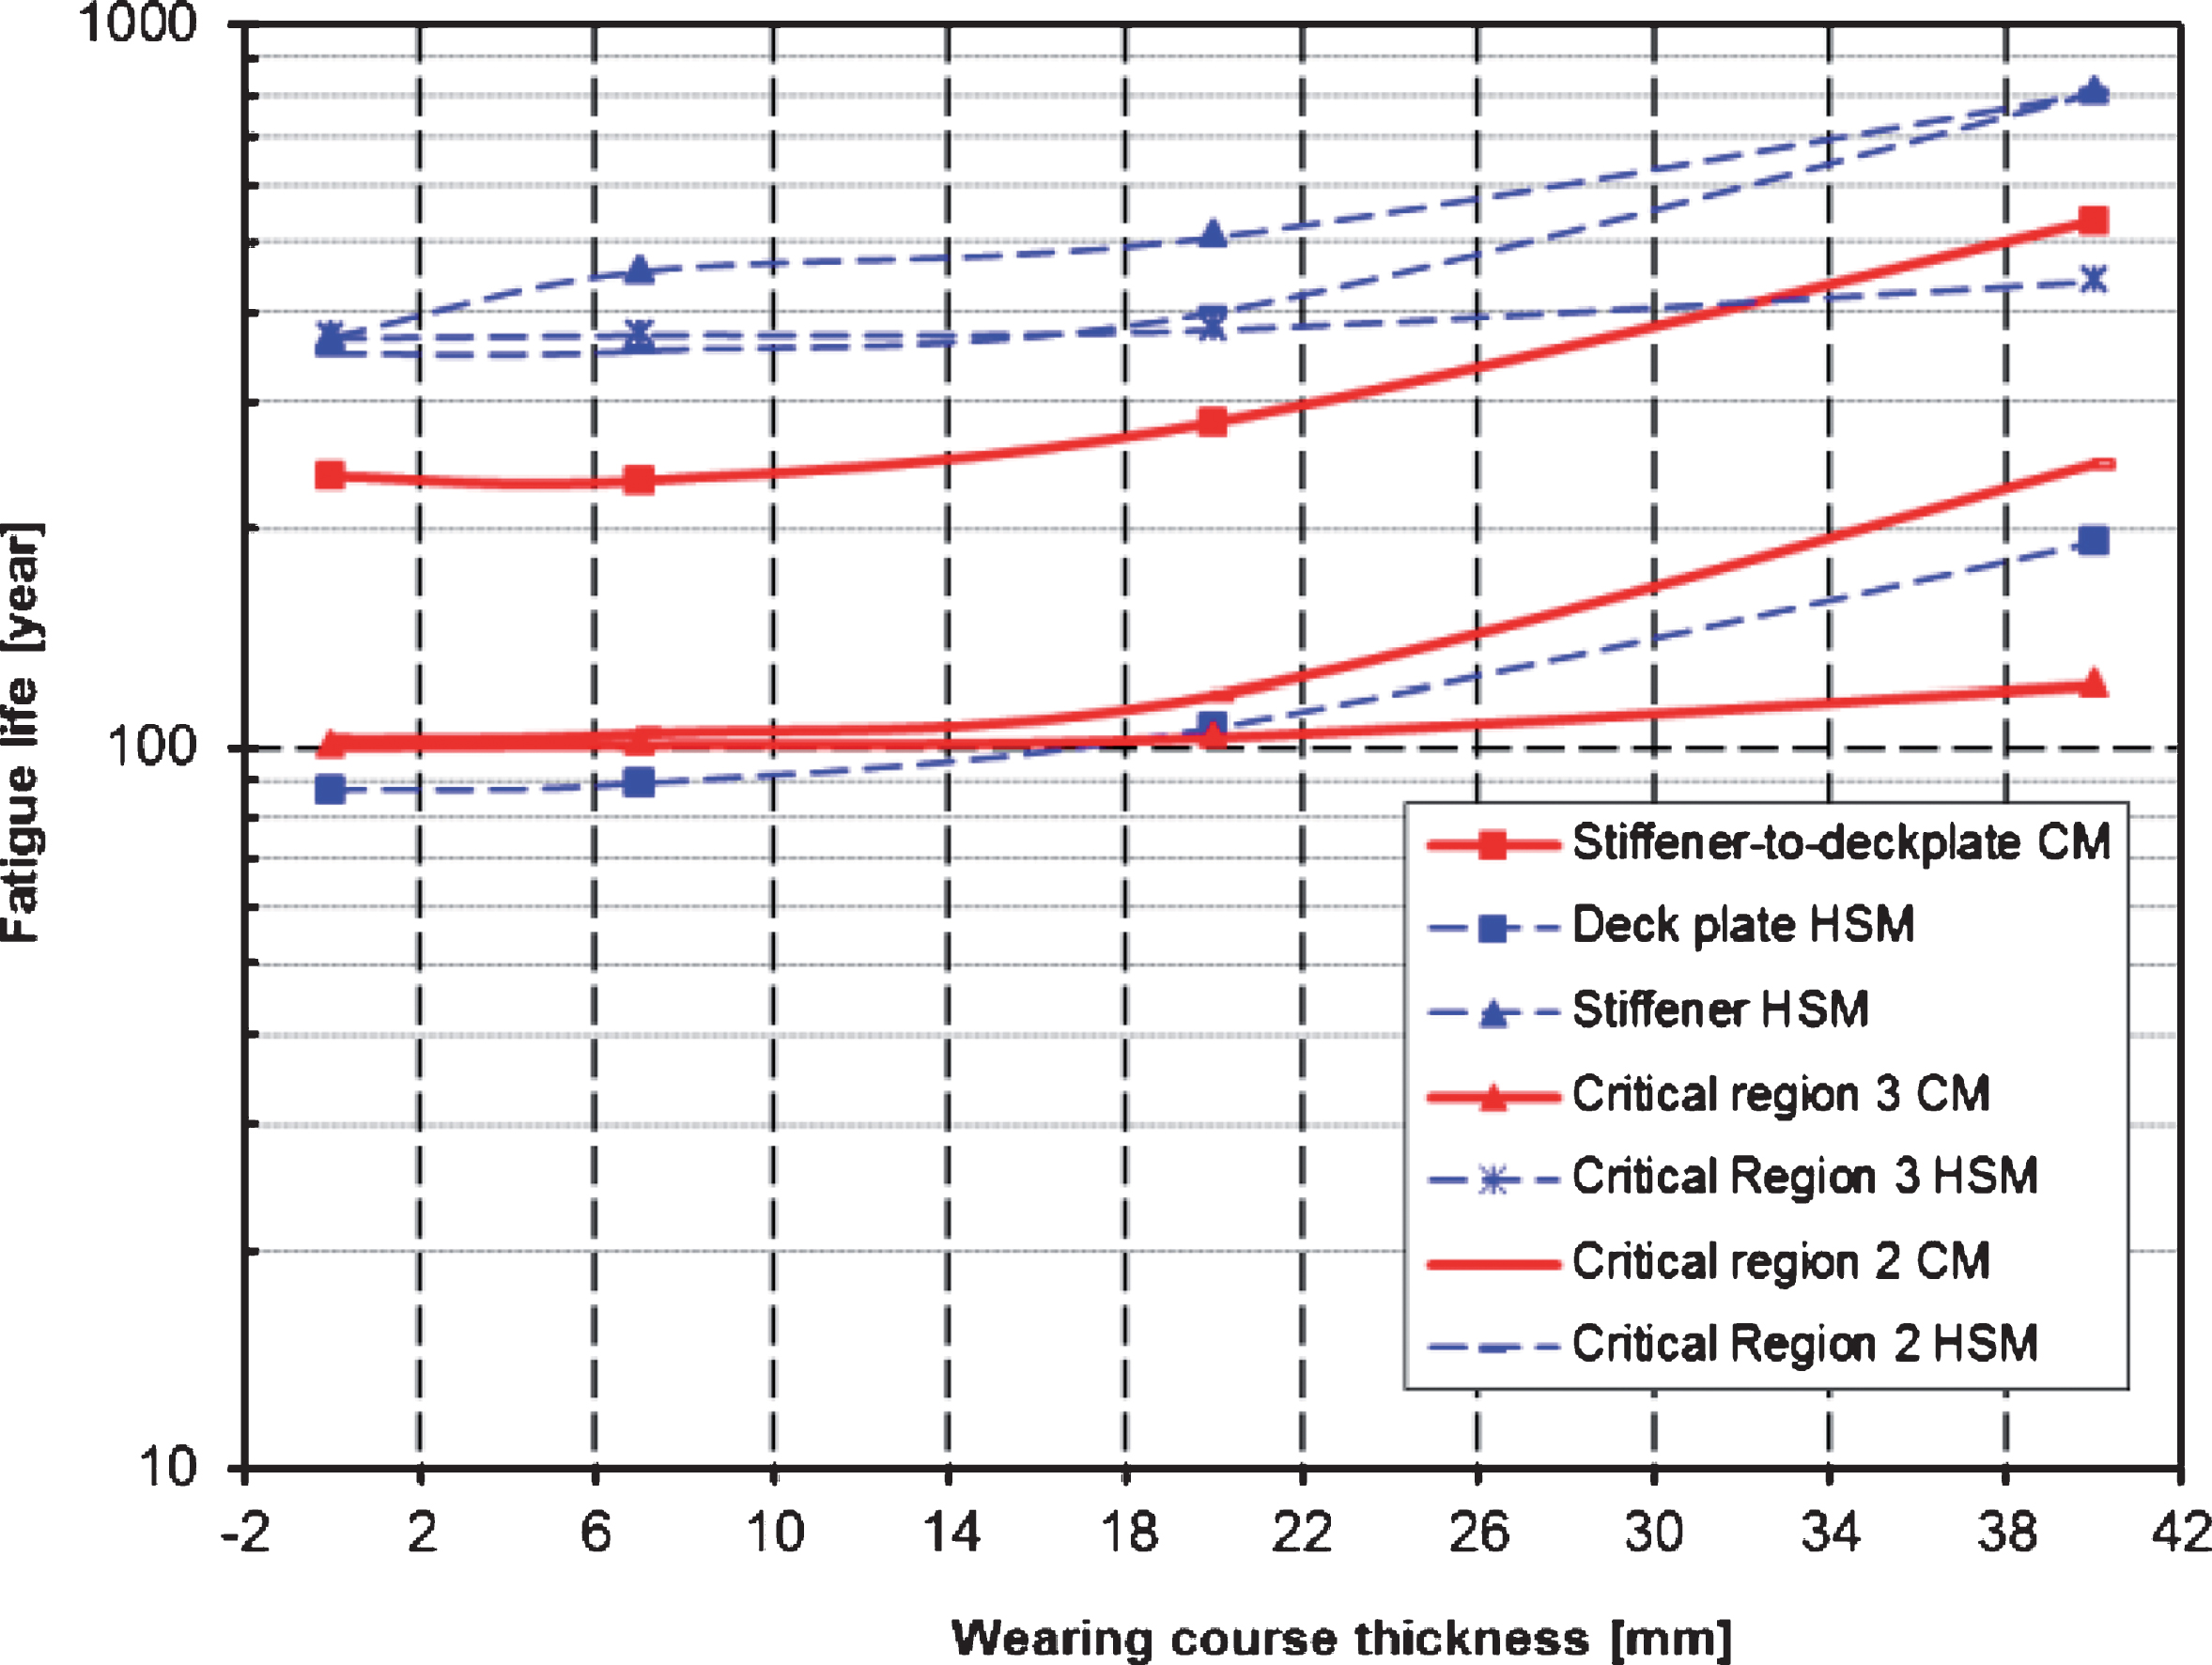
Both a slightly higher and lower thickness is considered. Since the maximum thickness of the deck plate is quite limited for movable bridges because of overall weight issues, only thicknesses between 14 and 18 mm are considered. The resulting fatigue life for all deck plate thicknesses are summarized in both graphs in Fig. 4. The graph on the left uses nominal stress variations, while the graph on the right uses the hot spot method. It is immediately obvious that this is an influential parameter, especially when compared with the influence of the wearing courses. Looking at the nominal stresses, the stress variations of critical region 2 and at the stiffener to deck plate detail are more heavily influenced. However, all variations appear to be more or less linear in a logarithmic graph. The hot spot stress method however shows that the influence of the deck plate thickness is extremely important for the stiffener-to-deck plate detail. A deck plate that is 2 mm thinner has a reduced fatigue life of only 11 years for this detail.
Fig.4
Influence of the deck plate thickness on the fatigue life according to nominal stress variations (left) and hot spot stresses (right).
The second parameter that was studied is the wearing course thickness. All results concerning the fatigue life for the considered details are summarized in Fig. 5 for wearing courses with thicknesses between 0 and 40 mm. Overall it can be stated that the influence of thin wearing courses, i.e. thinner than 6 mm, is quite limited. The influence of a thicker layer will only become relevant for thicknesses higher than 20 mm. In addition, the influence of the wearing course thickness is much more outspoken for the stiffener to deck plate detail and the connection of deck plate with cross beam web than the connection between crossbeam web and longitudinal stiffener.
Fig.5
Influence of wearing course thickness on the fatigue life.
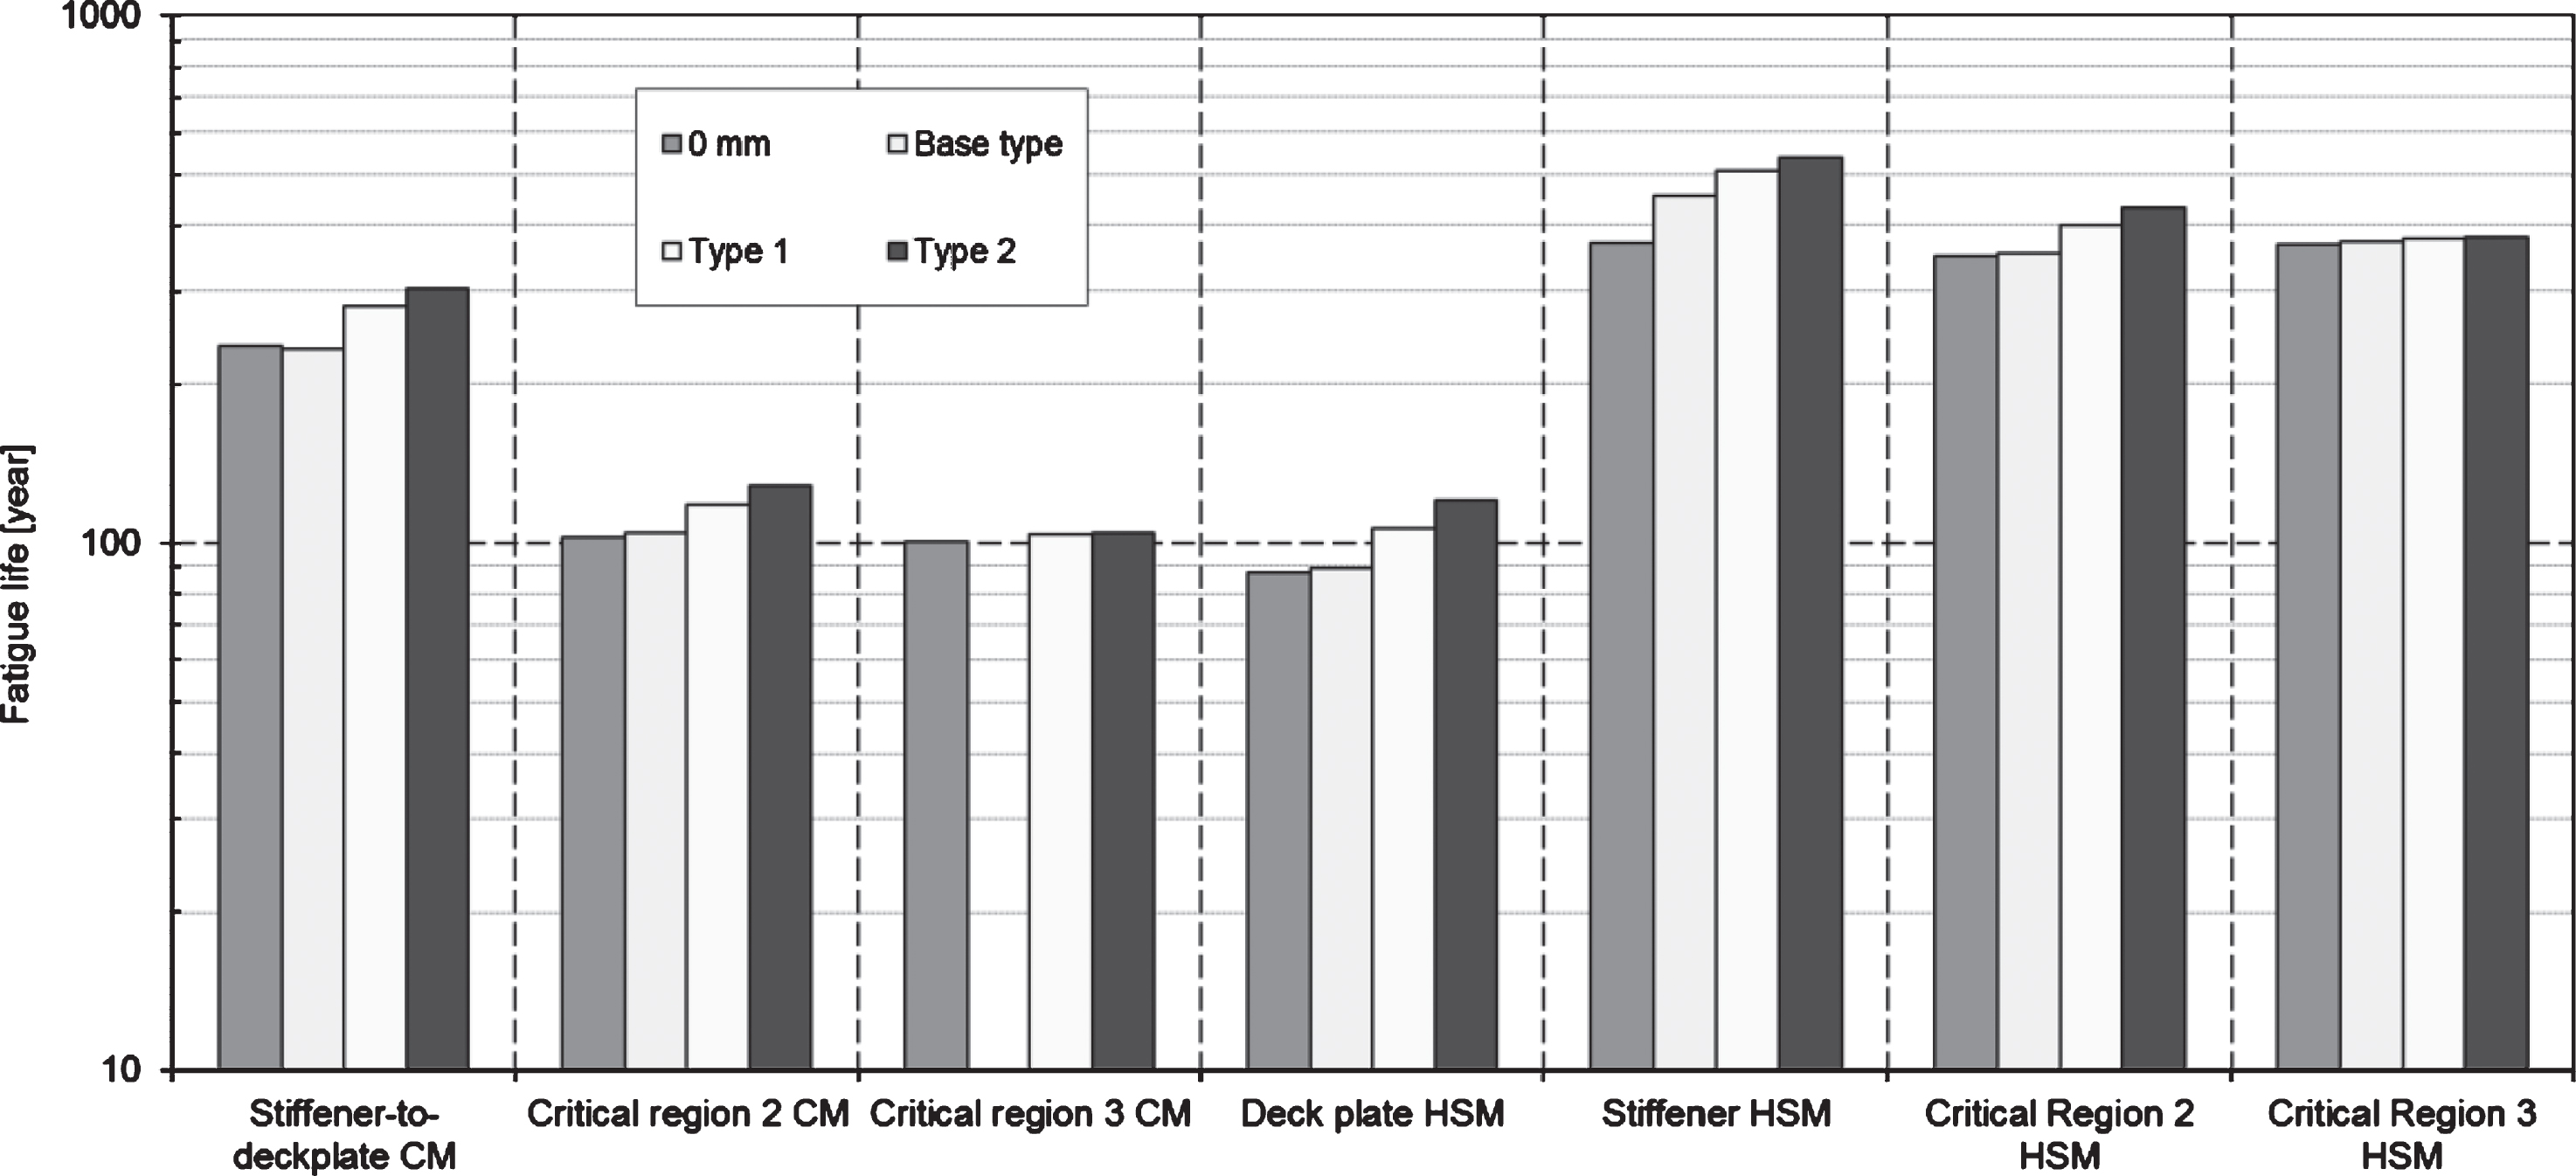
The following types of wearing courses are compared:
• A situation without wearing courses;
• The standard design situation having a temperature dependent wearing course with a thickness of 7 mm;
• A slightly thicker wearing course with a thickness of 20 mm (Type 1);
• An alternative wearing course, using epoxy-asphalt with a thickness of 20 mm (Type 2).
This last alternative is not temperature dependent when it comes to stiffness and the application will normally result in a much better friction between deck plate and wearing course. The influence on the fatigue life is quite important as can be seen in Fig. 6.
Fig.6
Influence of wearing course type on the fatigue life.
3XFEM and the influence of residual stresses
3.1eXtended finite element models
To evaluate the fatigue life of steel bridges, stress cycles due to traffic are calculated with detailed FEM-models. However, when LEFM is introduced, standard FEM models cause many practical and computational problems, especially if automatic crack propagation is required. In such cases, eXtended Finite Element Models (XFEM) can offer a solution. When using XFEM, it is possible to evaluate automated crack propagation with all its LEFM calculated parameters without adapting the initial model and corresponding mesh for every crack propagation step. However, the downside of this is the heavy computational effort. In order to have realistic and accurate results, the mesh in the vicinity of the crack tip has to be sufficiently small to capture the stresses. In addition, the larger the crack tip, the more degrees of freedom are generated. Due to the latter, XFEM simulations are often limited to simulating a small crack front when considering automatic crack propagation methods. This is however not a problem, as the XFEM calculations can give a clear visualization of the initial crack propagation up to stable crack growth.
In 2004, a fatigue crack was detected in a stiffener-to-deck plate connection of an orthotropic steel bridge deck in Belgium [4]. This was in the Temse Bridge, a movable truss across the river Scheldt. To verify the fatigue life of this bridge deck, a full-scale FEM-model was developed based on its dimensions. The Temse Bridge has a span of 53.90 m and a width of 7.00 m. The deck plate of the bridge is only 12 mm thick and the closed trapezoidal stiffeners are 8 mm thick. The stiffeners are 350 mm high and 300 mm wide on top and have a width of 90 mm at the lower soffit. De distance between the longitudinal stiffeners equals 300 mm.
The used FEM-model consists of shell elements and beams. The advantage of using a full FEM-model is to have boundary conditions as close as possible to the real structure. In a next step, this model is linked to a much more detailed XFEM model. This XFEM model is a small piece of a stiffener-to-deck plate connection and is made out of volume elements. To link both models together, the displacements from the large FEM-model are introduced on the edge of the XFEM model. As mentioned before, thicker plates are used when trying to increase the fatigue life of the structure. To validate whether this is justified, the dimensions of the Temse Bridge are also adapted with different stiffener web thicknesses and deck plate thicknesses. Therefore, a comparison could be made.
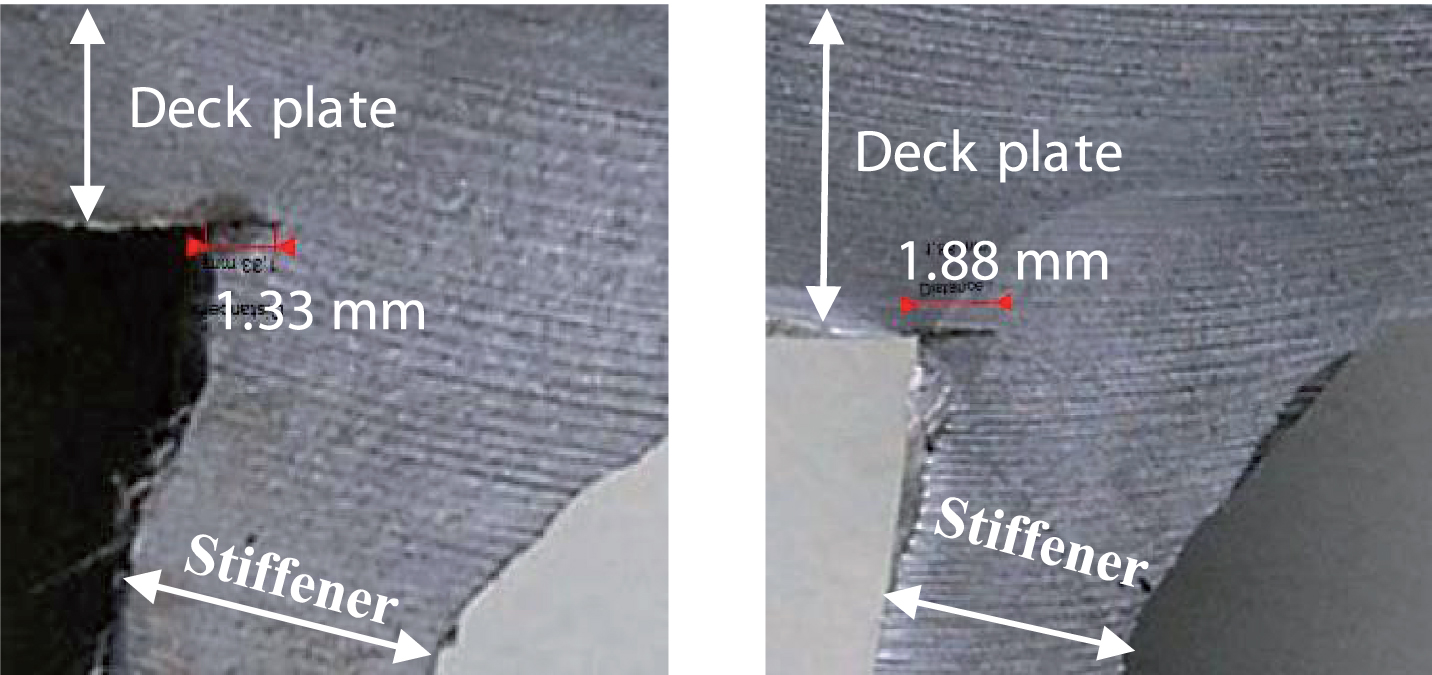
Fatigue crack growth is mainly defined by three different phases: crack initiation, crack propagation and crack failure. The first phase depends on the execution of the weld. For example, bad weld penetration, weld defects and partially rewelded tack welds can reduce or eliminate the crack initiation phase and therefore reduce the fatigue life of the structure. Looking for example at some weld macros of recently executed stiffener-to-deck plate welds, relevant lack of penetration can be noticed (Fig. 7). This lack of penetration is a perfect initial crack with a length of approximately 1.5 mm. It is assumed in the XFEM model that the initial crack has a semi-elliptical shape with a half-length of 1.5 mm along the minor axis and a half-length of 3 mm along the major.
Fig.7
Weld macros of stiffener-to-deck plate weld.
3.2Residual weld stresses
Residual stresses are present in all civil structures due to manufacturing steps, causing plastic deformation. Nevertheless, these stresses are not often implicitly taken into account when considering the design of structures. Similar as for the dead load of the bridge deck, this is true when focusing on the stress variations, which eliminate the initial stress state of the structure. However, the effect of residual stresses may either be beneficial or detrimental, depending on their magnitude, sign and distribution with respect to the load-induced stresses. Therefore, the initial stress state due to a welding operation is also introduced into the FEM/XFEM-model.
Literature results from similar fillet welds as those in the orthotropic bridge deck are used to implement residual stresses into the model. These results stated that tensile yield stresses are present in the deck plate and the stiffener spread out in the heat affected zone [6]. Outside this area, compressive compensating stresses are found. To simulate residual stresses into the model, external forces and bending moments are inserted with respect to the global equilibrium. Therefore, Ndeck is chosen in order to have tensile yield stresses in the deck plate at the weld. For the stresses in the stiffener, an additional bending moment Mstiffener and normal force Nstiffener are also introduced. The bending moment is necessary because the joint is welded from one side only and the filler metal and the corresponding heat area is larger at the weld toe compared to the weld root. For the magnitude of this bending moment and normal force, an assumption is made based on the distribution of the filler metal.
3.3LEFM parameters
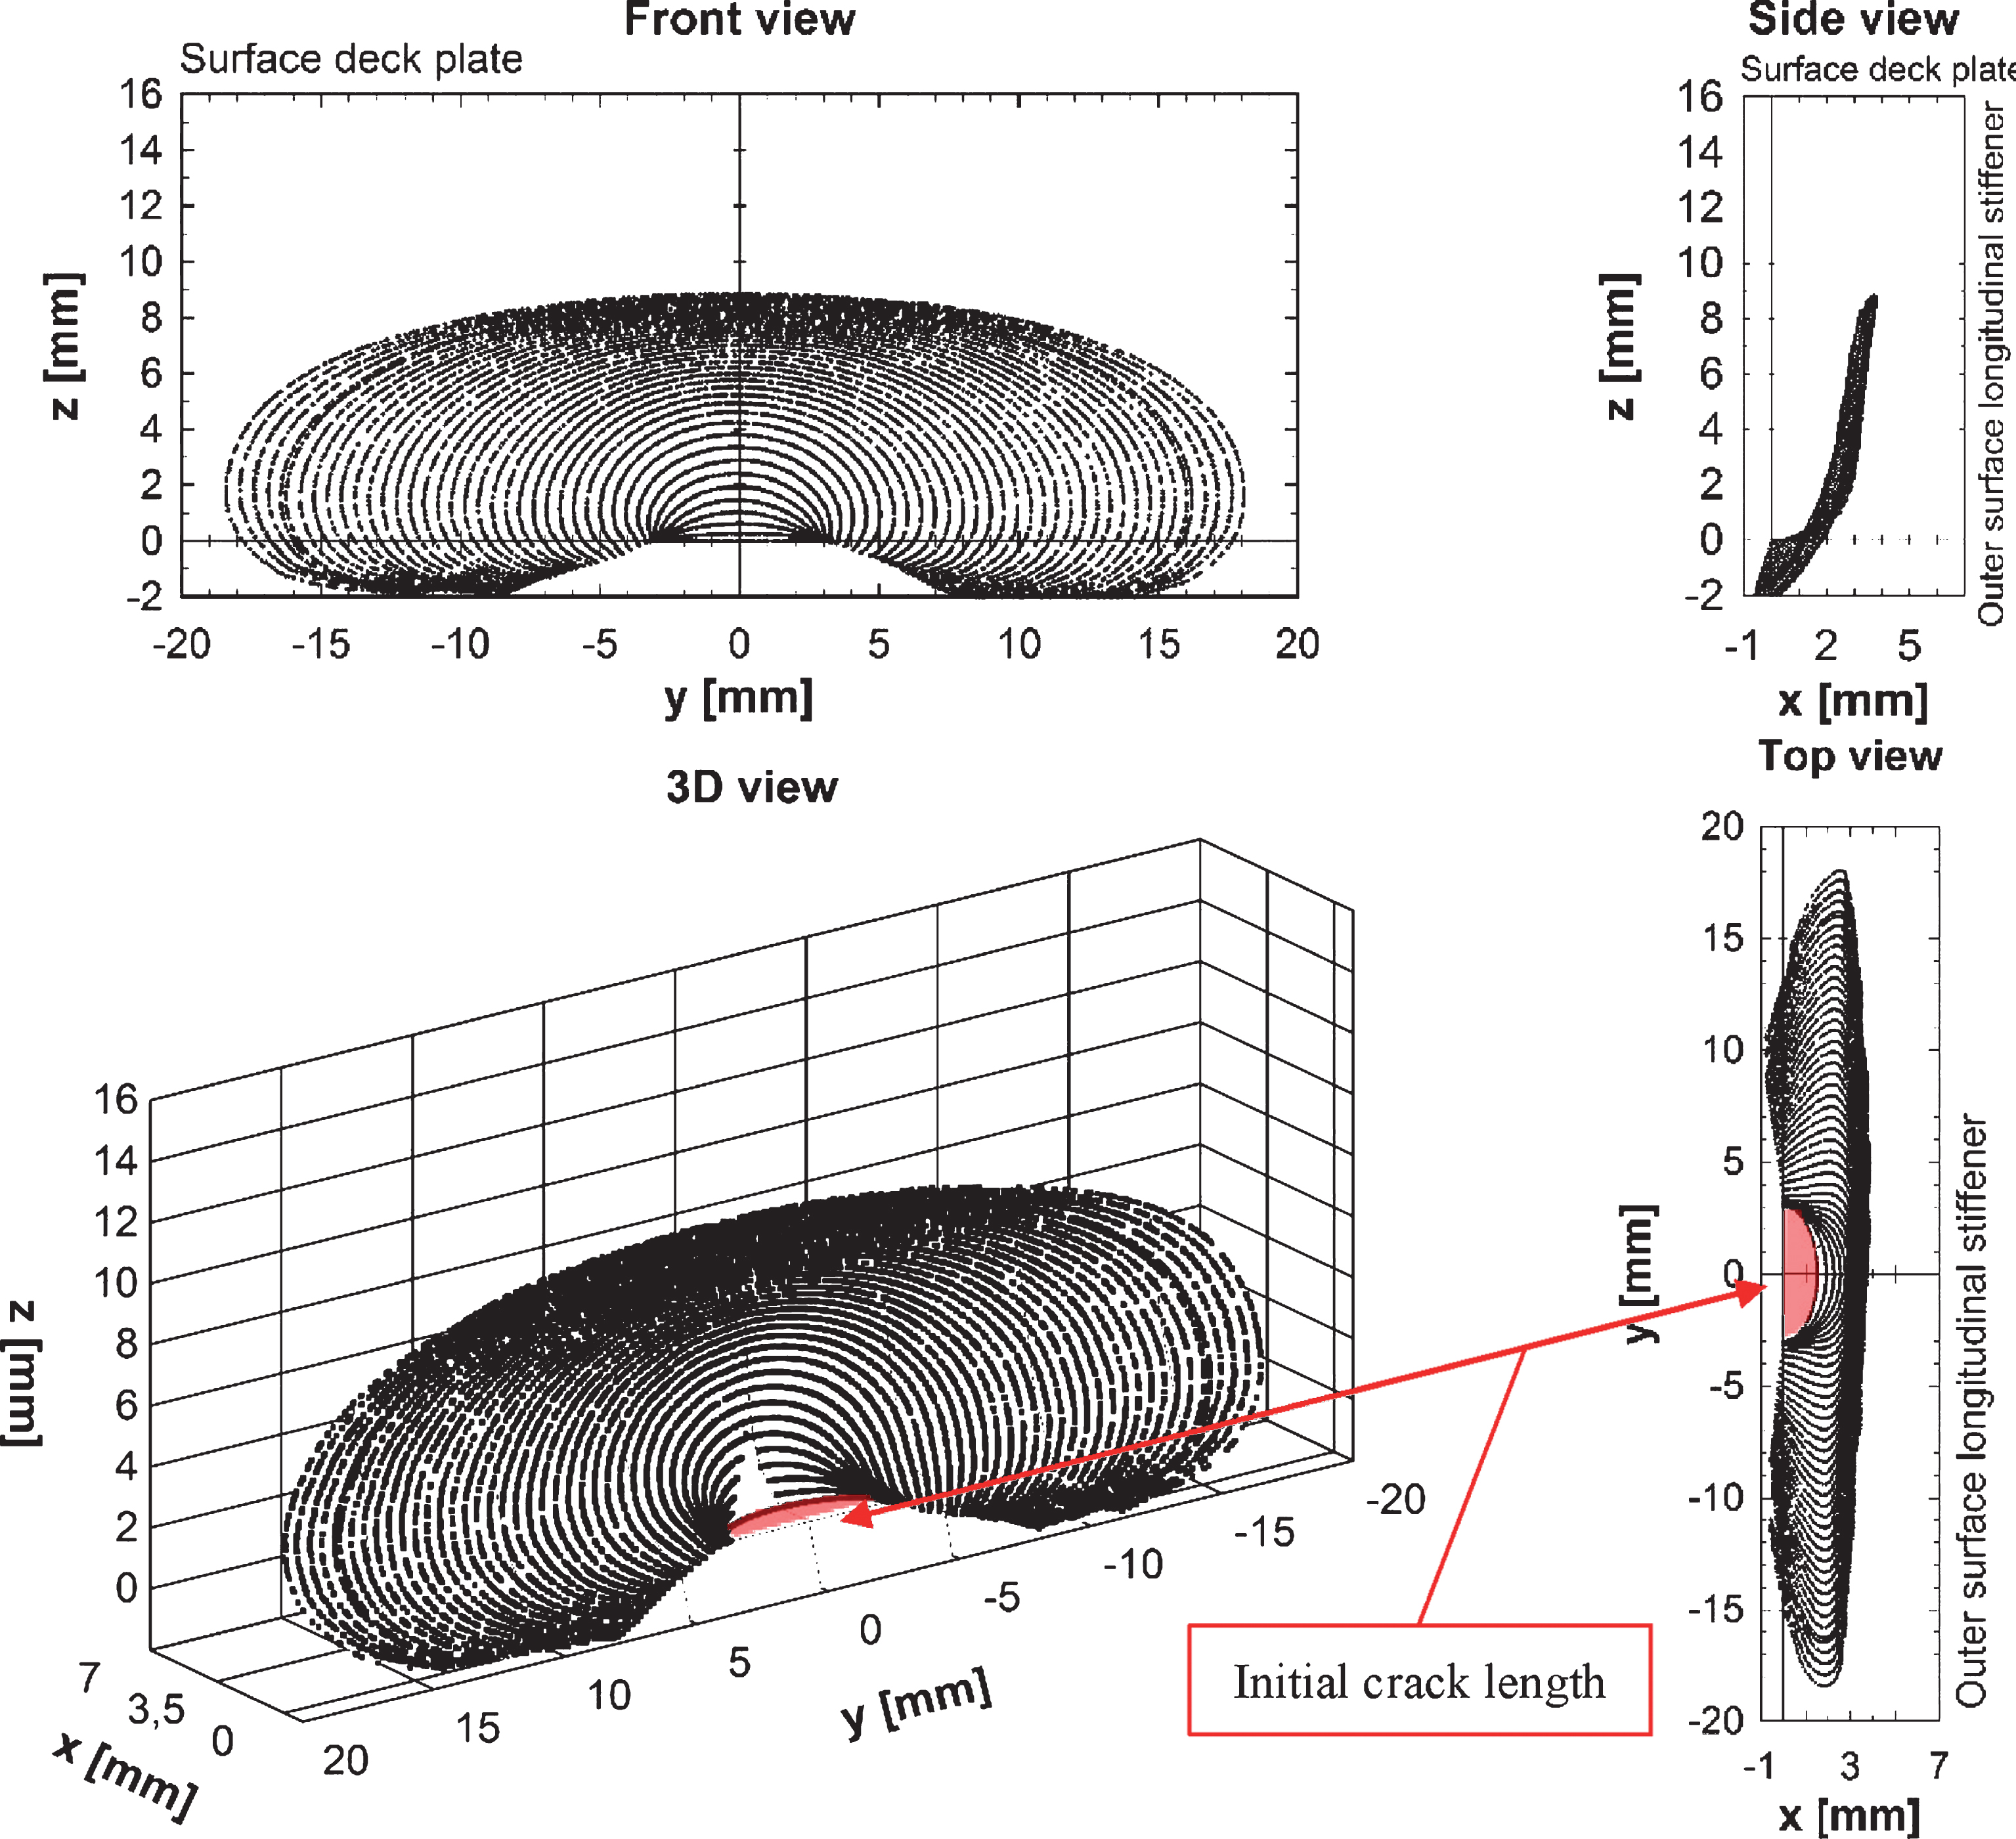
As is generally accepted, the evaluation of the geometry dependent parameter f(a) is of major importance to quantify the fatigue behaviour of the detail being studied. This parameter is defined by fracture mechanics and is a good indication of the crack propagation. As illustrated in Fig. 8, the XFEM calculations result in a detailed visualization of the crack propagation behaviour through the deck plate. For every time step and curvilinear location along every crack front, the SIF-values are determined. Due to computational or convergence problems, the crack propagation could only be simulated up to a half-length of approximately 18 mm in longitudinal direction which is complying with the welding direction. To overcome this problem, larger initial crack fronts are evaluated with a half-length of 25 mm and 50 mm. It is assumed that at this point, the crack has already fully penetrated the deck plate. Therefore, the crack front inside the material is reduced and less degrees of freedom are necessary.
Fig.8
XFEM crack simulation including the initial semi-elliptical crack length.
To investigate the influence of different thicknesses used for the deck plate and the longitudinal stiffeners, different plate thicknesses are used: 6 mm, 7 mm and 8 mm for the longitudinal stiffener and 12 mm, 14 mm and 16 mm for the deck plate. Figure 9 illustrates all the calculated f(a) values for these thicknesses. For the evaluation of the fatigue life and the corresponding crack length, a best-fit curve has to be fitted to these data points.
Fig.9
Geometrical dependent parameters f(a) for different deck plate and stiffener thicknesses. Legend: S = stiffener – number = thickness of the stiffener – D = deck plate – number = thickness of the deck plate. Left: f(a) curves grouped per stiffener thickness. Right: f(a) curves grouped per deck plate thickness.
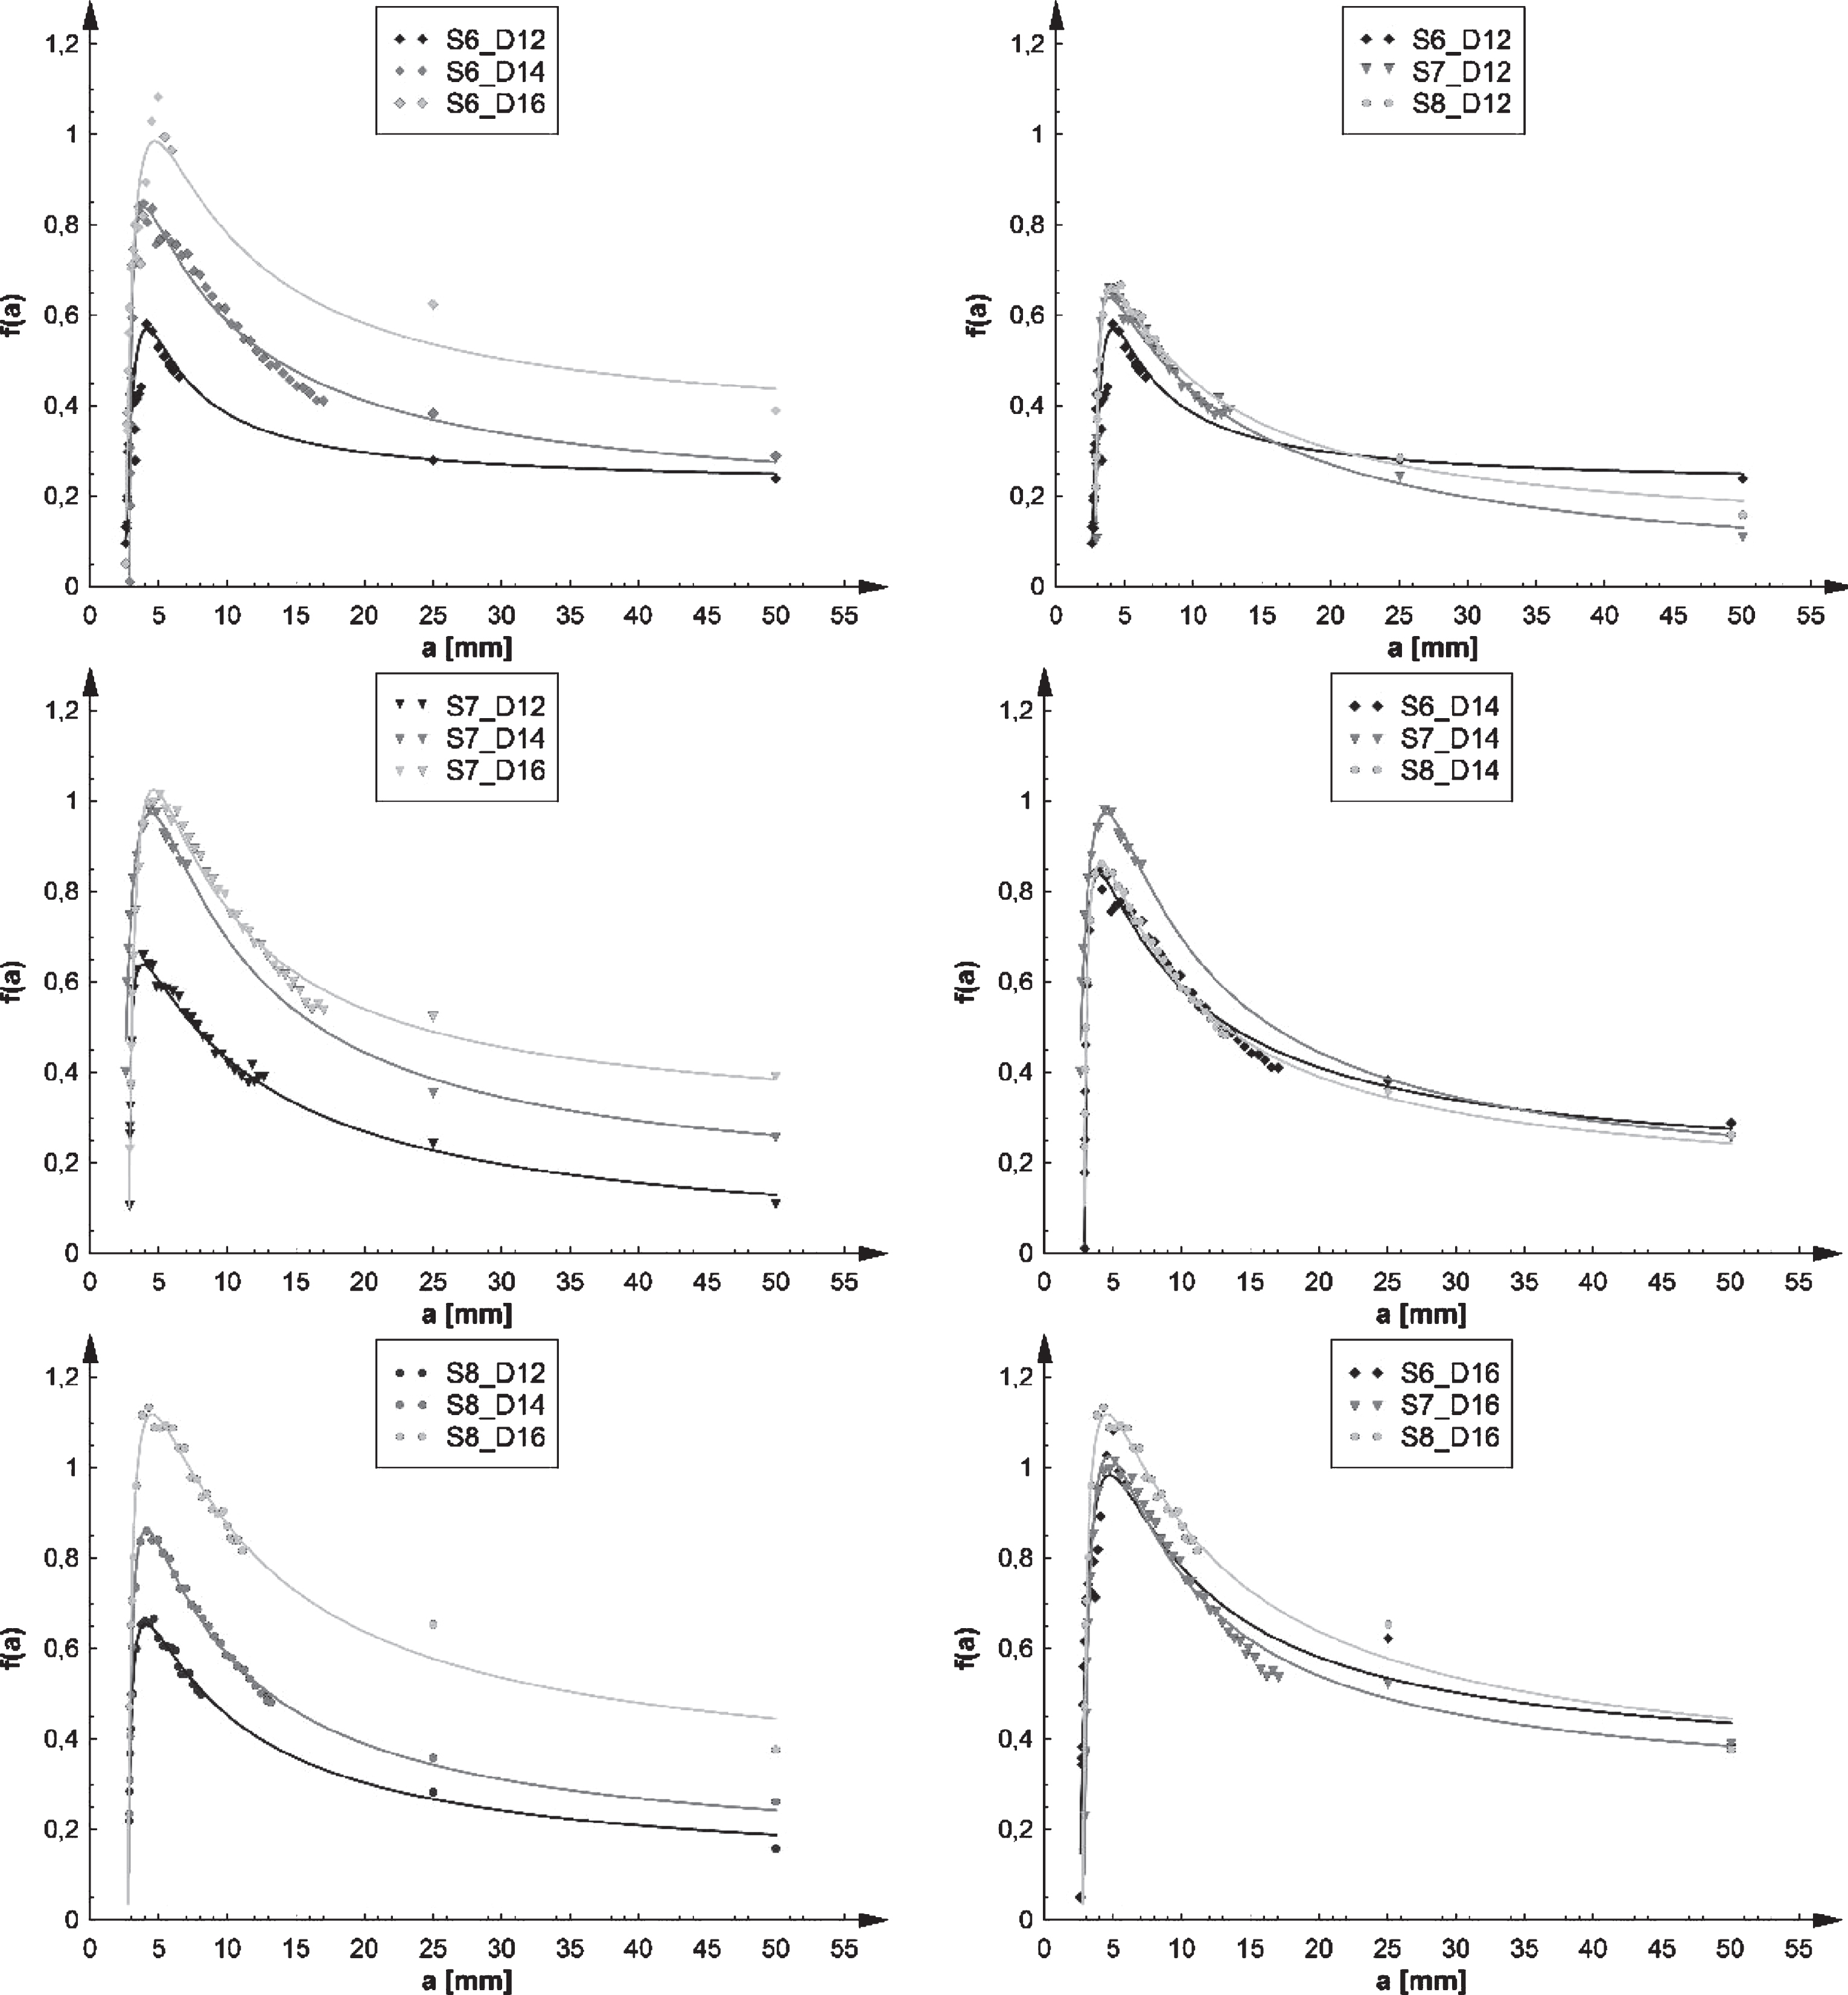
In addition to the plotted best-fit curves Fig. 9, Table 2 gives the corresponding R-square values. A clear trend is visible and the best-fit curves have a great reliability.
Table 2
R-square value of best-fit curves. Stiffener-to-deck plate detail: S = stiffener - number = thickness of the stiffener - D = deck plate - number = thickness of the deck plate
| Stiffener-to-deck plate detail | S6_D12 | S6_D14 | S6_D16 | S7_D12 | S7_D14 | S7_D16 | S8_D12 | S8_D14 | S8_D16 |
| R-square | 0.95 | 0.99 | 0.99 | 1.00 | 0.97 | 0.98 | 0.99 | 1.00 | 0.99 |
In the f(a) curves, it is clear that the longitudinal stiffener thickness has no major influence on the profile of the curve. In the deck plate however, a large shift is sometimes noticeable. Although higher values of f(a) result in a faster crack propagation, these higher values apply to thicker deck plate cases only. In these deck plates, the stresses at the weld root are much smaller and will therefore result in a lower crack propagation than smaller deck plates.
3.4Fatigue life
When combining the best-fit curves of f(a) with equations for crack length, the crack length in function of time can be plotted. According to the same graphs of f(a), the fatigue life up to a service life of 100 years is illustrated in Fig. 10. When looking at the left graphs where the curves are grouped by the thickness of the longitudinal stiffener, the crack grows much faster in thinner deck plates. This results from the reduced applied stress at the weld root due to the capability of spreading the loads over multiple longitudinal stiffeners. When looking at the graphs on the right where the curves are grouped based on the thickness of the transverse stiffener, the opposite is true. The crack seems to grow faster when the thickness of the stiffener is increased. A possible explanation is the increased stiffness of the closed trapezoidal stiffener. Therefore, the stiffener close to the applied load attracts the stresses in the deck plate. As illustrated in Fig. 9, the f(a) curves for the same deck plate thickness are almost identical. A small difference in the stresses at the weld root causes large differences in the crack growth due to the cubic equation.
Fig.10
Fatigue life for different deck plate and stiffener thicknesses. Legend: S = stiffener – number = thickness of the stiffener – D = deck plate – number = thickness of the deck plate. Left: fatigue life curves grouped per stiffener thickness. Right: fatigue life curves grouped per deck plate thickness.
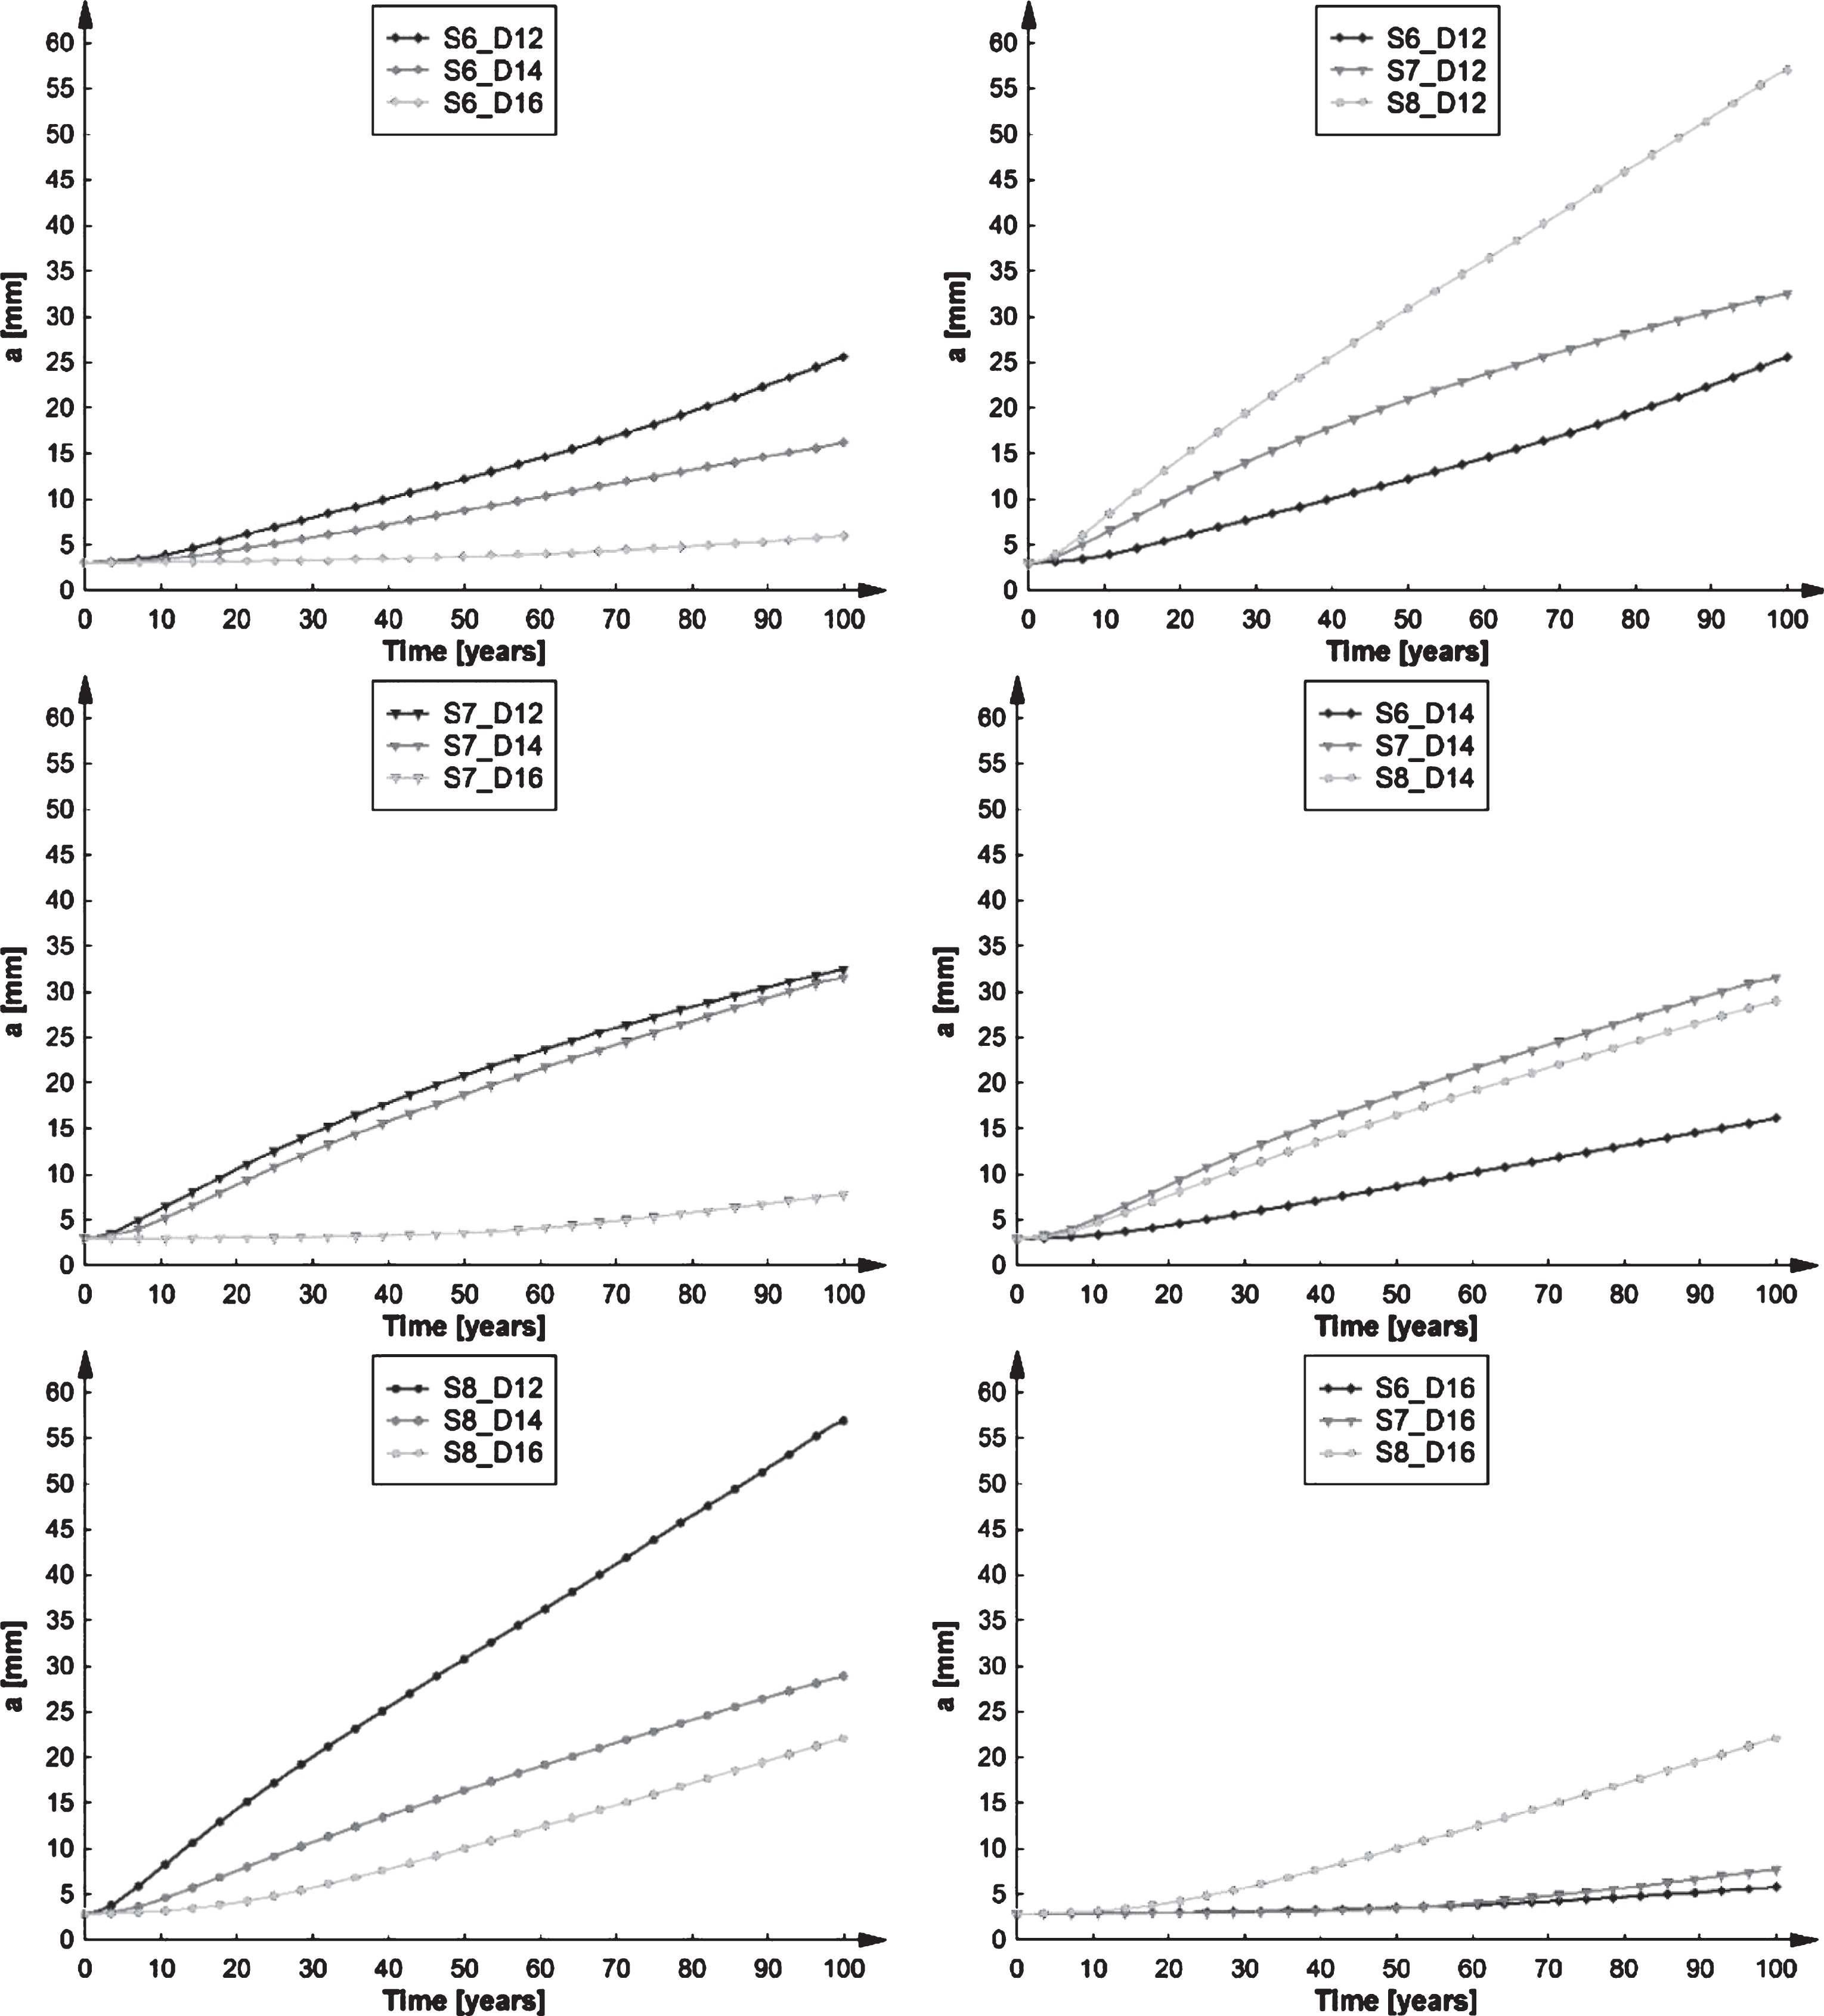
The calculated fatigue life is summarized in Table 3. This corresponds with the time where the crack has fully penetrated the deck plate. Although not included in this paper, also the f(a) curves for the direction through the deck plate was calculated. With these curves, the total crack length through the deck plate could be validated next to the longitudinal ones. Within the service life of 100 years, this was only the case for a stiffener thickness of 8 mm and a deck plate thickness of 12 mm. The fatigue life in this case is 41.84 years. This rather low result corresponds with the fatigue crack that was observed in the Temse Bridge. In all the other cases, the crack still has not penetrated the deck plate. Table 3 also lists the amount of crack propagation through the deck plate after 100 years of service life in percentage. According to these results, the best option in a truss bridge is to have a thick deck plate and a slender stiffener. But in the case of the Temse Bridge, a solution can already be found in using a stiffener of 7 mm instead of 8 mm. Therefore, the effect of using a light weighted construction is really present. This also confirms that using thicker deck plates increases the fatigue life. However, this is not always the necessary, especially when thick plates of 15 mm are used in new orthotropic bridge deck designs.
Table 3
Amount of crack propagation through the deck plate at 100 years and the corresponding fatigue life. Stiffener-to-deck plate detail: S = stiffener - number = thickness of the stiffener - D = deck plate - number = thickness of the deck plate
| Stiffener-to-deck plate detail | S6_D12 | S6_D14 | S6_D16 | S7_D12 | S7_D14 | S7_D16 | S8_D12 | S8_D14 | S8_D16 |
| Crack propagation through | – | 63 | 10 | 75 | 70 | 31 | 100 | 77 | 66 |
| deck plate at 100 yeats [% ] | |||||||||
| Fatigue life [years] | – | >100 | >100 | >100 | >100 | >100 | 41.84 | >100 | >100 |
Finally, the effect of random loads is compared to fixed sequences. With the current fatigue design methods, the Palmgren-Miner method is used. This method is not very accurate since the load history and the load sequences do not have any effect on the fatigue resistance. With LEFM however, it is possible to take the load sequence into account. In Fig. 11 a comparison is made between a random sequence and two fixed sequences. Sequence 1-2-3-4-5 corresponds with the set of equivalent lorries described in Eurocode using the same order. This agrees with using the smaller lorries first and ending with the heavy lorries. Sequence 5-4-3-2-1 is the opposite.
Fig.11
Random sequence of applied loads versus fixed sequences.
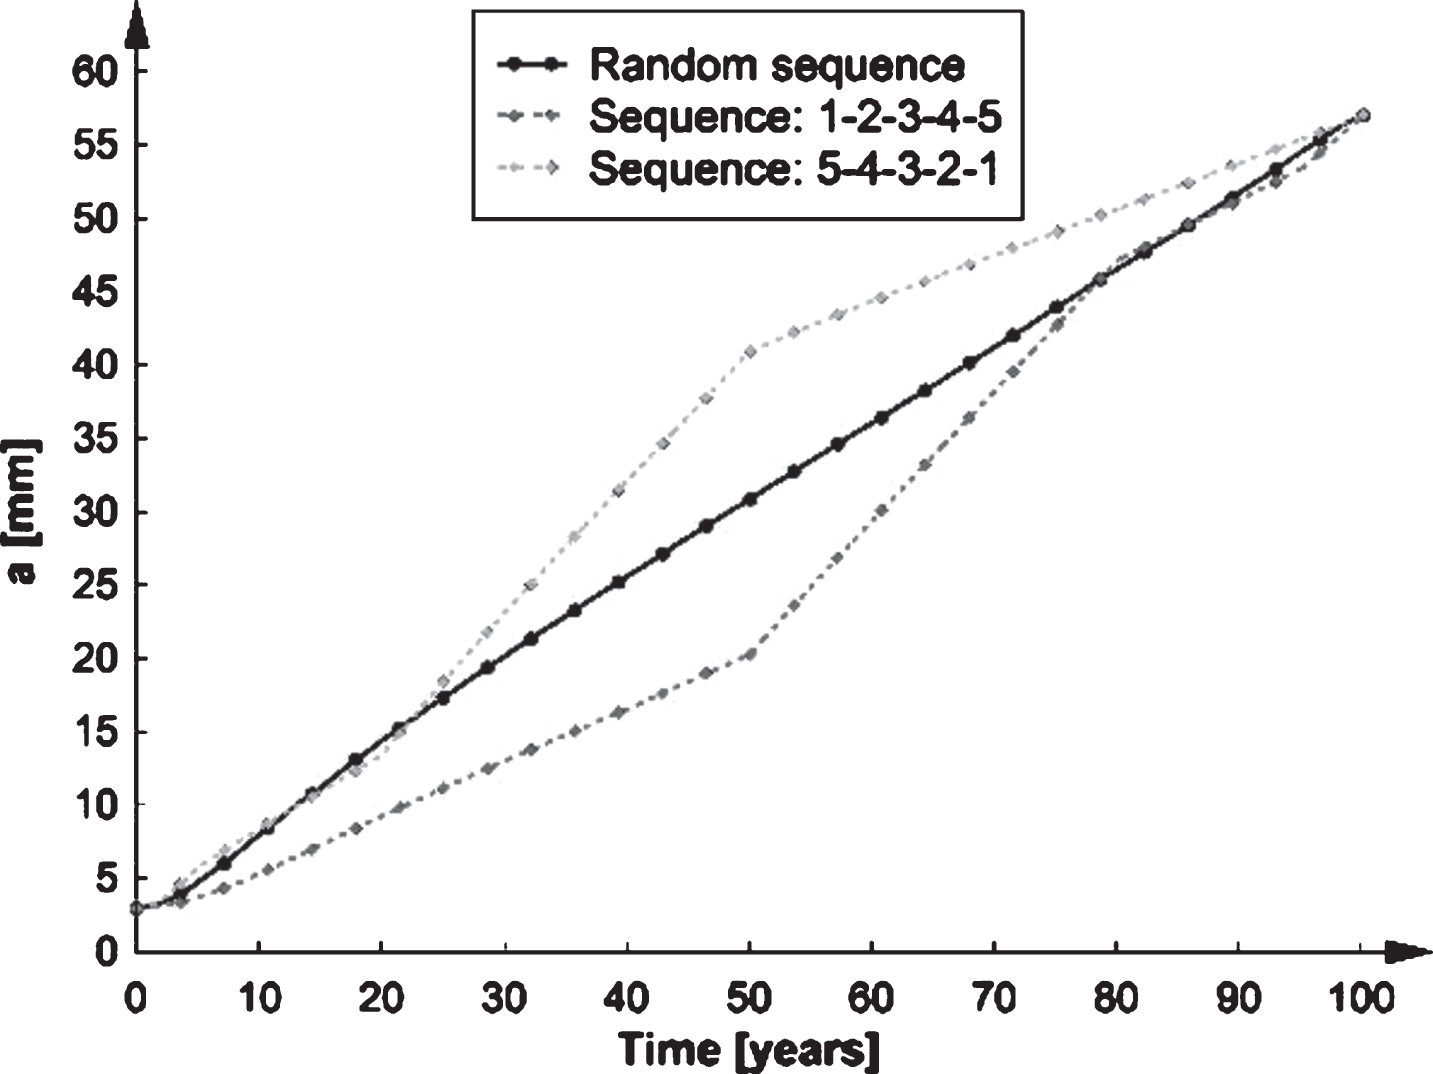
It is clear that the load sequence has an influence on the crack propagation. When first using lower loads and ending with heavy loads, the crack propagation is much lower at the beginning when compared with first using heavy loads and ending with lower loads. Remarkably, at the end of the calculated service life, it does not matter if a random sequence or a fixed one is used. This means that no real memory effect is present in the fatigue calculation with LEFM.
4Conclusions
Based on the first few paragraphs of this paper, dealing with the influence of wearing courses, a number of conclusions can be given:
• Fatigue does not really form a problem for the considered design and combination of deck plate thickness and stiffener thickness;
• A choice for a slightly thinner deck plate would have an immediate negative influence on the overall fatigue behavior and could only be compensated by considerably thicker wearing courses;
• However, using a thicker deck plate would, while having a positive influence on the fatigue life, result in an overall weight problem for the movable bridge.
Using LEFM as a fatigue assessment tool has many benefits compared to the current fatigue designs with Eurocode. It is a more in-depth method resulting in the evaluation of both the crack growth direction and the crack propagation. The advantages of this method can be combined with the implementation of the initial stress state due to dead load and residual stresses. By doing this, a more realistic crack path can be evaluated. For all different stiffener-to-deck plate geometries studied in this paper, all cracks propagated through the deck plate.
When comparing the crack propagation for all different geometries, it can be concluded that an increased deck plate thickness increases the fatigue life of the stiffener-to-deck plate detail. However, this is not the case when looking to the thickness of the stiffeners web. Thicker stiffeners attract more stresses at the weld root resulting in faster crack propagation. The solution of keeping the advantages of a light weighted construction relies on reducing the thickness of the closed trapezoidal stiffeners and increasing the thickness of the deck plate, although the latter should be limited as well. In addition, the reduced thickness of the closed trapezoidal stiffeners is limited as well when looking the global displacements of the deck plate.
Using the Palmgren-Miner method in current design methods does not allow for accounting for the actual load sequences. When using LEFM, such an analysis can be performed. The effect of using fixed load sequences can have a major influence on the crack propagation. Although, when looking at the final crack at the estimated service life of the bridge deck, the crack propagation curves for both random and fixed sequences are coinciding in the end. Therefore, the load sequence has no influence when looking at the final stage of the fatigue life.
References
[1] | Eurocode 3, Part 2. Design of steel structures – Part 3: Steel bridges, EN 1993-2:2007/AC:2009, CENT/TC 250 – Structural Eurocodes, (2015) . |
[2] | Eurocode 3, Part 1-9. Design of steel structures – Part 1-9: Fatigue, EN 1993-1-9:2005/AC:2009, CENT/TC 250 – Structural Eurocodes, (2015) . |
[3] | Kolstein MH . Fatigue classification of welded joints in orthotropic steel bridge decks, PhD thesis, Delft University of Technology, The Netherlands, (2007) . |
[4] | Nagy W , Diversi M , Van Bogaert Ph , De Backer H . Improved fatigue assessment techniques of connecting welds in orthotropic bridge decks, Proceedings of Eurosteel 2014 – 7th European Conference on Steel and Composite Structures, ECCS European Convention for Constructional Steelwork, Brussels, (2014) . |
[5] | De Backer H . Optimization of the fatigue behavior of the orthotropic plated bridge deck concept through better dispersion of traffic loads (in Dutch), Ghent University, Belgium, (2006) . |
[6] | FHWA-IF-12-027. Manual for Design, Construction, and Maintenance of Orthotropic Steel Deck Bridges, US Department of Transportation, Federal Highway Administration, (2012) . |


