
Hydrogen embrittlement testing and results of full-size ASTM A354 grade BD rods in the SFOBB
Abstract
To determine the hydrogen-embrittlement resistance of anchor rods in the new San Francisco-Oakland Bay Bridge, tensile tests of full-size ASTM A354 Grade BD anchor rods were conducted at very slow load rates. Resistance to embrittlement by hydrogen entering the rods while under load, also referred to as stress corrosion cracking (SCC) or environmental hydrogen embrittlement (EHE), was measured by performing the slow-load tests in 3.5% sodium chloride (NaCl) solution. Resistance to embrittlement by hydrogen entering the steel during fabrication processes such as hot-dip galvanizing, also referred to as internal hydrogen embrittlement (IHE), was measured by performing the slow-load tests in air. Testing was conducted on rods representing various sizes, different manufacturers, rolled and cut threads, different alloys, as well as galvanized and ungalvanized rods. Following slow-load hydrogen embrittlement tests, mechanical and chemical properties of the test rods were fully characterized, and fracture surfaces were examined by scanning electron and optical microscopy to establish modes of failure. The results of this work are discussed in terms of 1) material properties, such as strength level and hardness, and toughness; 2) processing variables, including galvanizing, and threading method; 3) the cause of failure of 32 anchor rods in March, 2013; and 4) establishment of safe loads for rods currently in service on the bridge.
1Introduction
During the first two weeks of March 2013, 32 of the 96 three-inch-diameter, ASTM A354 Grade BD (A354BD) high-strength rods at Pier E2 fractured at their lower ends where they had been exposed to water accumulated in the duct. These rods were used to tie down the S1 and S2 shear keys of the Self-Anchored Suspension (SAS) bridge superstructure to the east pier. The fractures occurred a few days after the rod tensioning, and a few months before the scheduled opening of the New East Span of the San Francisco-Oakland Bay Bridge (SFOBB). With a 33% failure rate, decision was made to abandon all of these 96 rods at Shear Keys S1 and S2, and an alternative anchoring system was designed and constructed. In addition, the California Department of Transportation undertook a testing program of unprecedented breadth and depth to ascertain the cause of the rod failures and to evaluate the suitability of all remaining A354BD rods on the bridge. See Figs. 1 and 2.
The extensive test program included standard mechanical and chemical testing of the rods as well as detailed evaluation of the hardness and microstructure of the rods. Full-size tests were conducted in conjunction with small scale tests of the threaded rods. These tests were referred to in the testing program as Tests I through Test VI [2].
In this paper, the full-size, slow-loading hydrogen embrittlement test, known as Test IV - the “Townsend Test,” is described.
2The Townsend Test and 1975 work
The “Townsend Test” is a full-diameter, accelerated stress corrosion cracking (SCC) test developed to directly address the failure of the 32 rods on the structure at Pier E2 (called the 2008 rods because of the year of manufacture) and to evaluate the resistance thresholds of other rods on the bridge to SCC. The test is modeled after the work published in 1975 [4] to confirm Boyd and Hyler’s earlier study of high-strength bolts [1]. The 1975 work evaluated the effects of galvanized coatings on thresholds for both internal hydrogen embrittlement (IHE) and environmental hydrogen embrittlement (EHE) of pre-cracked, quenched-and-tempered SAE 4140 steel bars.
2.1Test design
The objective of the test is to determine the susceptibility, as a percentage of the specified minimum ultimate tensile strength (% Fu), for the SAS rods to stress corrosion cracking in their threaded and galvanized condition (without introducing a pre-crack). The results of the test would identify the safe load levels of the remaining galvanized A354BD rods on SAS, and, if necessary, suggest remedial actions for them.
To achieve this goal, samples of the actual remaining rods were tested, which consisted of full-length rods removed from the structure, rod sections partially removed from the structure, spare rods, and newly manufactured rods. These samples represented a variety of sizes, compositions, and manufacturing process variables. Samples were exposed to NaCl solution while simultaneously subjected to slowly increasing tensile load steps until failure.
2.2Test protocol
Full-diameter test samples were installed in specially designed and fabricated test rigs that included wet chambers containing 3.5% NaCl solution in which the threaded parts of the rods were submerged. The applied load was increased incrementally by means of hydraulic jacks and held at each step for 48 hours up to a maximum load of 0.85 Fu. This is sufficiently above the highest sustained load of 0.70 Fu for the A354BD rods in the structure. Step loads beyond 0.85 Fu were not performed for safety reasons. In the event the rod does not fail at the maximum applied sustained load (0.85 Fu) after being held for 140 hours, the rod is then pulled to failure. Seventeen rods were tested for EHE and an additional two for IHE for a total of 19 rods tested. Following the failure of the rods, whether during a sustained load step or a pull to failure operation after the maximum applied sustained load step of 0.85 Fu, a post-fracture evaluation was performed to ascertain the mode of failure by examining the fracture surface under a scanning electron microscope, and to further characterize the microstructure of the alloy and provide other pertinent characteristics.
Table 1 lists rods selected for the test. These included full-length rods when available. The rods ranged in diameters from 2 to 4 inches, different manufactures, with both cut and rolled threads, different alloys, and both galvanized and ungalvanized. These rods represent a range of steel compositions, fabrication practices, and toughness.
The test was split into 5 phases as follows:
Phase 1 examined the 2010 Rods at Pier E2. These rods were subjected to the same sustained load as the 2008 Rods at E2 that had failed, but they were manufactured differently and not exposed to water during the bridge construction. This first phase of the test was of critical importance to determine if there was a wider issue with the rods on the SAS. These 2010 rods were installed in the same pier cap to the same stress level as the 2008 rods which failed. It was important to determine if these rods could remain in place.
Phase 2 examined several different types of rods from other areas of the SAS. These rods had different fabrication processes and/or material properties (as determined in previous testing). Many of these rods are subject to lower sustained loads on the SAS, but it was an important next step after Phase 1 to determine if there was a wider issue with the rods on the SAS.
Phase 3 examined the 2008 Rods at Pier E2 that had previously failed. This was to correlate test results with the events at Pier E2 where rods had broken.
Phase 4 examined newly manufactured 2013 Rods that were planned to be used in the structure to replace rods removed for previous testing (including Phase 1 of the Townsend Test). This phase included testing material with a different alloy than was used in the other phases and testing galvanized/ungalvanized material from the same heat. Phase 5 examined the 2008 Rods without NaCl solution to determine if the results from Phase 3 were from EHE or IHE.
Prior to testing, all rods were checked for cracks by use of magnetic particle inspection, and cleaned.
The loading schedule for the test is shown in Table 2. The rate of loading is intended to be sufficiently slow to permit diffusion of hydrogen and slow crack growth, yet fast enough to allow testing to be completed within 24 days. The average rate of load increase shown in Table 2, up to 0.85 Fu, is approximately one-half that used to establish thresholds of one-inch square bars in the 1975 research [4]. In those cases, where the load reached 0.85 Fu, or when the onset of crack growth was suspected, the rods were held for six days. After the six-day hold without evidence of cracking, the rods were pulled to failure, which generally occurred above 1.0 Fu. Upon failure, sections of the rod were transported to laboratories for post-fracture analysis.
2.3Test rig design
With applied loads up to 1.86 million pounds, the scale of this test is unprecedented for hydrogen embrittlement testing. Test rigs were carefully designed and fabricated. Rig details varied to accommodate the various lengths and diameters of rod samples for each test. A typical test rig is shown in Fig. 3. The test rig shown accommodated full-length rods and had wet chambers at both ends containing 3.5% NaCl solution in which the tensioned threads of the rod were submerged. This solution is widely used throughout the industry for EHE testing of high-strength steel, and is considereda worst-case simulant of the environment to which the rods could be exposed if the corrosion protective measures were not applied. In cases where full-length rods were not available for testing, a smaller, threaded-end segment of the rod was tested in a single wet chamber located at the dead end of the rig, with the load applied to a coupled jacking rod at the stressing end of a shorter test rig.
Tensioning of the rods was similar to the method used to load rods on the SAS. Hydraulic jacks, shown at the stressing end to the right in Fig. 3, were used to apply a tensile load above the target level. The nut was then snug-tightened and the hydraulic pressure was released to allow the rod to seat itself within a tolerance of – 0/+10 kips of the target load. Strain gauges were used to monitor the load on the rods during load application and throughout the entire duration of the test.
During all tests except the last two tests without wet chambers, electrode potential with respect to a reference electrode and the pH of the test solution were monitored. Also for Rods 1 to 4 only, electrode potentials were continuously measured against a hot dip galvanized A325 bolt, and these potential measures were verified in the laboratory in the ensuing post-fracture analysis against a saturated calomel electrode (SCE). For Rods 1 to 4 only, pH values were continuously measured by a pH probe, but the measurement bulb on the pH probes accumulated a deposit from the test solution and did not match measurements with pH paper. For the remaining tests, pH and potential were measured manually by use of pH paper and SCE at each load step.
Deliberate coating defects, also referred to as intentional holidays, were placed in the thread roots of three consecutive threads at the region of the initial engagement with the nut by use of a diamond impregnated wire. The intentional holidays were intended to locally remove the galvanized coating and to promote the galvanic deposition of hydrogen on the steel surfaces at the roots of threads.
In the case of full-length rods with wet chambers at both ends, the defects were introduced around the full circumference of the first three engaged threads at the dead end only. For the shorter rods with wet chambers only at the dead end, the defects were introduced only to the top third of the circumference of the first three engaged threads.
Other features of the test include:
– Two sets of four strain gauges were mounted at 90-degree intervals around the rod circumference to detect axial and bending strains.
– Elongation and rotation during jacking were measured by use of displacement transducers at the stressing end.
– Temperatures of the rods, the test solution, and the ambient air were continuously monitored by use of thermocouples.
– Acoustic emission (AE) sensors were placed to provide warnings when final fracture was about to occur, thus providing safety to test personnel as a primary objective. A secondary objective was to assess if AE can detect the onset of cracking.
– The test rigs were surrounded with sand bags, steel plates, and k-rail for safety purposes.
– The test rigs were sheltered from rain and direct sunlight by use of tents.
Figures 4 and 5 showed overall views of the test set-ups. Figure 5 also shows tanks of NaCl solution, a siphon system which replenished solution continuously, and provided access on the stressing end to tighten the nut. Figure 6 shows the test rig and the rod at the end of the test, after fracture.
For all the wet chambers in the test rigs, the spherical washer had a groove to permit venting of the NaCl solution (See Fig. 7). This was to ensure flow of the NaCl solution to the first thread of the nut and remove any trapped air. After verifying the flow of the NaCl solution, the groove was sealed with closed cell backer rod, which was held in place with plumber’s putty. Because this operation happened with the rod under load, the acoustic emissions (AE) were continuously monitored for safety during thisoperation.
2.4Post-fracture analysis
After testing, a thorough failure analysis was conducted on each rod that fractured in the test set-up. Fracture surfaces of the rod went through a series of meticulously planned cleaning and preservation steps to prevent contamination and further corrosion, until their fractogrphy were determined under optical and scanning electron microscopes (SEM) in a laboratory. The main objectives of the SEM work were to determine whether 1) intergranular cracking was observed, as it is an indication of hydrogen embrittlement, and 2) crack arrest was present, as to evaluate if the onset of cracking had started in previous load steps prior to the failure.
The remaining pieces of the test rod were sectioned and underwent laboratory testing on their mechanical and chemical properties. Hardness and charpy impact toughness tests were conducted across the cross-section of the rod. Chemical analysis was conducted on the galvanized coating as well as the rod. The objective was to establish if the rods were manufactured within ASTM specifications and whether variations in mechanical and chemical properties would affect the rod’s threshold load level.
3Test results
A typical loading sequence is shown in Fig. 8. In this case, the load was increased stepwise to 0.85 Fu, where it was held until it fractured after 113 hours.
Electrode potentials of the rods and pH of the test solution typically varied during the course of the test as typified by Fig. 9. A slight increase in pH with time was attributable to the buildup of zinc ions in solution resulting from corrosion of the galvanized rod.
Electrode potentials measured during testing of the rods generally started at a level that is significantly less negative than the potential of – 1.06 Vsce normally exhibited by pure zinc and ordinary galvanized coatings. This result can be attributed to the composition and structure of the galvanized rod coatings, which were found to consist mainly of iron-zinc intermetallic compounds. The fact that the potentials of the iron-zinc intermetallic compounds are less negative than pure zinc means that galvanic activity and driving force for hydrogen evolution are alsoreduced.
These results are significant because EHE thresholds for high-strength steels are known to increase as the electrode potential rises to less negative levels [4, 5].
Figure 9 also shows that the electrode potential becomes less negative with time during the test. This rise is consistent with the selective dissolution of zinc from the coating, leaving behind a coating increasingly rich in iron, and less galvanic.
The results of the test are summarized in Table 3.
4Discussions
4.1Phase 1 — 2010 Rods at Pier E2 — Rods 1–4
For the 2010 Rods that were previously exposed (Rods 1 to 4), three (Rods 1, 2, and 4) failed at loads of 0.85, 0.80, and 0.85 Fu. Rod 3 did not fracture until pulled to failure at the end of the test. By convention, EHE thresholds are defined as the last load sustained without evidence of crack initiation. This leads to the threshold values of 0.80, 0.75, 0.85, and 0.80 Fu, for Rods 1–4, respectively, as shown in Table 3. Assuming that these rods are representative of an identical group, the threshold can be taken conservatively as 0.75 Fu.
Fracture surfaces of the 2010 Rods exhibited varying degrees of brittle failure originating at the initial engaged threads. Rod 3, which did not break during the step-load test and had to be pulled to failure, had the fewest intergranular features. Given the characteristics of the fracture surfaces, and the fact that tests were conducted in salt water, it is reasonable to conclude that Rods 1, 2, and 4 fractured as a result of EHE. A ‘holiday’ intentionally created in the galvanizing by rubbing a 0.012-inch-diameter diamond wire in the root of the three threads centered on the location of the first engaged thread of the nut. For Rods 1–4, the holiday was created on the dead end, while the jacking end was left as-is. Rod 1 and Rod 2 broke at the jacking end without any artificial holiday, while Rod 3 and Rod 4 broke at the dead end at the holiday. This indicates that initial coating defects are not required for the occurrence of EHE.
Each fracture surface was carefully examined for any evidence of crack arrest. A crack arrest would suggest that the fracture duration spanned a load step and so would be important in evaluating the results of the Townsend Test.
No crack arrest was found on any of the fracture faces examined. Rod 2 had a ridge feature that initially appeared to be a crack arrest during visual examination, but detailed examination of this feature on both fracture surfaces and from both sides of the longitudinal specimens revealed that the ridge feature was an anomaly that is probably related to the high inclusion count of that rod. It is concluded that true thresholds were achieved with the test.
4.2Phase 2 — Other Rods (with Cut or Rolled Threads) — Rods 5–11
None of the rods in this group failed until being pulled to failure at the end of the test. With the exception of Rods 6, 10, and 11, which were the only rods in Phase 2 with cut threads, all broke at locations away from the thread engagement with the nut and showed no evidence of intergranular cracking in the SEM examination. This indicates that rolled threads have a significant beneficial effect, even in the case of Rod 7 with low toughness.
Rod 6, with cut threads, did not break but rather had stripped threads during the pull to failure final step after reaching 0.85 Fu. Wet MT found an indication in the rod at the first thread engagement with the nut. The rod was bent to produce a fracture at the location of the MT indication. No intergranular cracking was observed during the SEM examination, indicating an EHE threshold of 0.85 Fu.
Rods 8 through 11 are all 3.5-inch diameter PWS anchor rods. Rod 8 and Rod 9, with rolled threads, did not exhibit intergranular cracking, indicating an EHE threshold of 0.85 Fu. Rod 10 and Rod 11, with cut threads, broke at the first thread engagement with the nut and displayed evidence of intergranular cracking during SEM examination.
This indicates that EHE initiated at 0.85 Fu, with an EHE threshold of 0.80 Fu for Rod 10 andRod 11.
A comparison between the results for Rods 8 and 9(rolled threads) and those for Rods 10 and 11 (cut threads) indicates that the EHE resistance of rolled threads is superior to that of cut threads. This is consistent with the work of others [3] who have found that thread rolling after heat treatment significantly increases resistance to stress corrosion cracking, owing to cold work and residual compressive stresses created at thread roots as a result of the thread rolling process.
4.3Phase 3 — 2008 Rods at Pier E2 — Rods 12–13
Both 2008 Rods failed at loads of 0.70 Fu, which indicates a threshold of 0.65 Fu. The macroscopic appearance of the fracture surfaces, and the intergranular nature of the fracture surface observed in the SEM, indicate that these rods failed by a hydrogen embrittlement mechanism. Given that the results of Phase 5 (as discussed below) show that the IHE threshold for this group of rods is significantly higher than 0.65 Fu, it can be unequivocally concluded that the rods in Phase 3 failed solely as a result of EHE. The similarities both in failure loads (0.70 Fu) and fracture appearances of the 2008 Rods in the test and that of the failures of the 2008 Rods that occurred on Pier E2 (see Fig. 10) demonstrate that the test is duplicating hydrogen damage as observed with the fractures of the 2008 Rods. It also demonstrates that soaking in corrosive water for long times is not necessary to produce EHE.
Hardness values near the outer surfaces of the 2010 Rods (Rods 1–4) and the 2008 Rods (Rods 12 and 13) are virtually identical at HRC 37. Two possible explanations for the lower threshold of the 2008 Rods as compared to the 2010 Rods at Pier E2 have been considered:
– Differences in the electrode potential between the 2008 rods (– 1.01 Vsce) and the 2010 rods (– 0.92 Vsce).
– Differences in the Charpy impact energy between the 2008 rods (14 to 15 ft-lbs) and the 2010 rods (37 to 38 ft-lbs).
Figure 11 provides an overview of the test results for the 2008 Rods. As seen in the illustration, threshold level varied based on the environments in which they were tested.
4.4Phase 4 — 2013 Rods at Pier E2 (Galvanized and Ungalvanized) — Rods 14– 17
All rods, both galvanized (Rods 14 and 15) and ungalvanized (Rods 16 and 17), which were fabricated from a different alloy (SAE 4340 as opposed to 4140), endured for the entire 24 days of testing, and were then pulled to failure at peak loads above 1.0 Fu. Moreover, evaluation of the fracture surfaces revealed only ductile fracture features. This indicates that the 2013 Rods are resistant to EHE up to the 0.85 Fu limit of the test, with or without a galvanized coating.
Assuming that the surface hardness is similar to that of the other rods in the test, the results of Phase 4 could indicate that the higher fracture toughness of the 2013 Rods resulted in greater resistance to EHE. However, it is noted that hardness profiles measured at the rod ends exhibited an M-Shape, which increases the possibility that the higher EHE threshold of the 2013 rods results from lower surface hardness.
Rod 14 failed at the first thread at the nut engagement, while Rods 15, 16, and 17 failed in a ductile manner with necking away from the nut. Intergranular cracking was not observed in any of these rods, which all exhibited ductile tensile or ductile shear fracture morphology under SEM.
The fact that all Phase 4 rods had to be pulled to failure after the six-day hold at 0.85 Fu also indicate that there is no significant effect of the galvanized coating on the EHE threshold of this very high-toughness material, up to the 0.85 Fu limit of the test.
4.5Phase 5 — 2008 Rods at Pier E2 Tested in the Dry — Rods 18–19
Phase 5 was conducted in the same manner as Phases 1 to 4, but without the presence of NaCl solution, thus ruling out any possibility of EHE. As such, Phase 5 is was a test for IHE of the rods as they were at the time of the test, whether or not hydrogen from fabrication had diffused out of the steel since samples were cut and extracted from Pier E2.
The 2008 Rods in Phase 5 endured the 24 days of testing without breaking and were then pulled to failure with a peak load of 1.15 Fu, which is the same as previous full diameter tensile tests. SEM examination found no evidence of intergranular cracking (SCC initiation). The IHE threshold is 0.85 Fu. The finding that the IHE threshold is significantly higher than the EHE threshold of 0.65 Fu for this material is in agreement with the findings of the 1975 publication [4].
The fact that the 2008 Rods in Phase 5 were unaffected by IHE up to at least 0.85 Fu means that the 2008 Rods in Phase 3, which broke at 0.70 Fu, could not have failed as a result of IHE. Because the characteristics of 2008 Rods that failed on the SAS are identical to those tested in Phase 3, it can be concluded that the mechanism of failure is fully consistent with EHE, and that there is no reason to believe that IHE was involved.
4.6Summary of test results
The test results are summarized as follows:
– The EHE threshold of the 2010 Rods at Pier E2 rods is 0.75 Fu.
– The EHE threshold of the 2008 Rods at Pier E2 rods is 0.65 Fu.
– The difference between the thresholds for the 2008 Rods and the 2010 Rods at Pier E2 can be attributed to differences in toughness and a higher iron content of the galvanized coating on the 2010 Rods (the higher iron content reduces the electrochemical driving force for hydrogen deposition on the steel).
– EHE threshold of the various 2010 Rods and 2006 Rods varies from 0.80 Fu to 0.85 Fu.
– The EHE threshold of 3.5-inch PWS rods with threads rolled after heat treatment is 0.85 Fu, and is superior to that of similar rods with cut threads, with a threshold of 0.80 Fu.
– The EHE threshold of the ungalvanized 2013 Rods at Pier E2 is 0.85 Fu.
– The EHE threshold of the galvanized 2013 Rods at Pier E2 is 0.85 Fu.
– The IHE threshold of the 2008 Rods is 0.85 Fu.
As shown in Fig. 12, the pretension load of the 2008 Rods (0.70 Fu) is higher than the corresponding EHE threshold (0.65 Fu), which is consistent with the failures that occurred at Pier E2. More importantly, these figures show that the design loads of all rods presently in service on the SAS are less than the corresponding SCC threshold levels determined in the test, and that with a supplemental corrosion barrier, the long term capacity of the A354BD rods is 1.0 Fu or greater.
5Conclusions
To determine the threshold load for hydrogen entering the steel from the environment due to corrosion (environmental hydrogen), the rods were loaded while immersed in 3.5% sodium chloride solution. The main results of these tests are:
– The 2008 Rods failed by hydrogen embrittlement at the same load (0.70 Fu) that resulted in failure on the SAS, and with similar fracture characteristics. This result provides confirmation that the Townsend Test duplicates the actual performance of these rods.
– All other groups of rods exhibited threshold loads greater than their design loads, indicating that the remaining rods are not susceptible to failure by hydrogen embrittlement at the design loads, even under the worst-case scenario of exposure to salt water.
A comparative study of the mechanical and chemical properties of the rods conducted after the Townsend Test indicates that the greater susceptibility to hydrogen embrittlement of the 2008 Rods may be correlated with lower toughness.
To explore the possibility that hydrogen already present in the steel (internal hydrogen) could have contributed to the low threshold of the 2008 Rods, the Townsend Test was repeated in air, without exposure to salt water. These tests showed a complete absence of hydrogen embrittlement. This result clearly demonstrates the following:
– Failures of the 2008 Rods in the wet Townsend Tests occurred as a result of environmentally induced hydrogen embrittlement (EHE).
– The 2008 Rods failed by EHE and would not have failed if they were protected from water.
– EHE thresholds for the other A354BD rods used on the SAS are above their in-service sustained loads, so they will not fail in a similar manner as the 2008 Rods failed at Pier E2.
References
[1] | Boyd WK , Hyler WS . Factors affecting environmental performance of high-strength bolts. Journal of Structural Division. (1973) ;99: (7). Print. |
[2] | Caltrans. San Francisco-Oakland Bay Bridge, Self-Anchored Suspension Bridge, Evaluation of theASTMA354 GradeBD Rods, 2014. |
[3] | Kephart AR . Benefits of Thread Rolling Process to the Stress Corrosion Cracking and Fatigue Resistance of High Strength Fasteners. Symposium on Environmental Degradation of Materials in Nuclear Power System – Water Reactors, (1993) . |
[4] | Townsend HE Jr . Effects of zinc coatings on the stress corrosion cracking and hydrogen embrittlement of low-alloy steel. Metallurgical Transactions A. (1975) ;6: (4):877–883. |
[5] | Tyler PS , Levy M , Raymond L . Investigation of the conditions for crack propagation and arrest under cathodic polarization by rising step load bend testing. Corrosion. (1991) ;47: (2):82–7. |
Figures and Tables
Fig.1
Self-anchored suspension span of the San Francisco-Oakland Bay bridge.
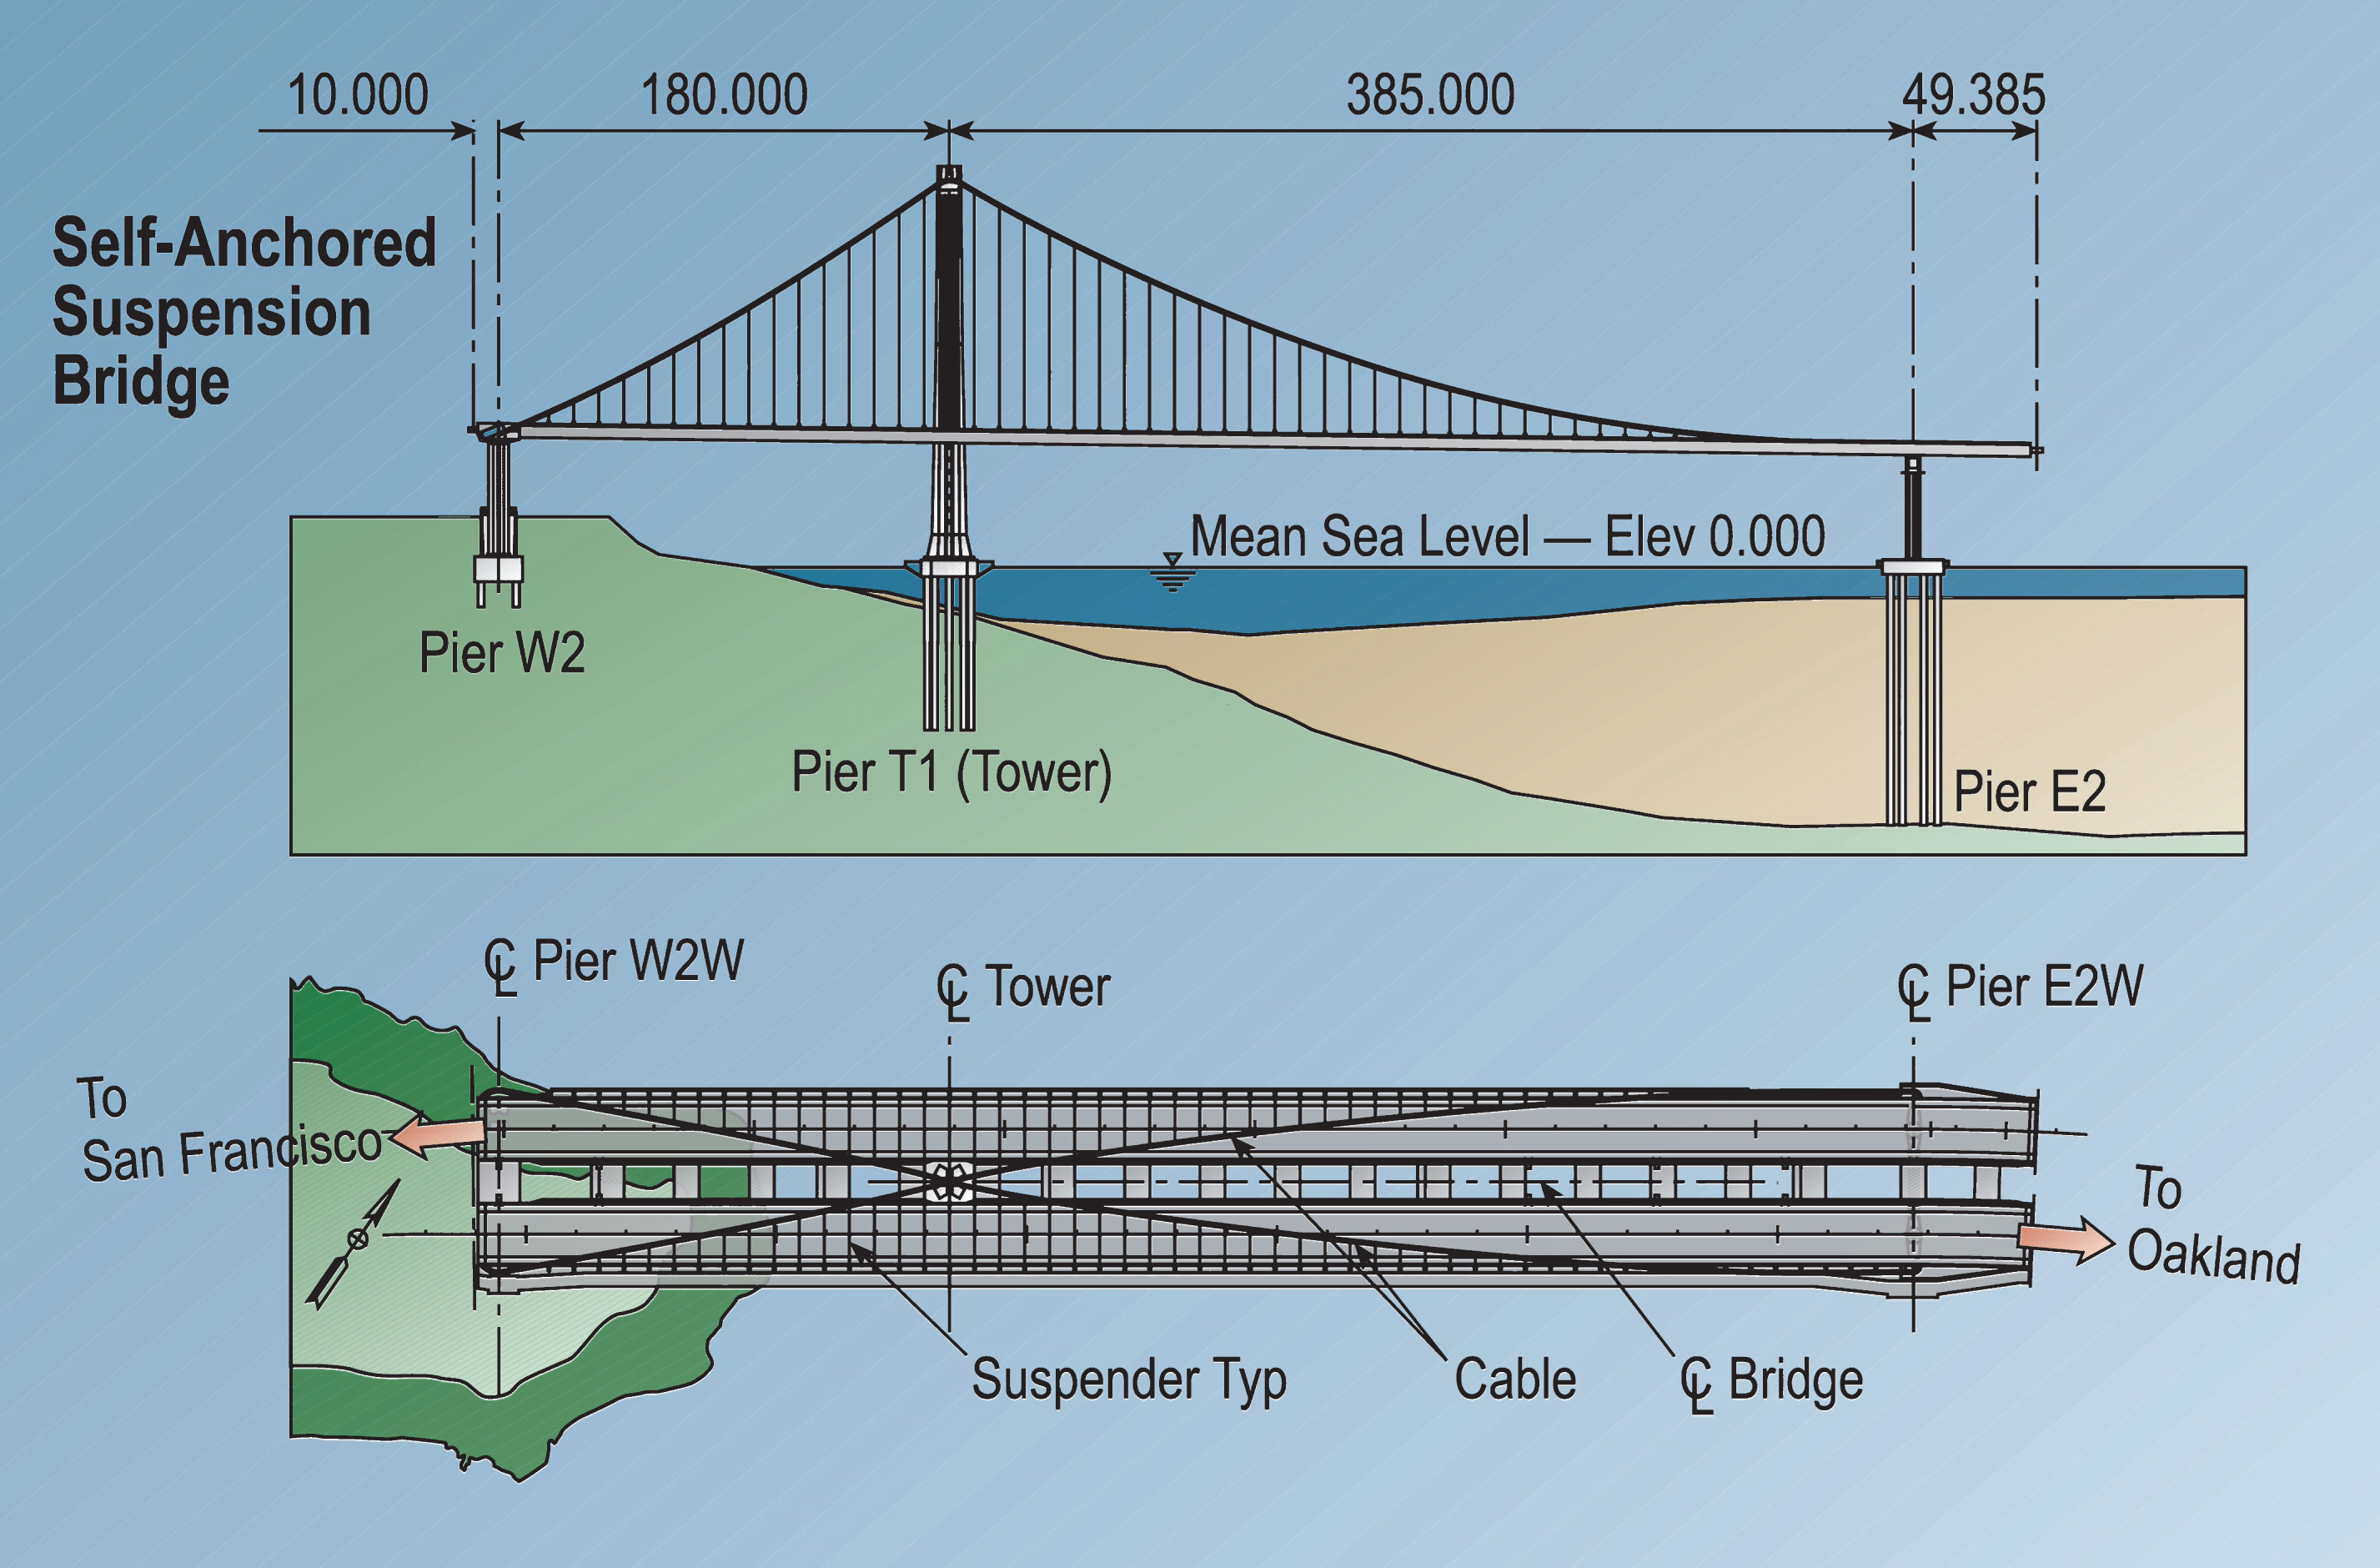
Fig.2
Fractured rod locations at S1 and S2 shear keys at pier 2.
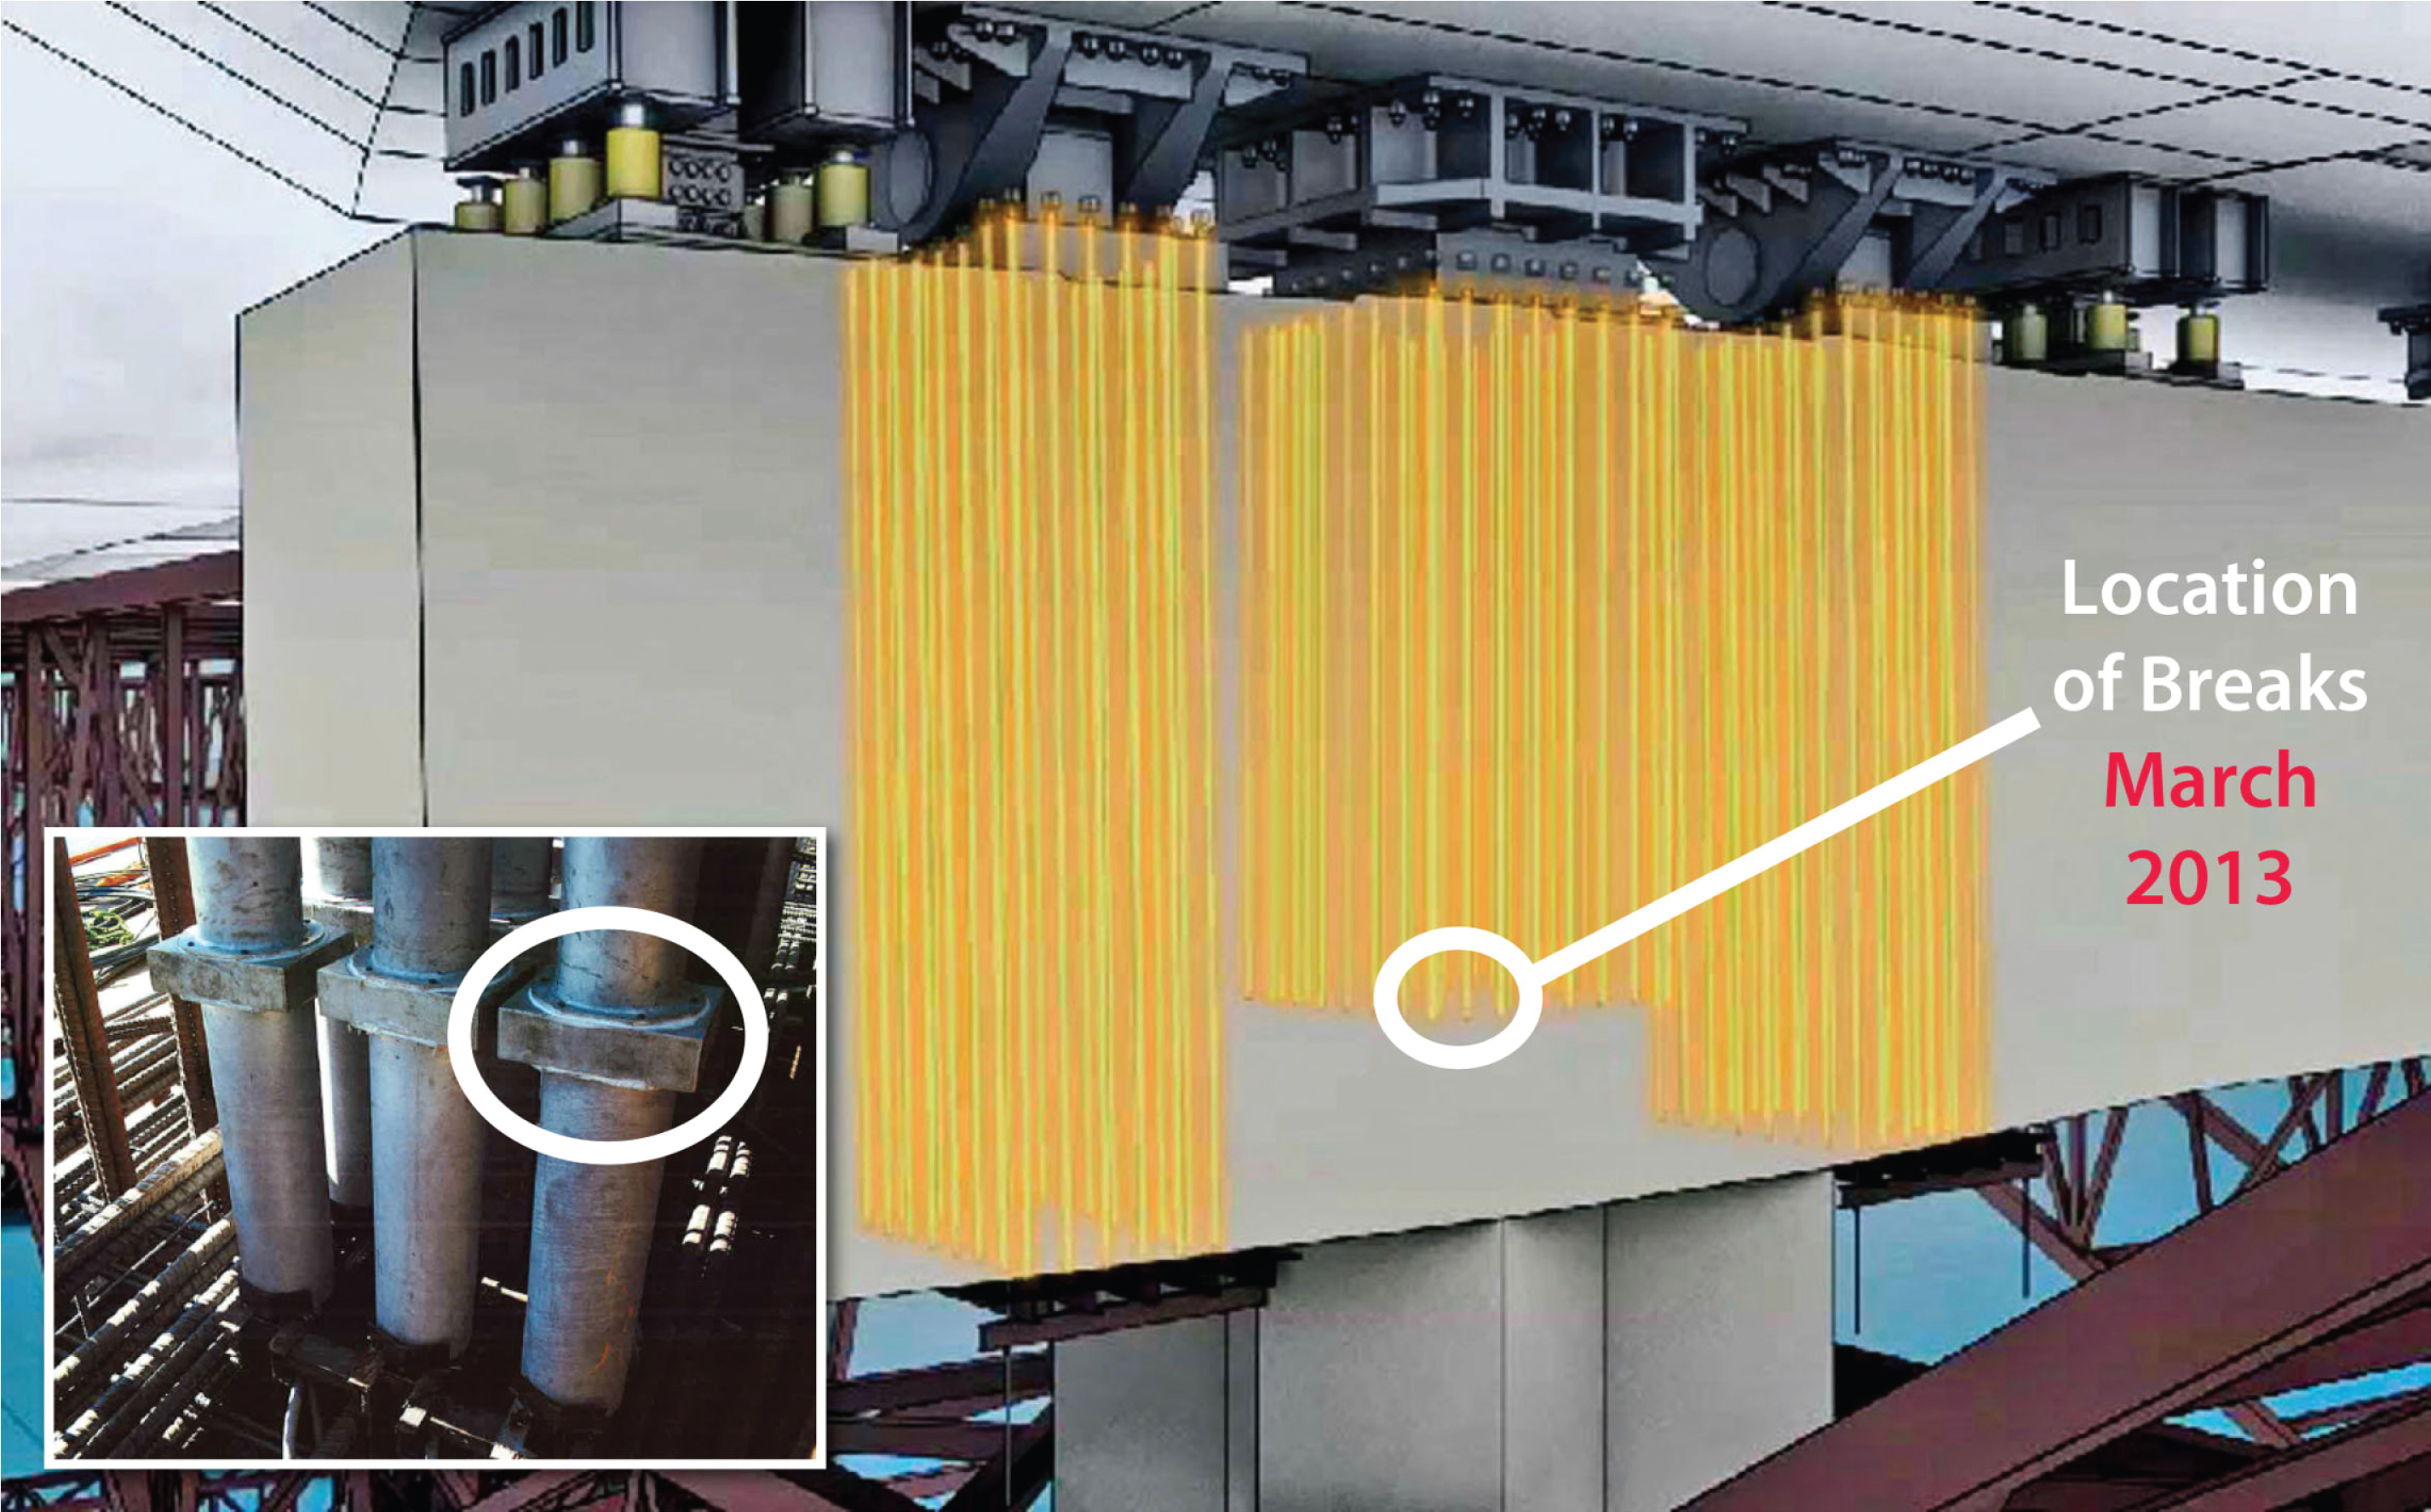
Fig.3
Test rig for full-length rods.
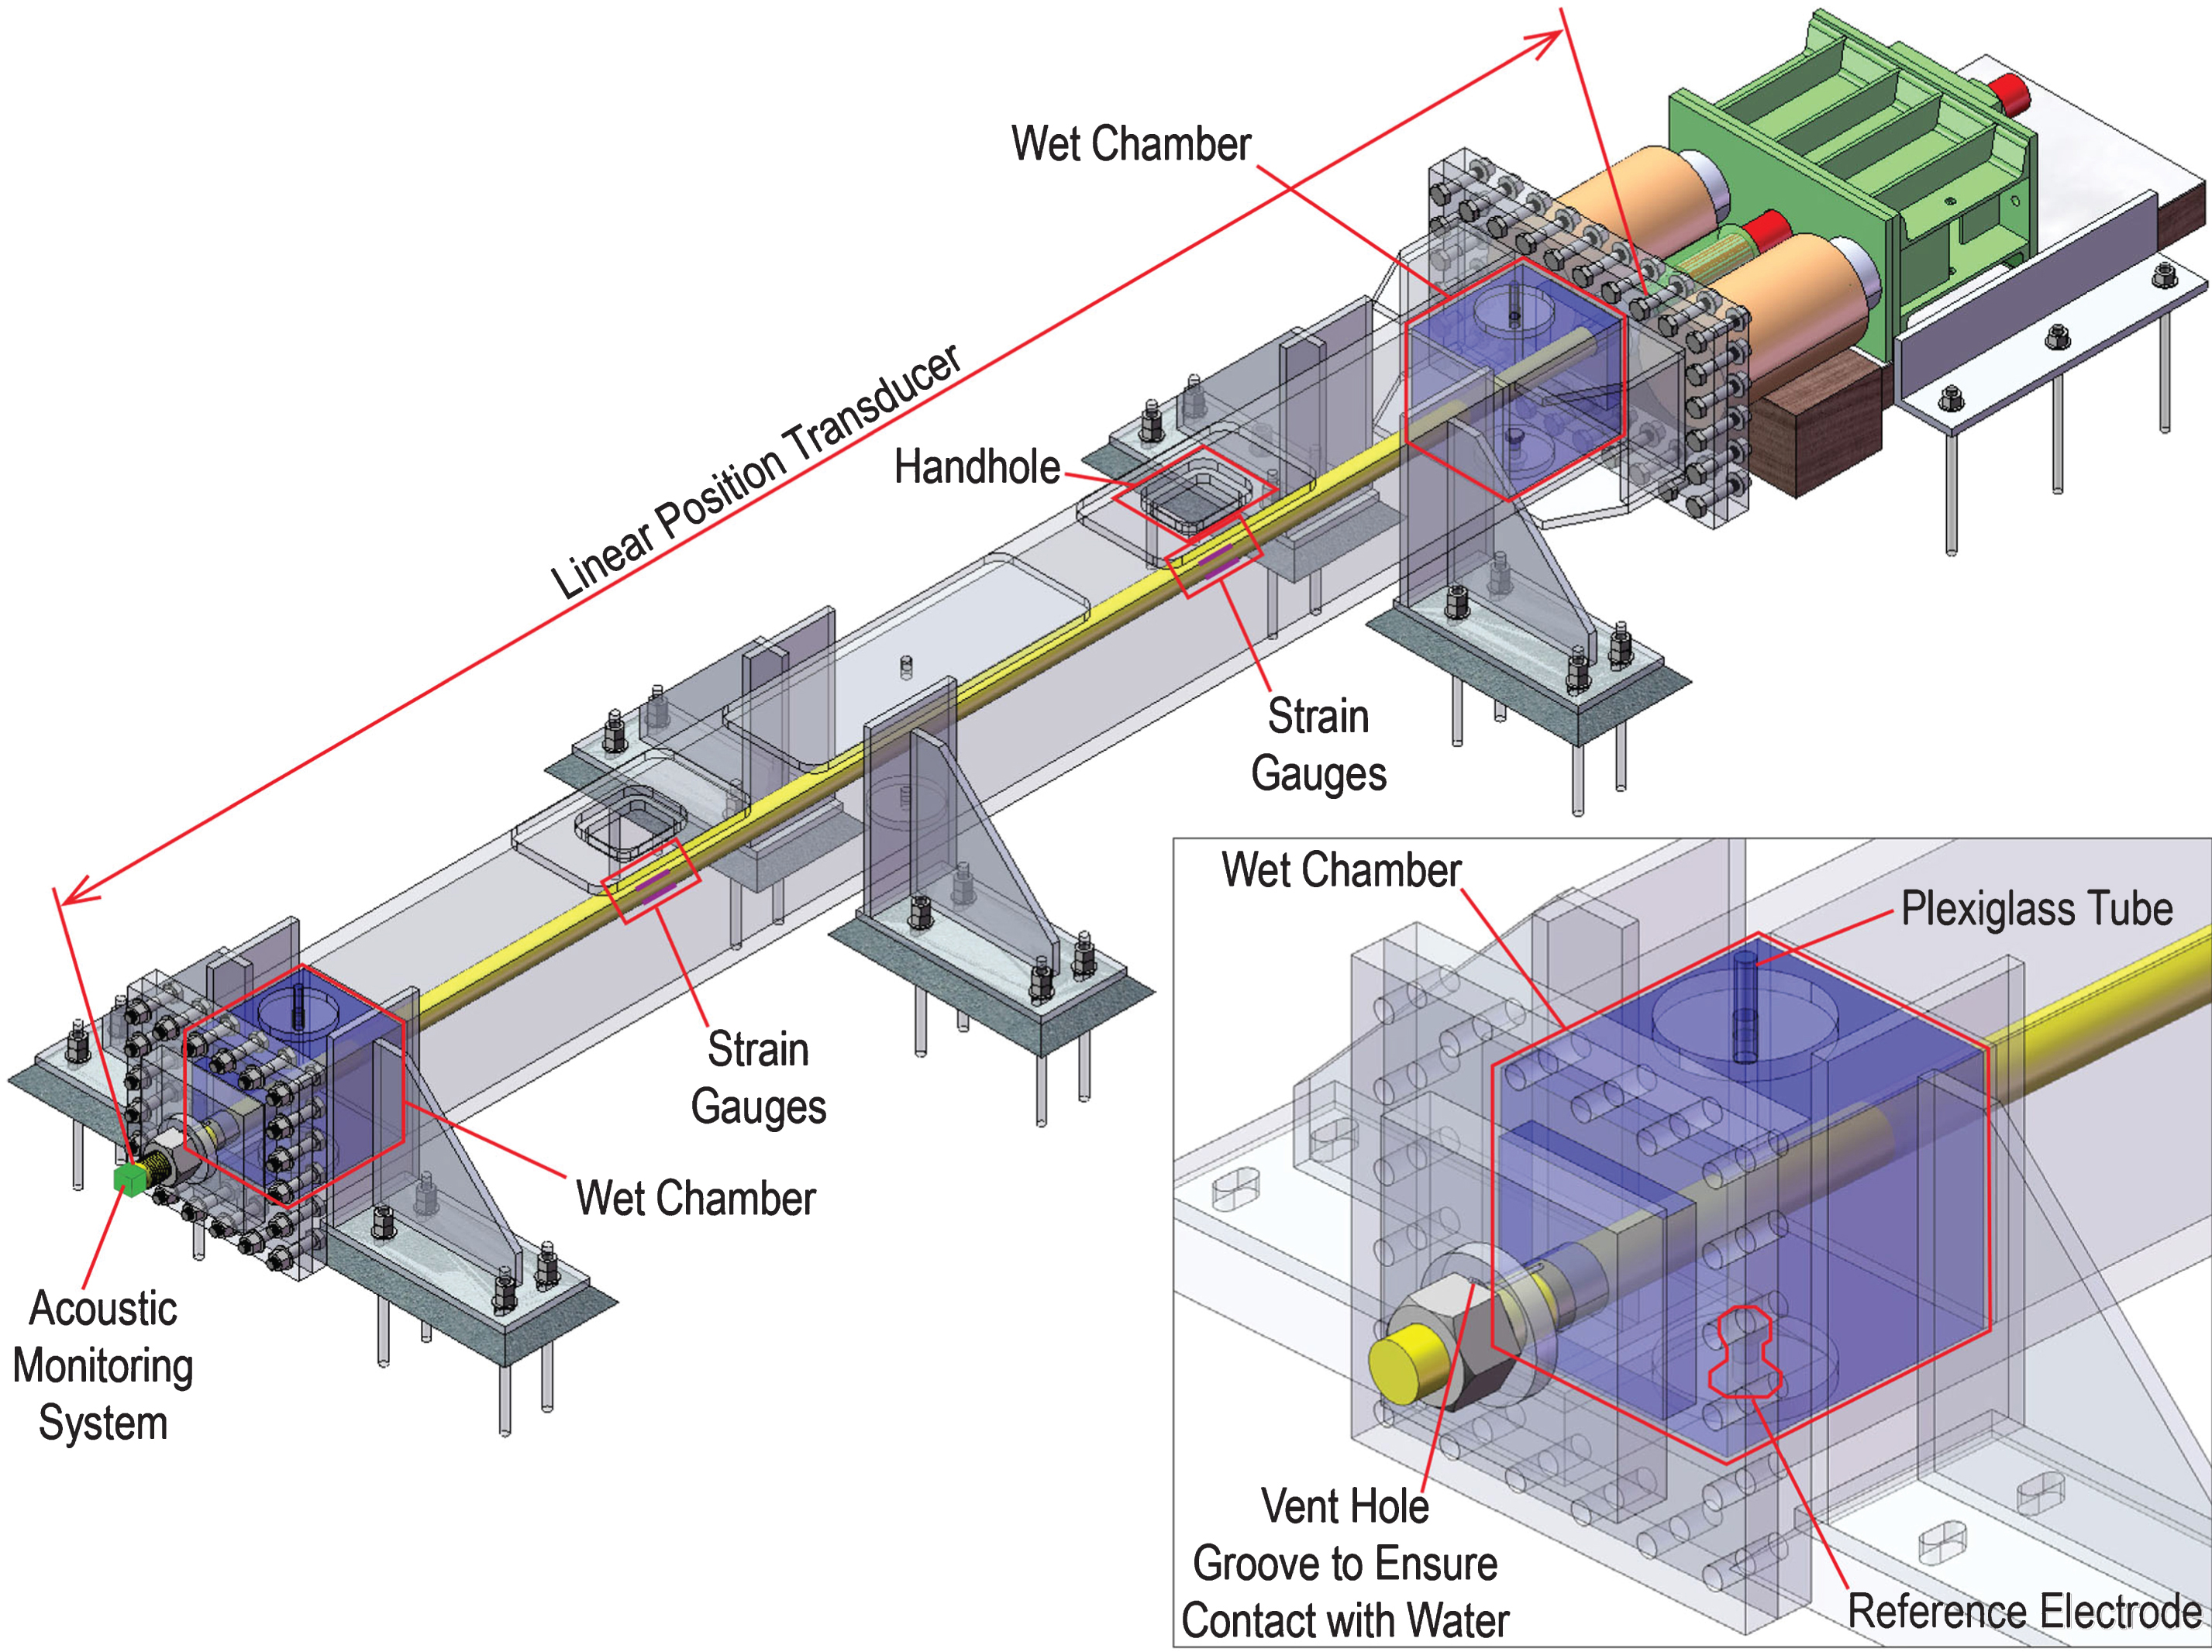
Fig.4
Test rig for full-length rods during setup.
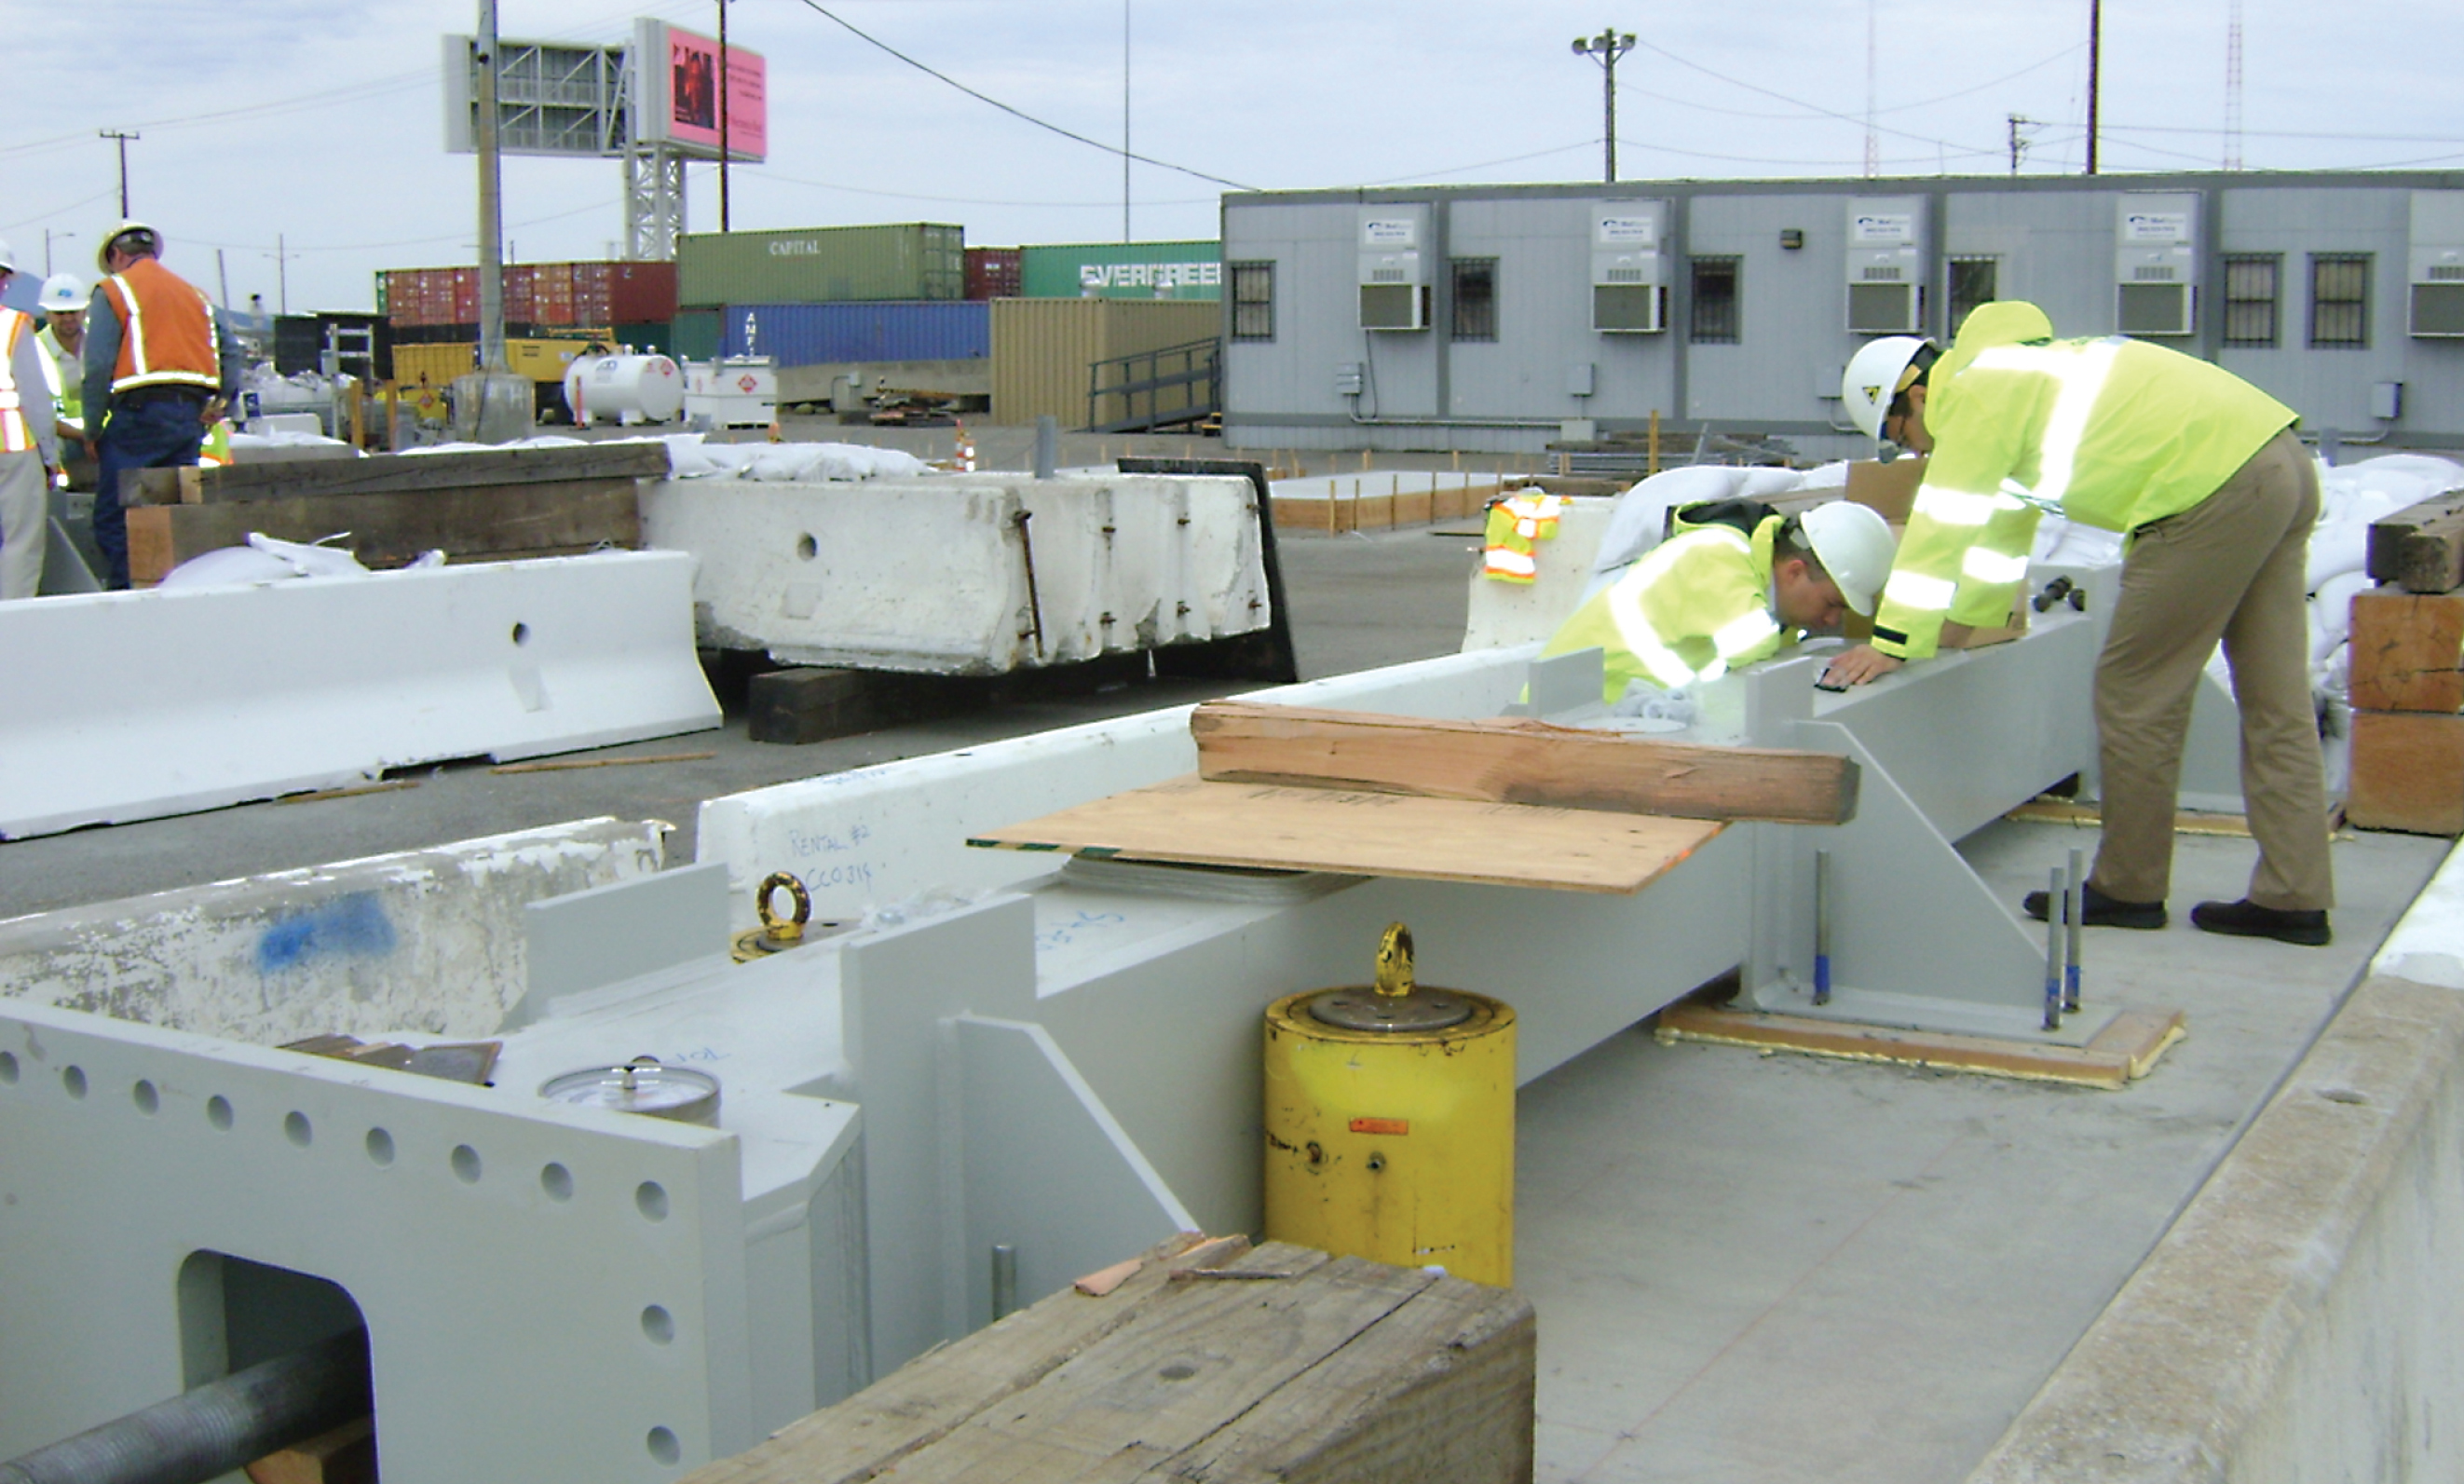
Fig.5
The test in progress under protective tent.
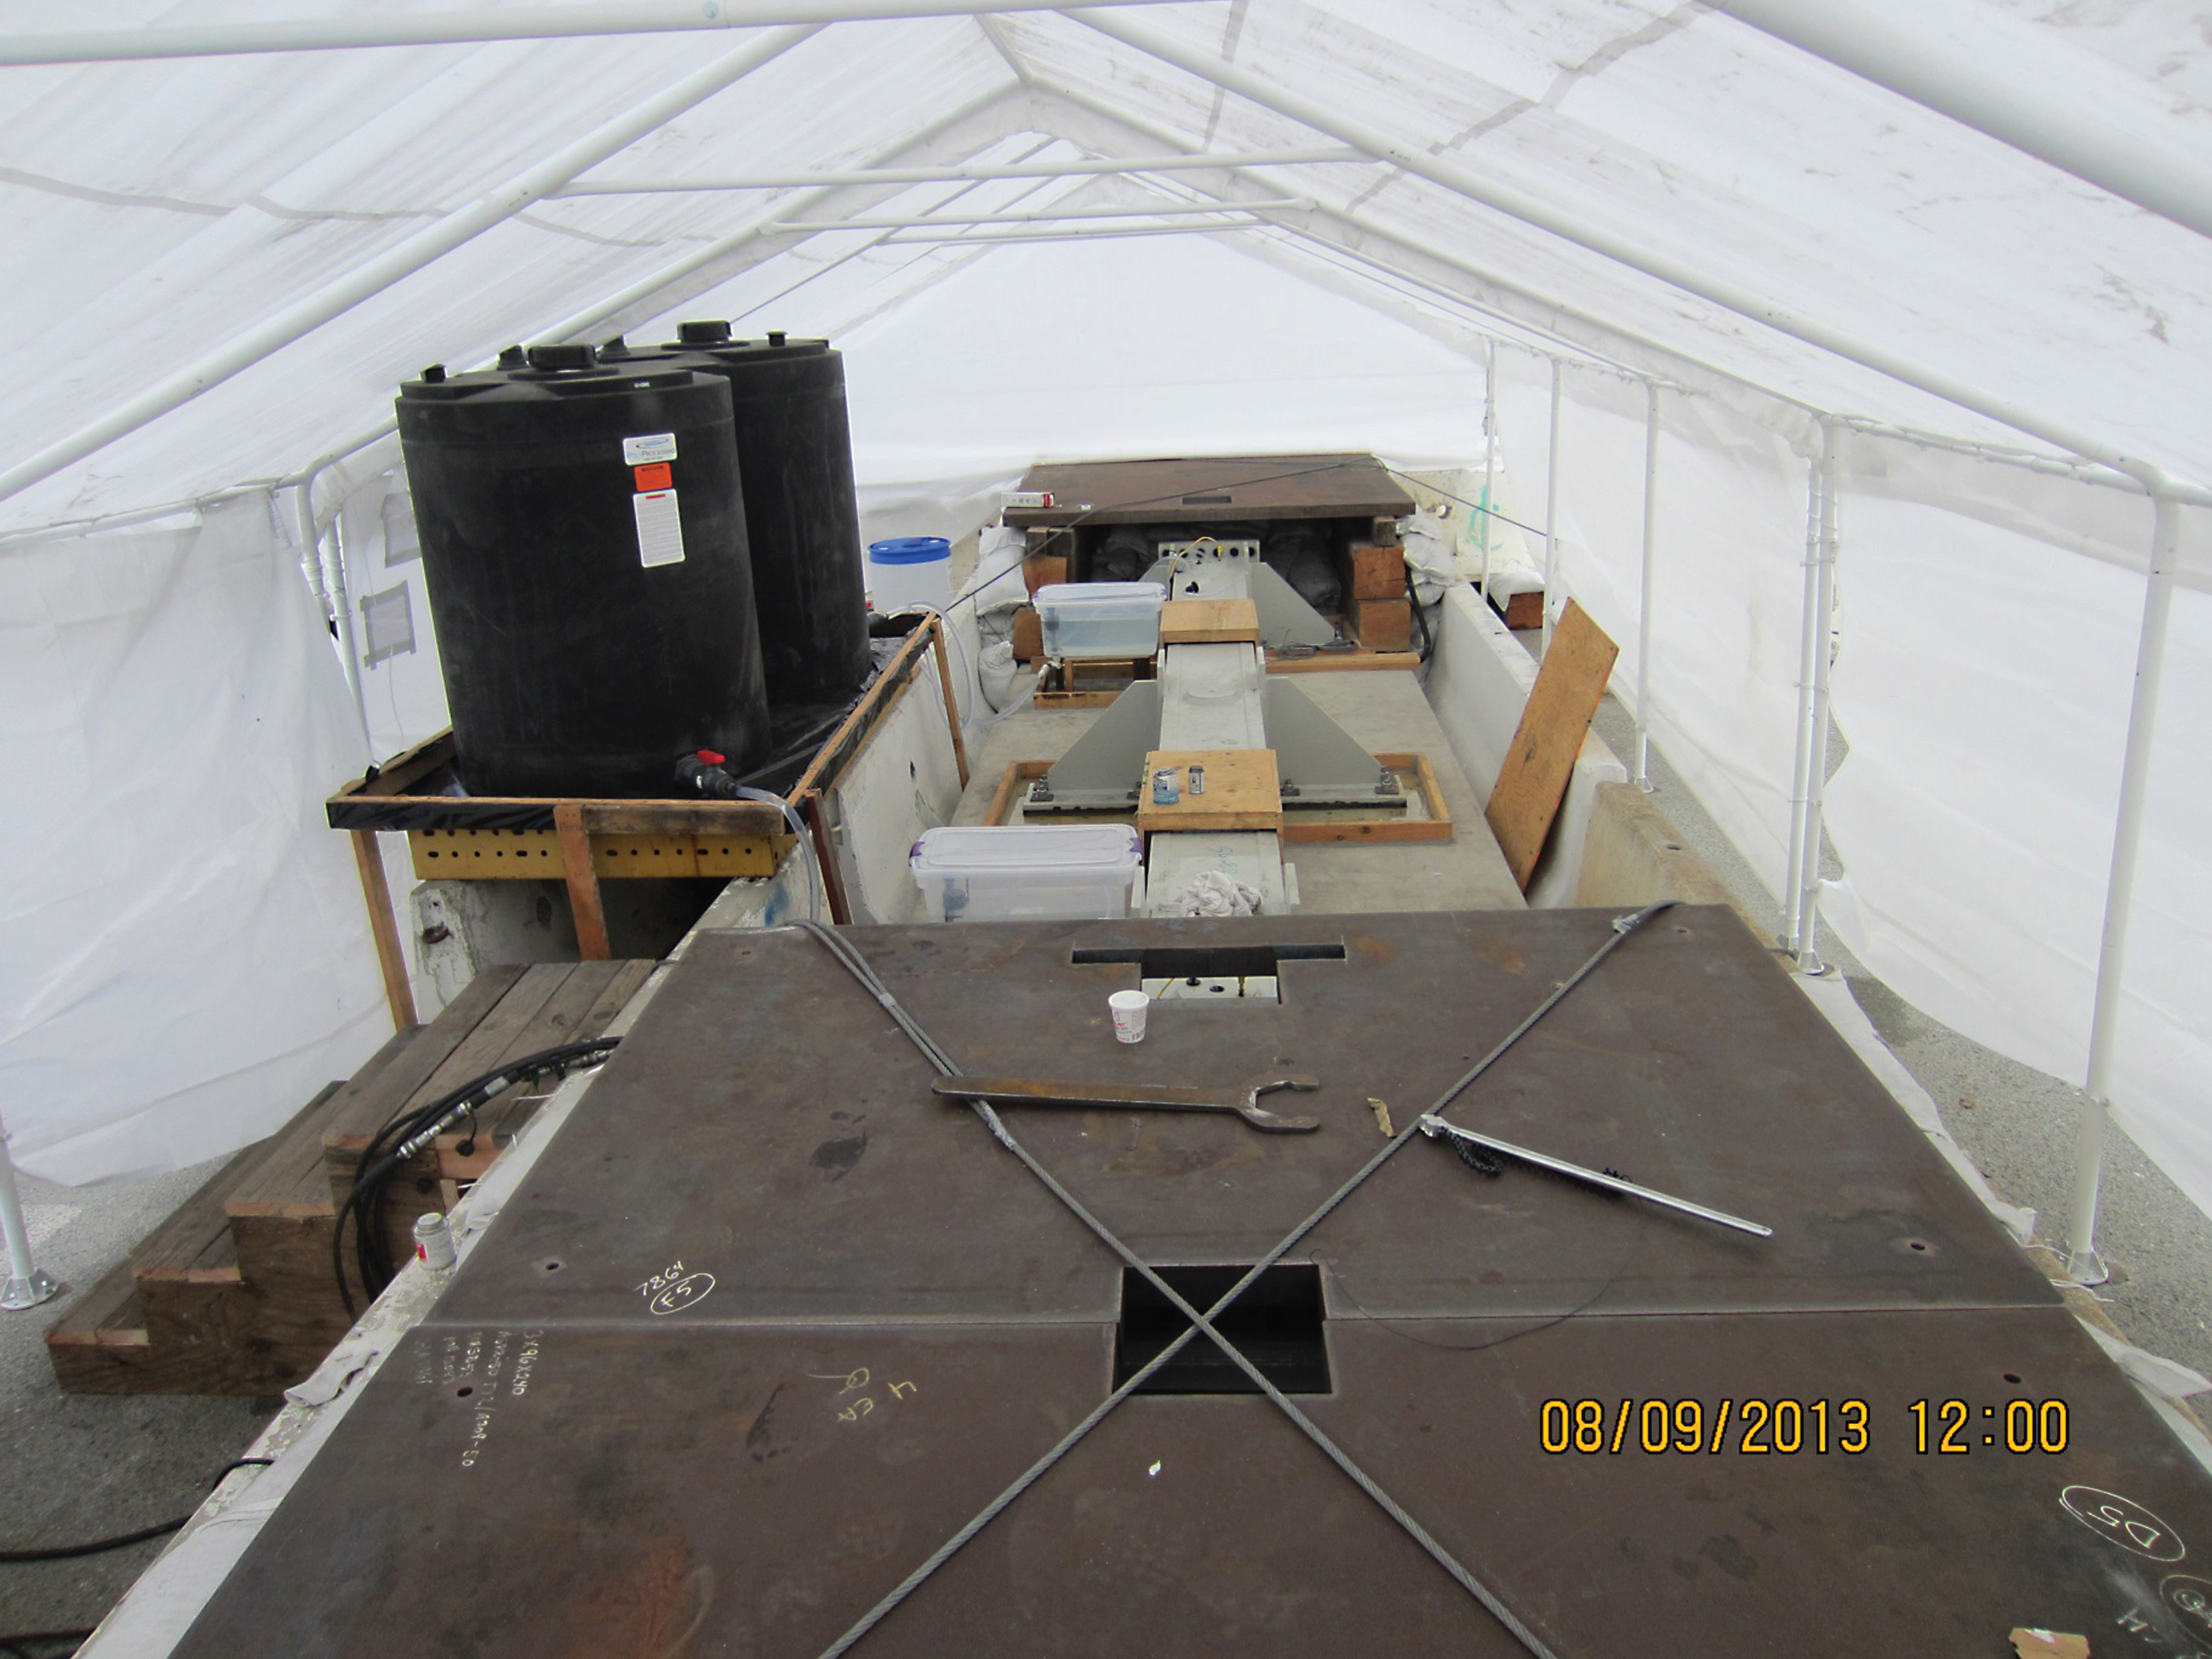
Fig.6
Test rig after rod failure showing the effects of energy released when fracture occurs.
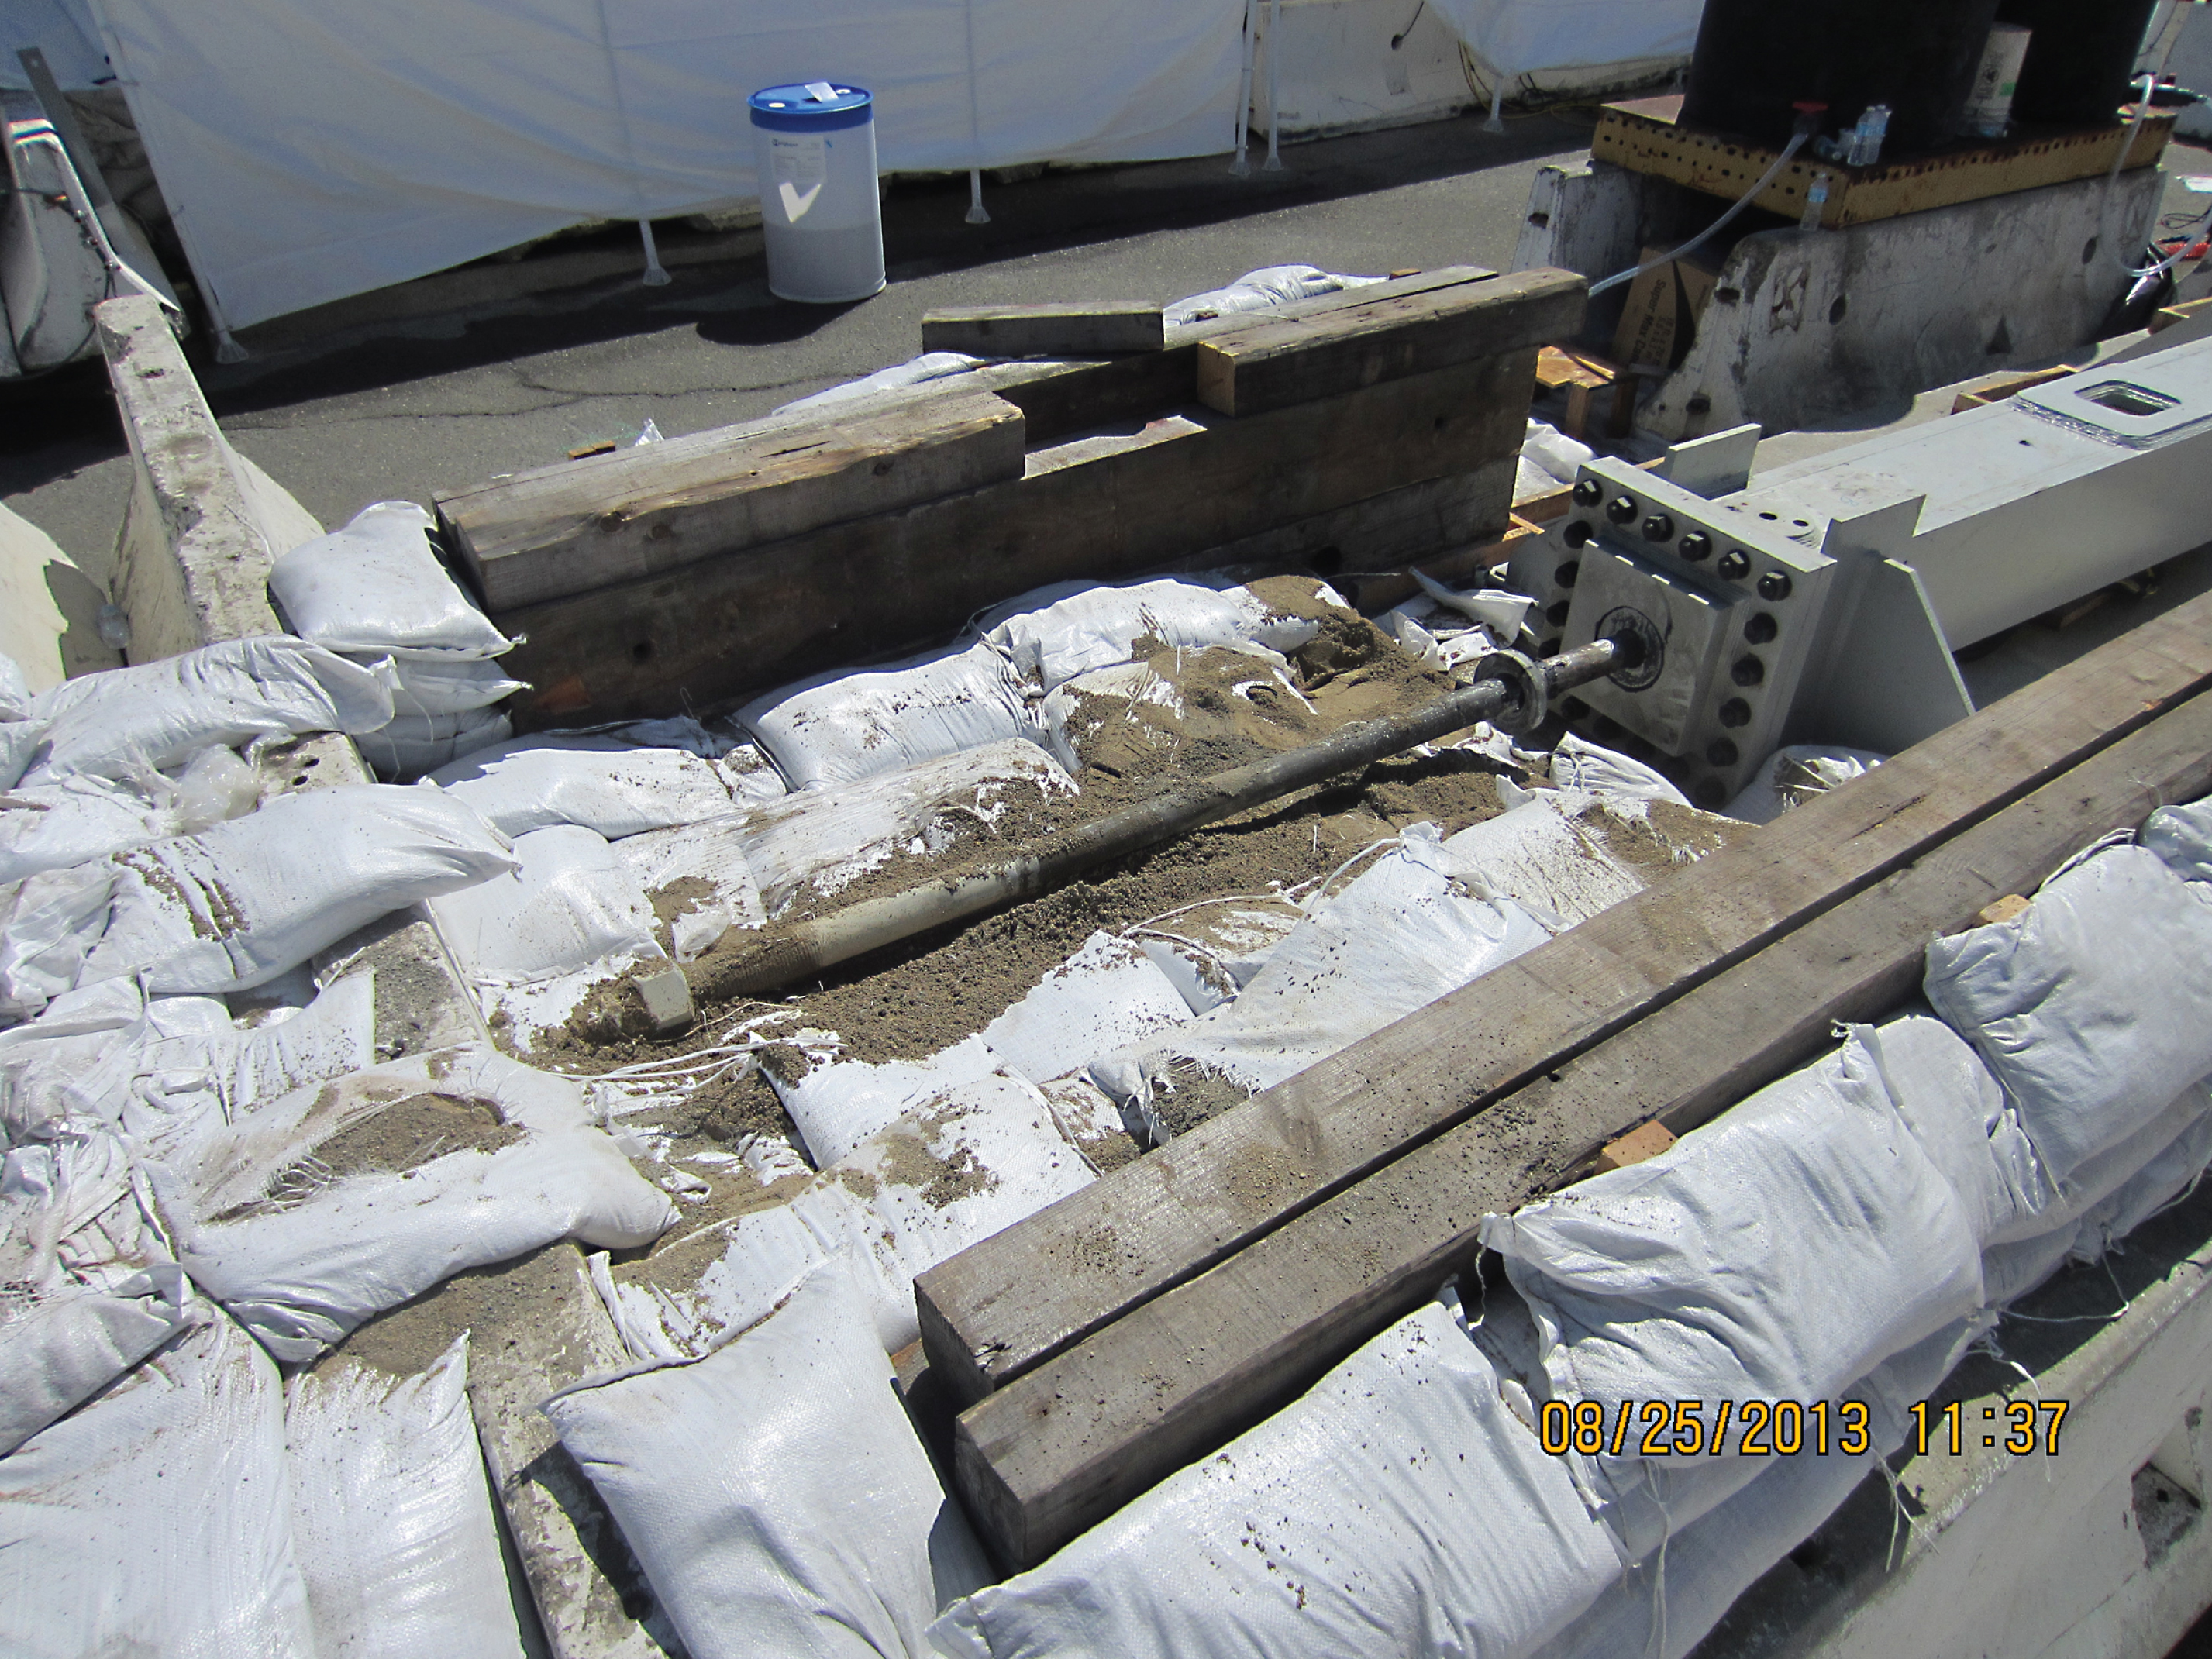
Fig.7
Venting of test solution.
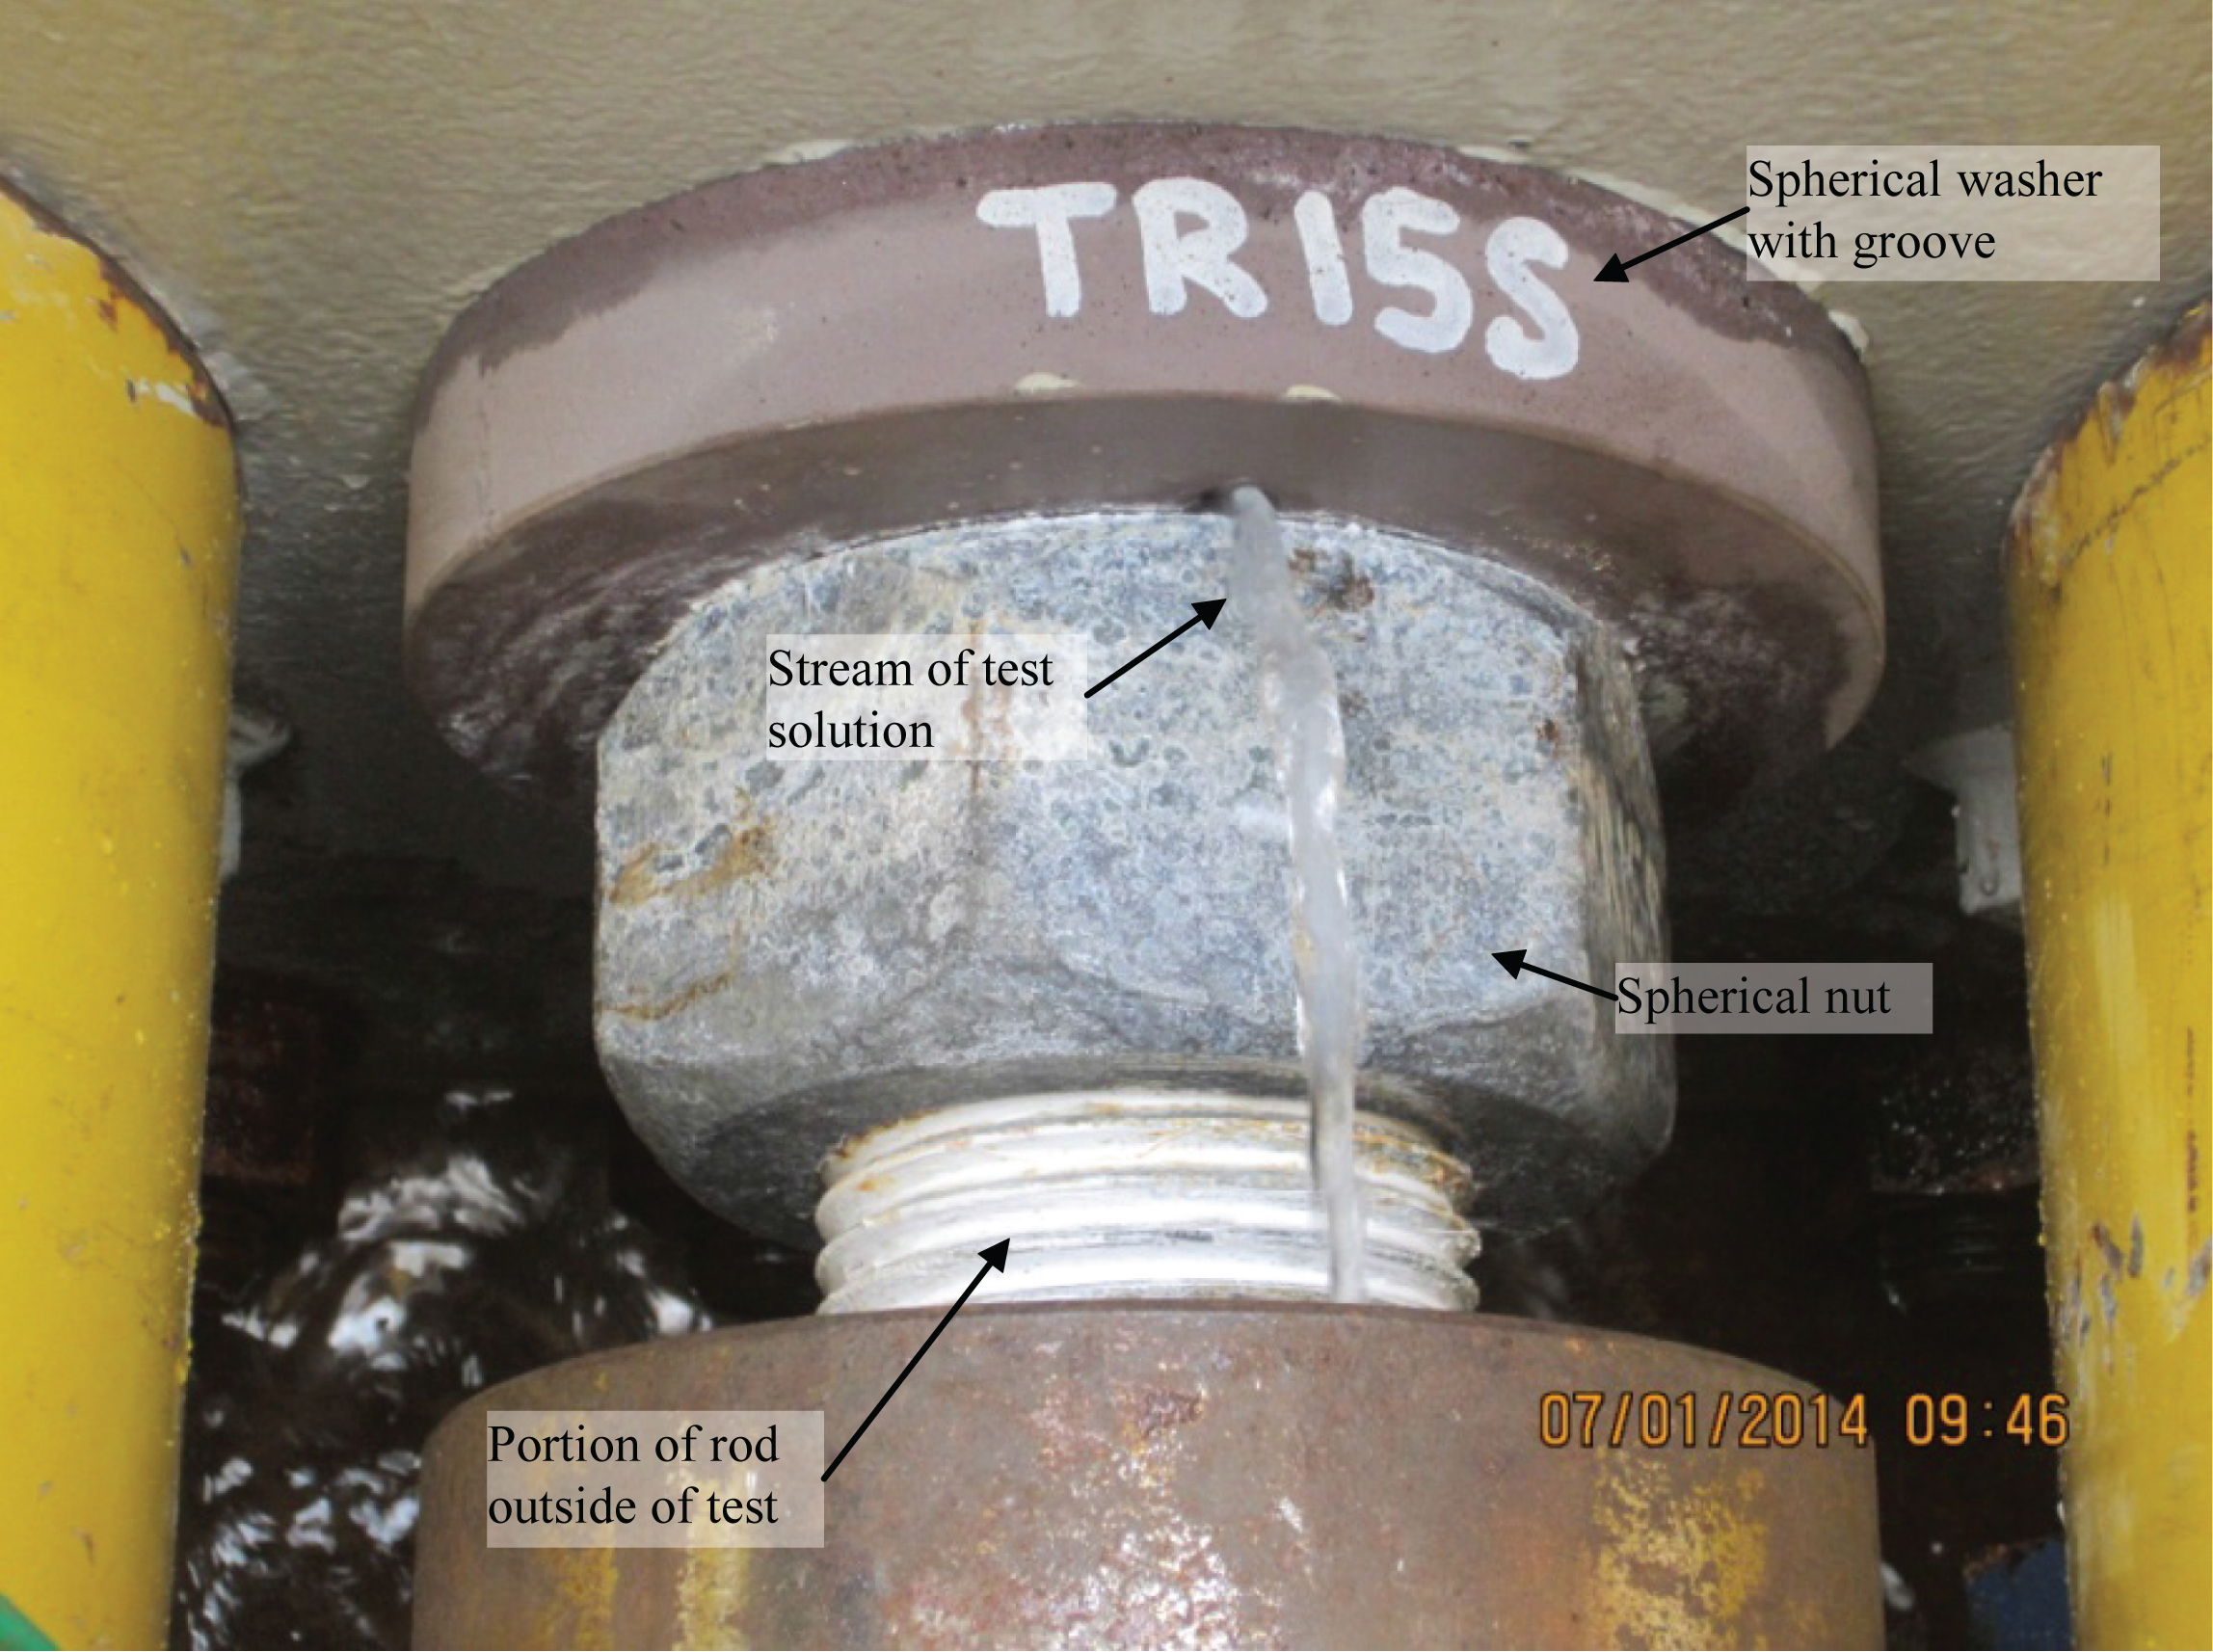
Fig.8
Typical plot of load vs. test time, showing step increases in load until failure at 0.85 Fu (Rod 1).
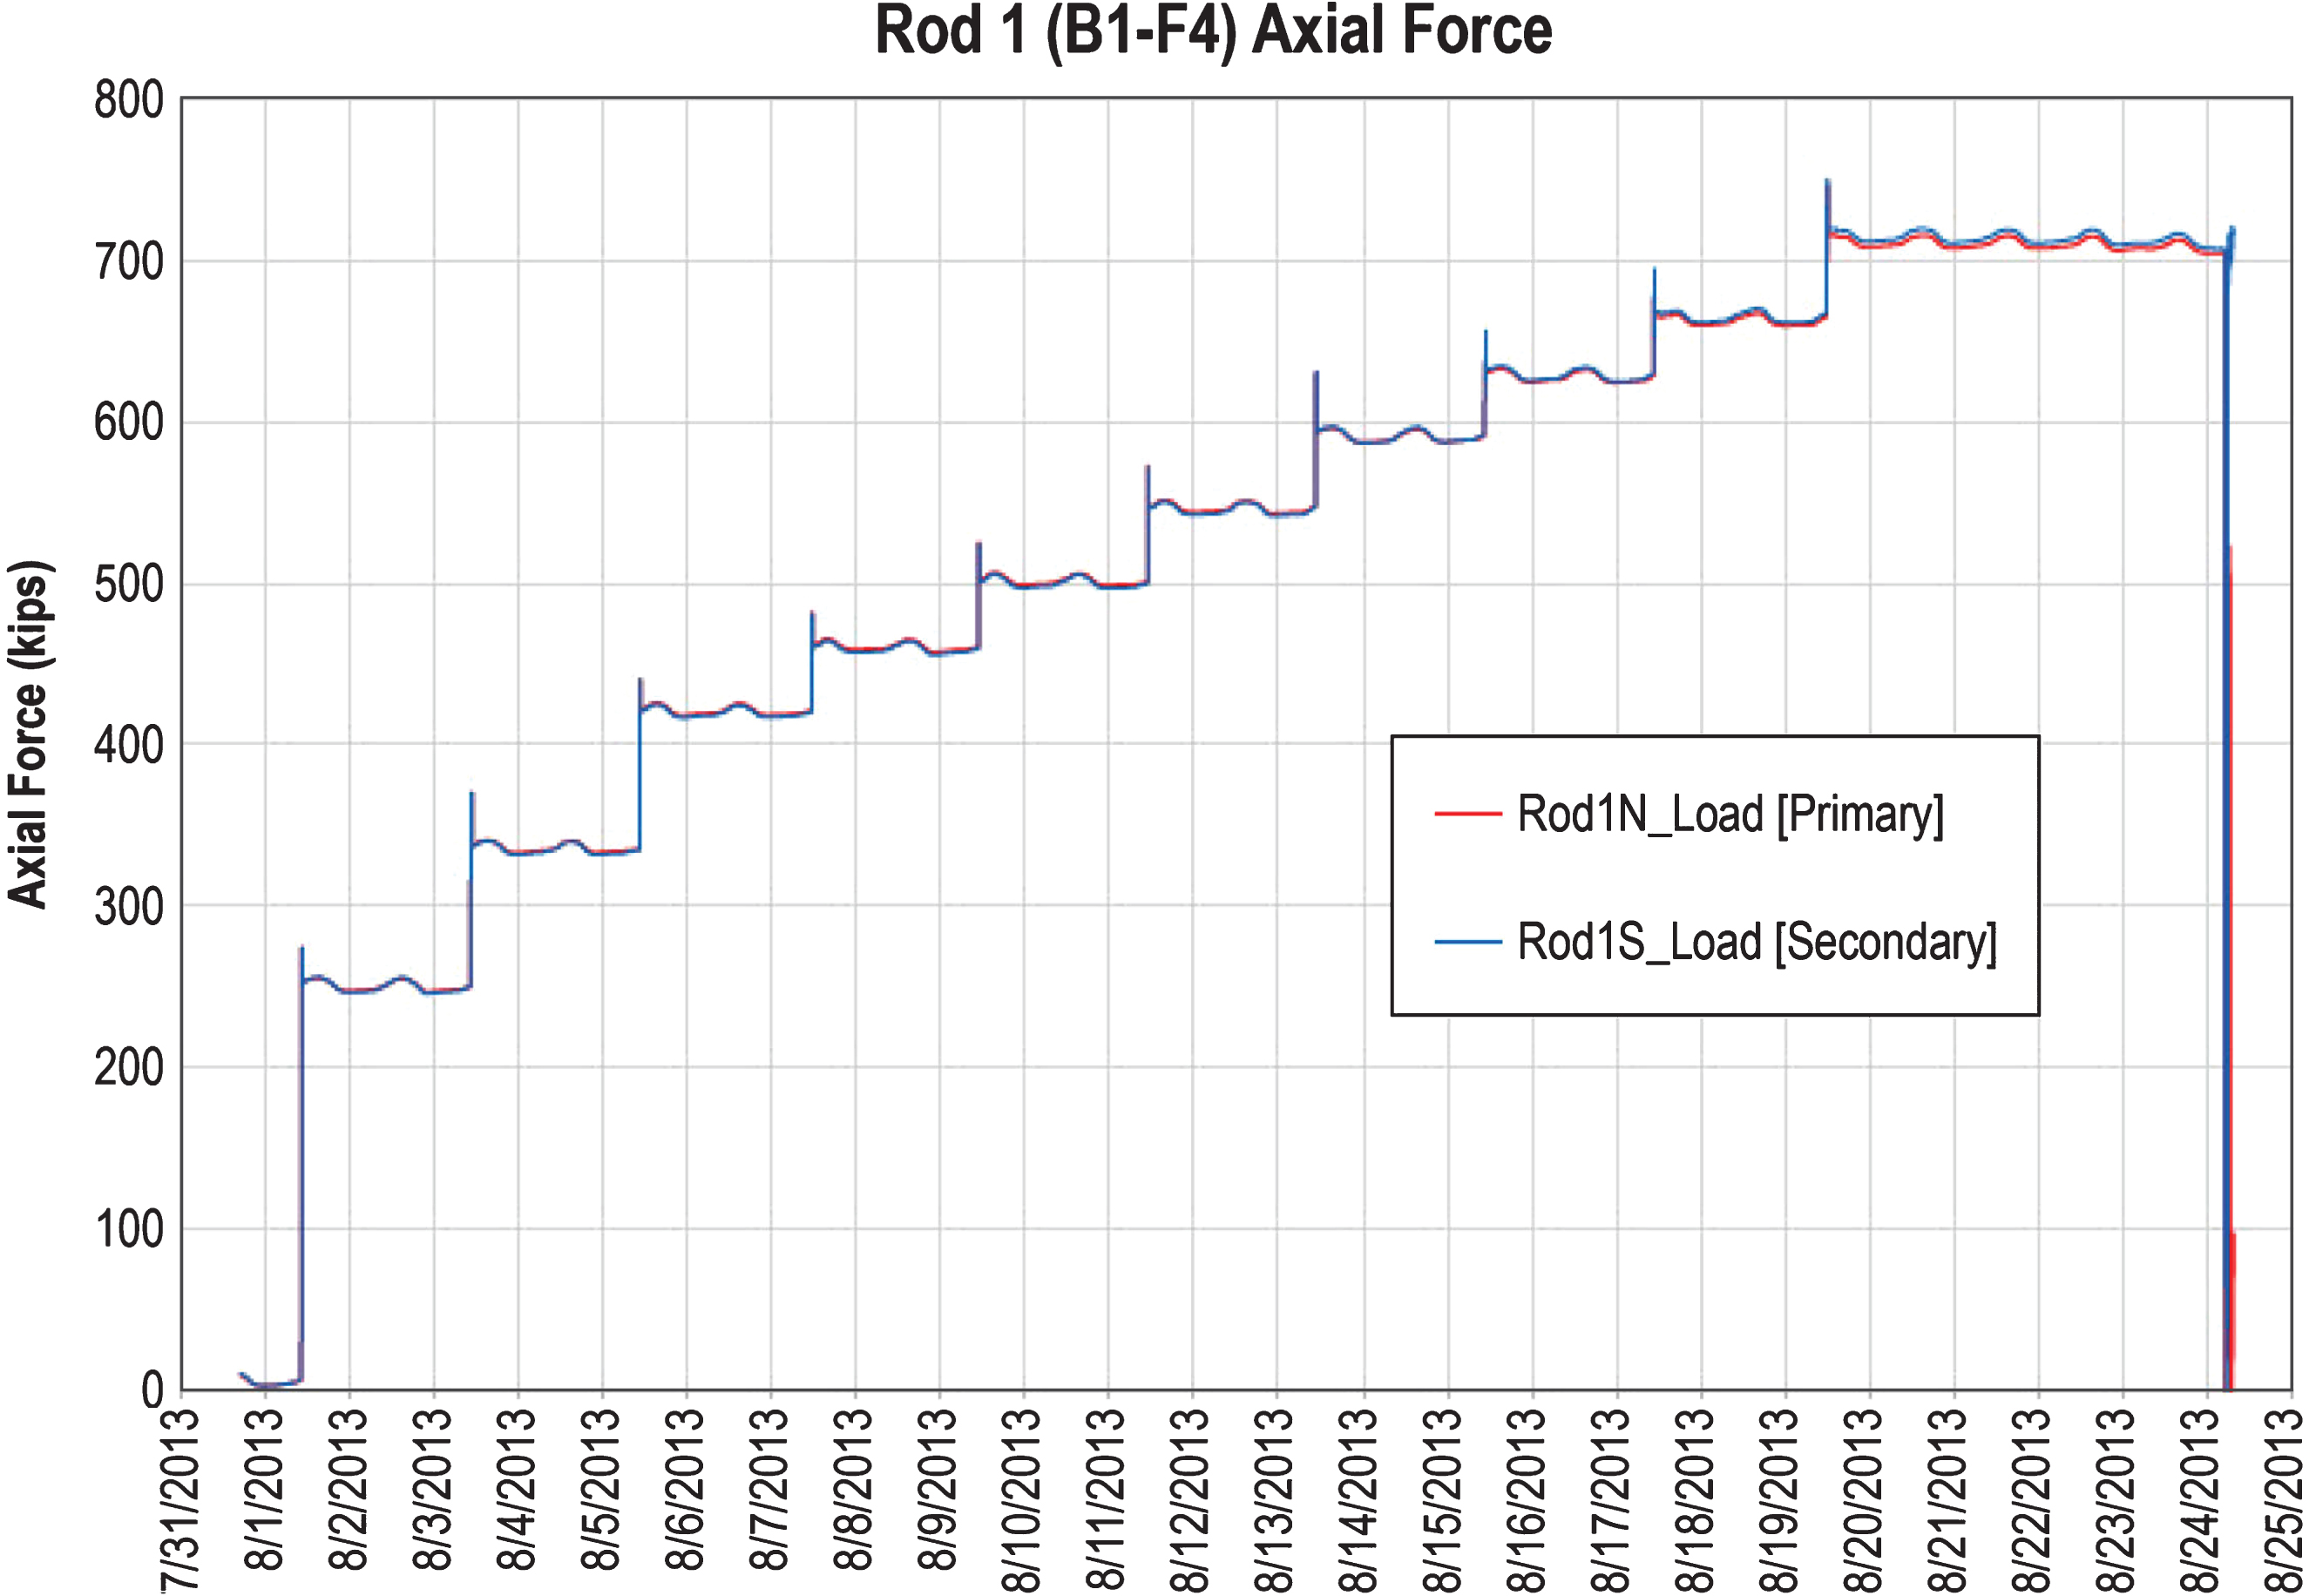
Fig.9
Example plot of electrode potential and pH vs. test time (Rod 11).
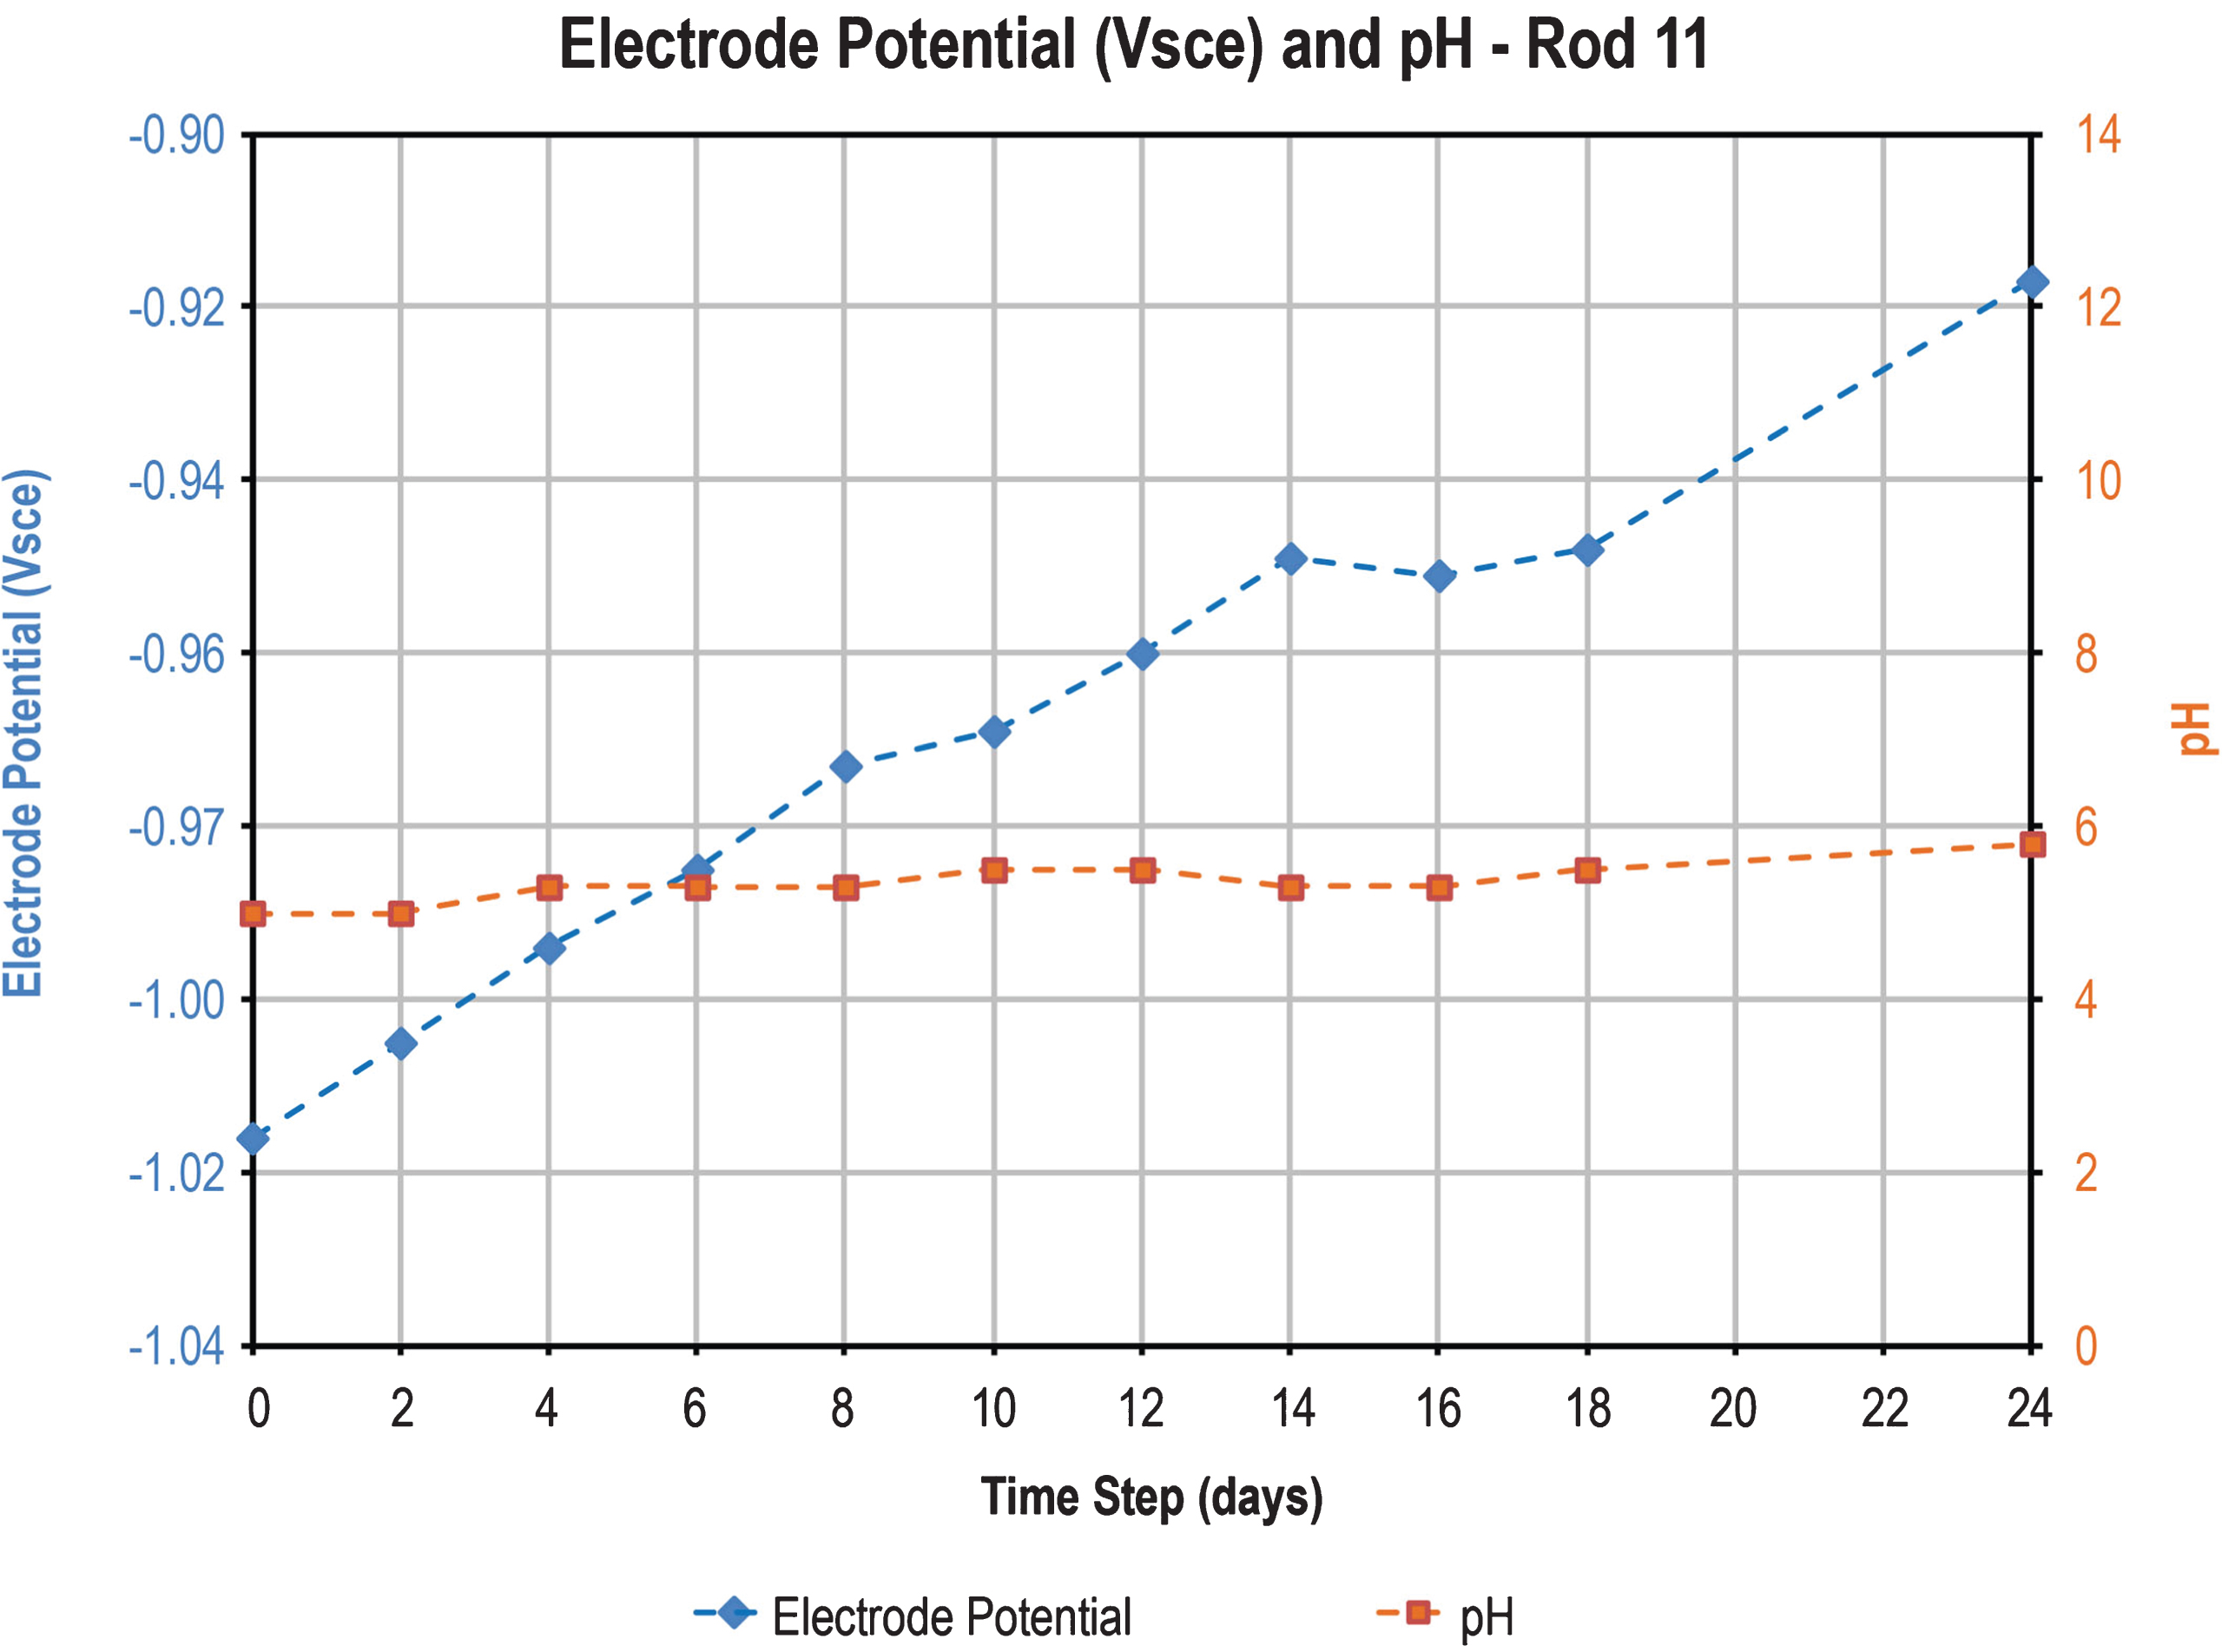
Fig.10
Townsend test results comparison.
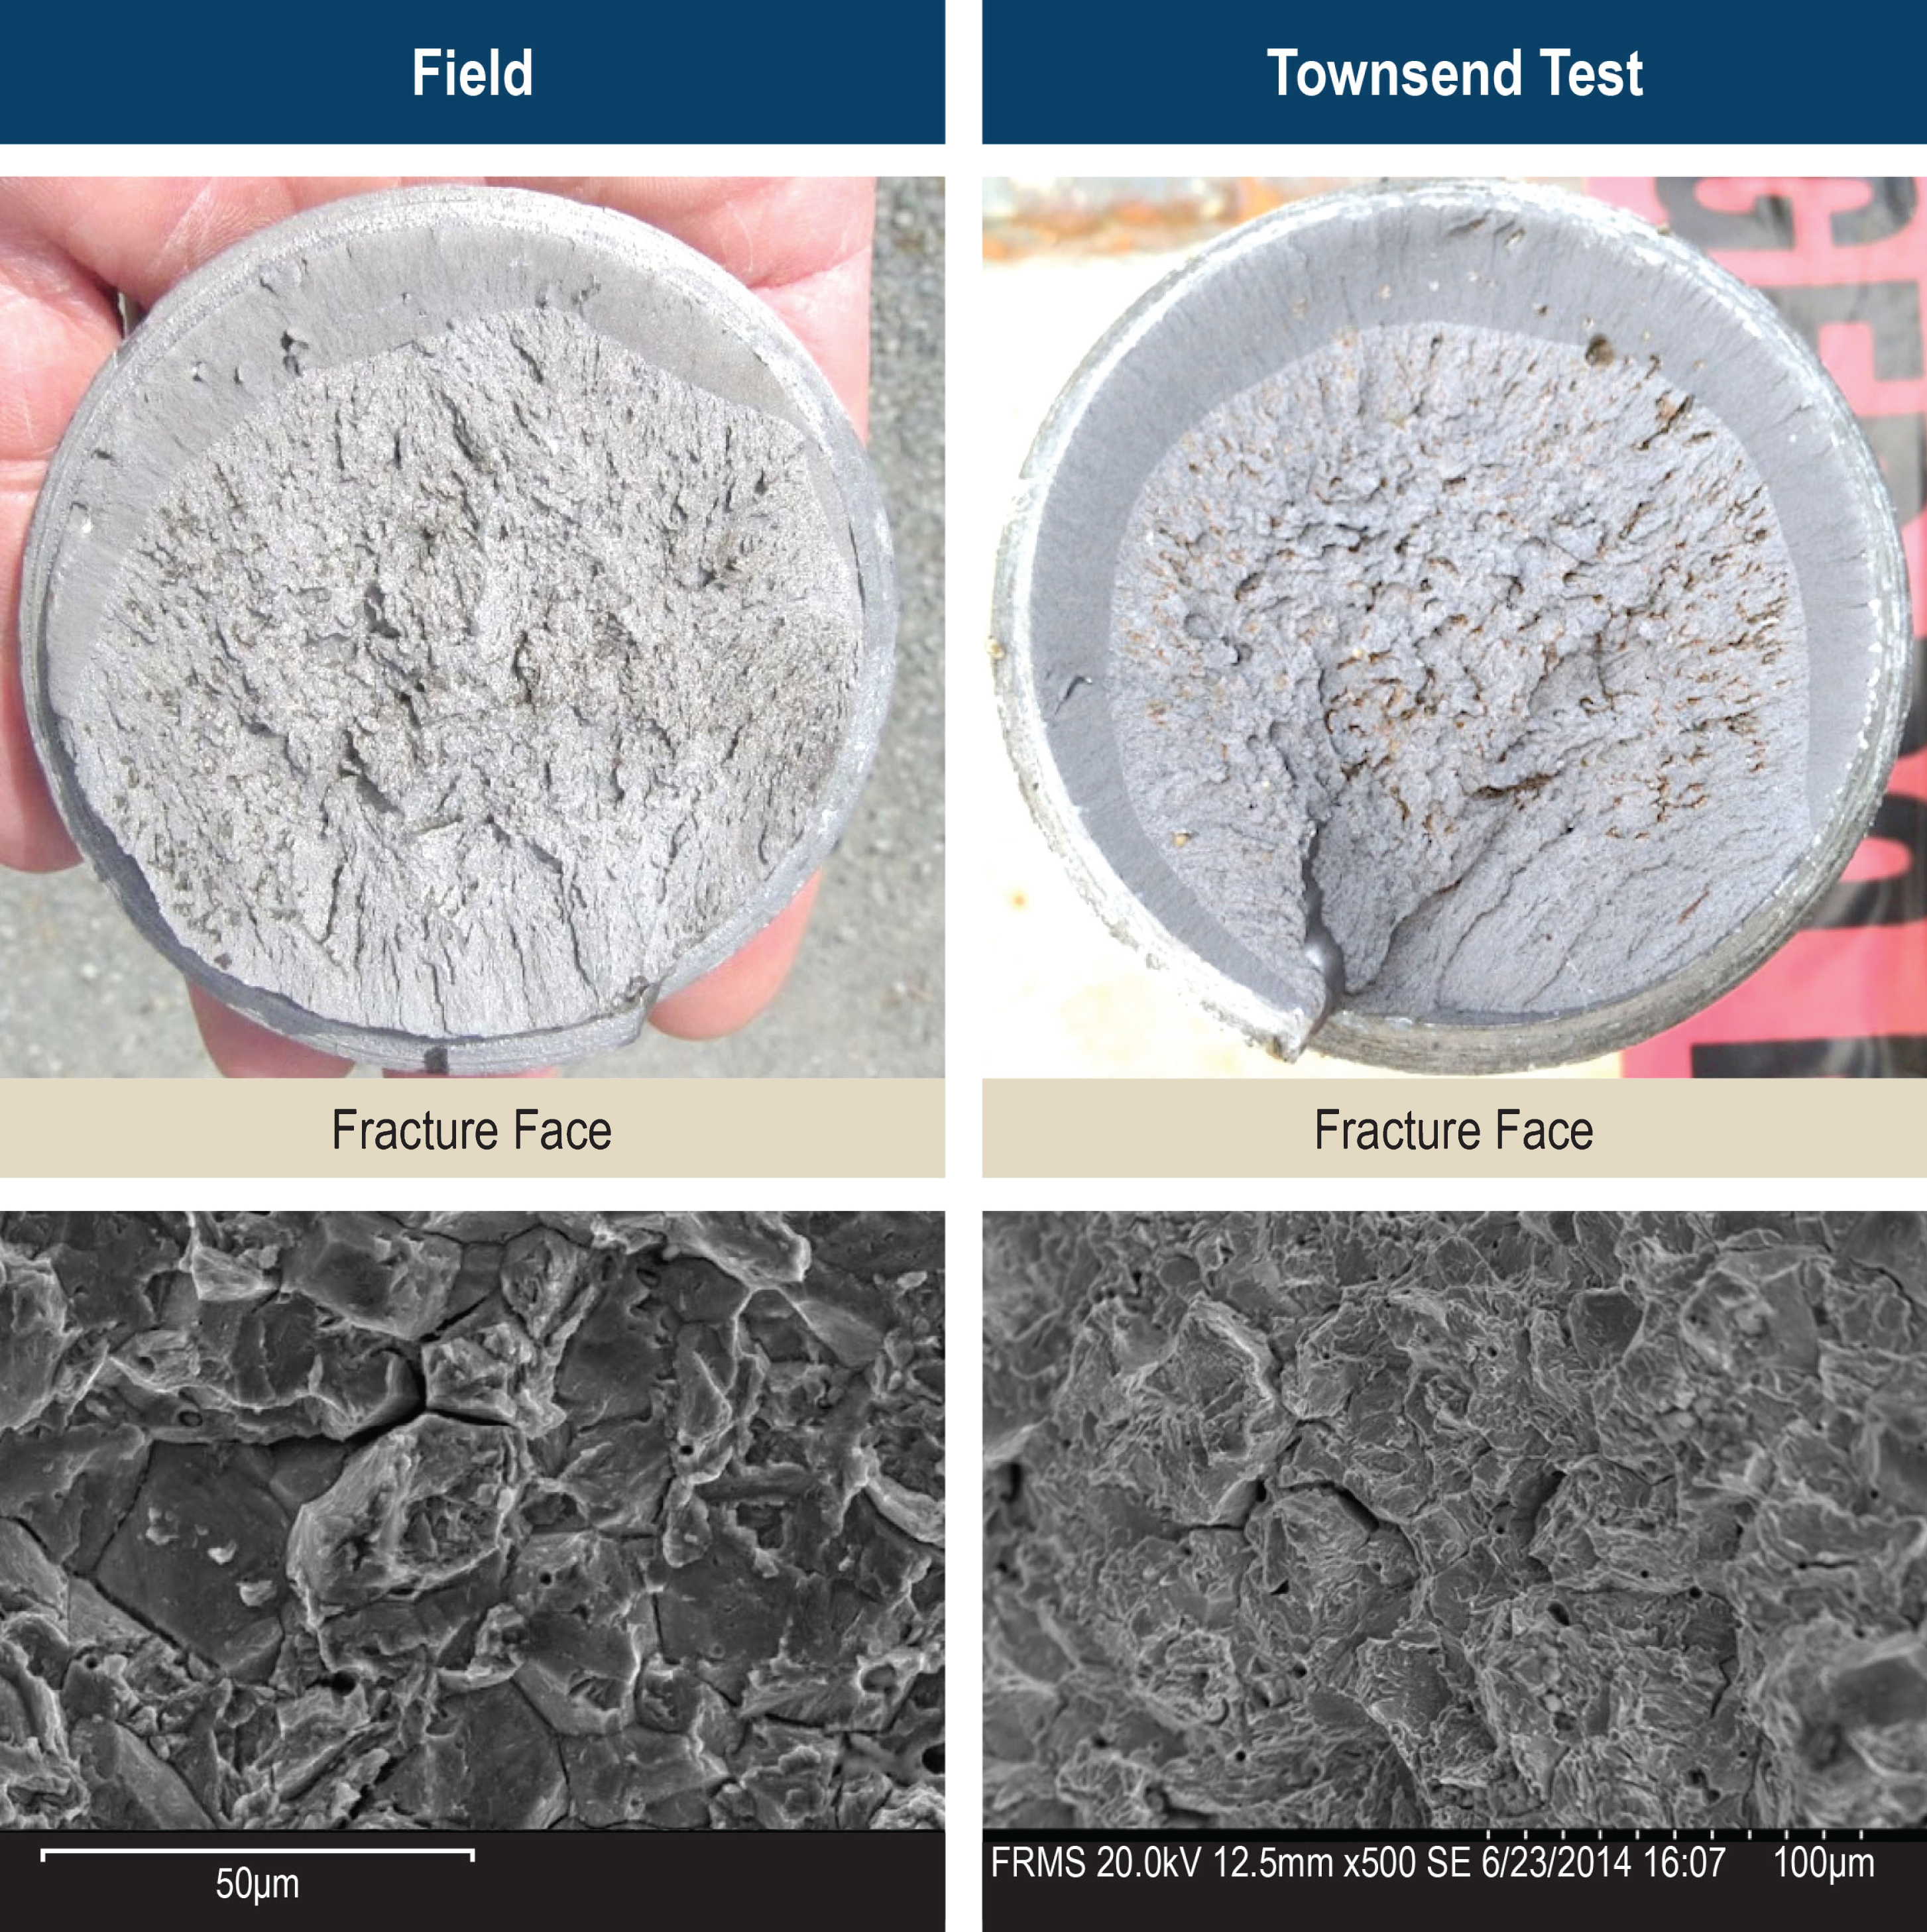
Fig.11
2008 Test thresholds vs. actual loading.
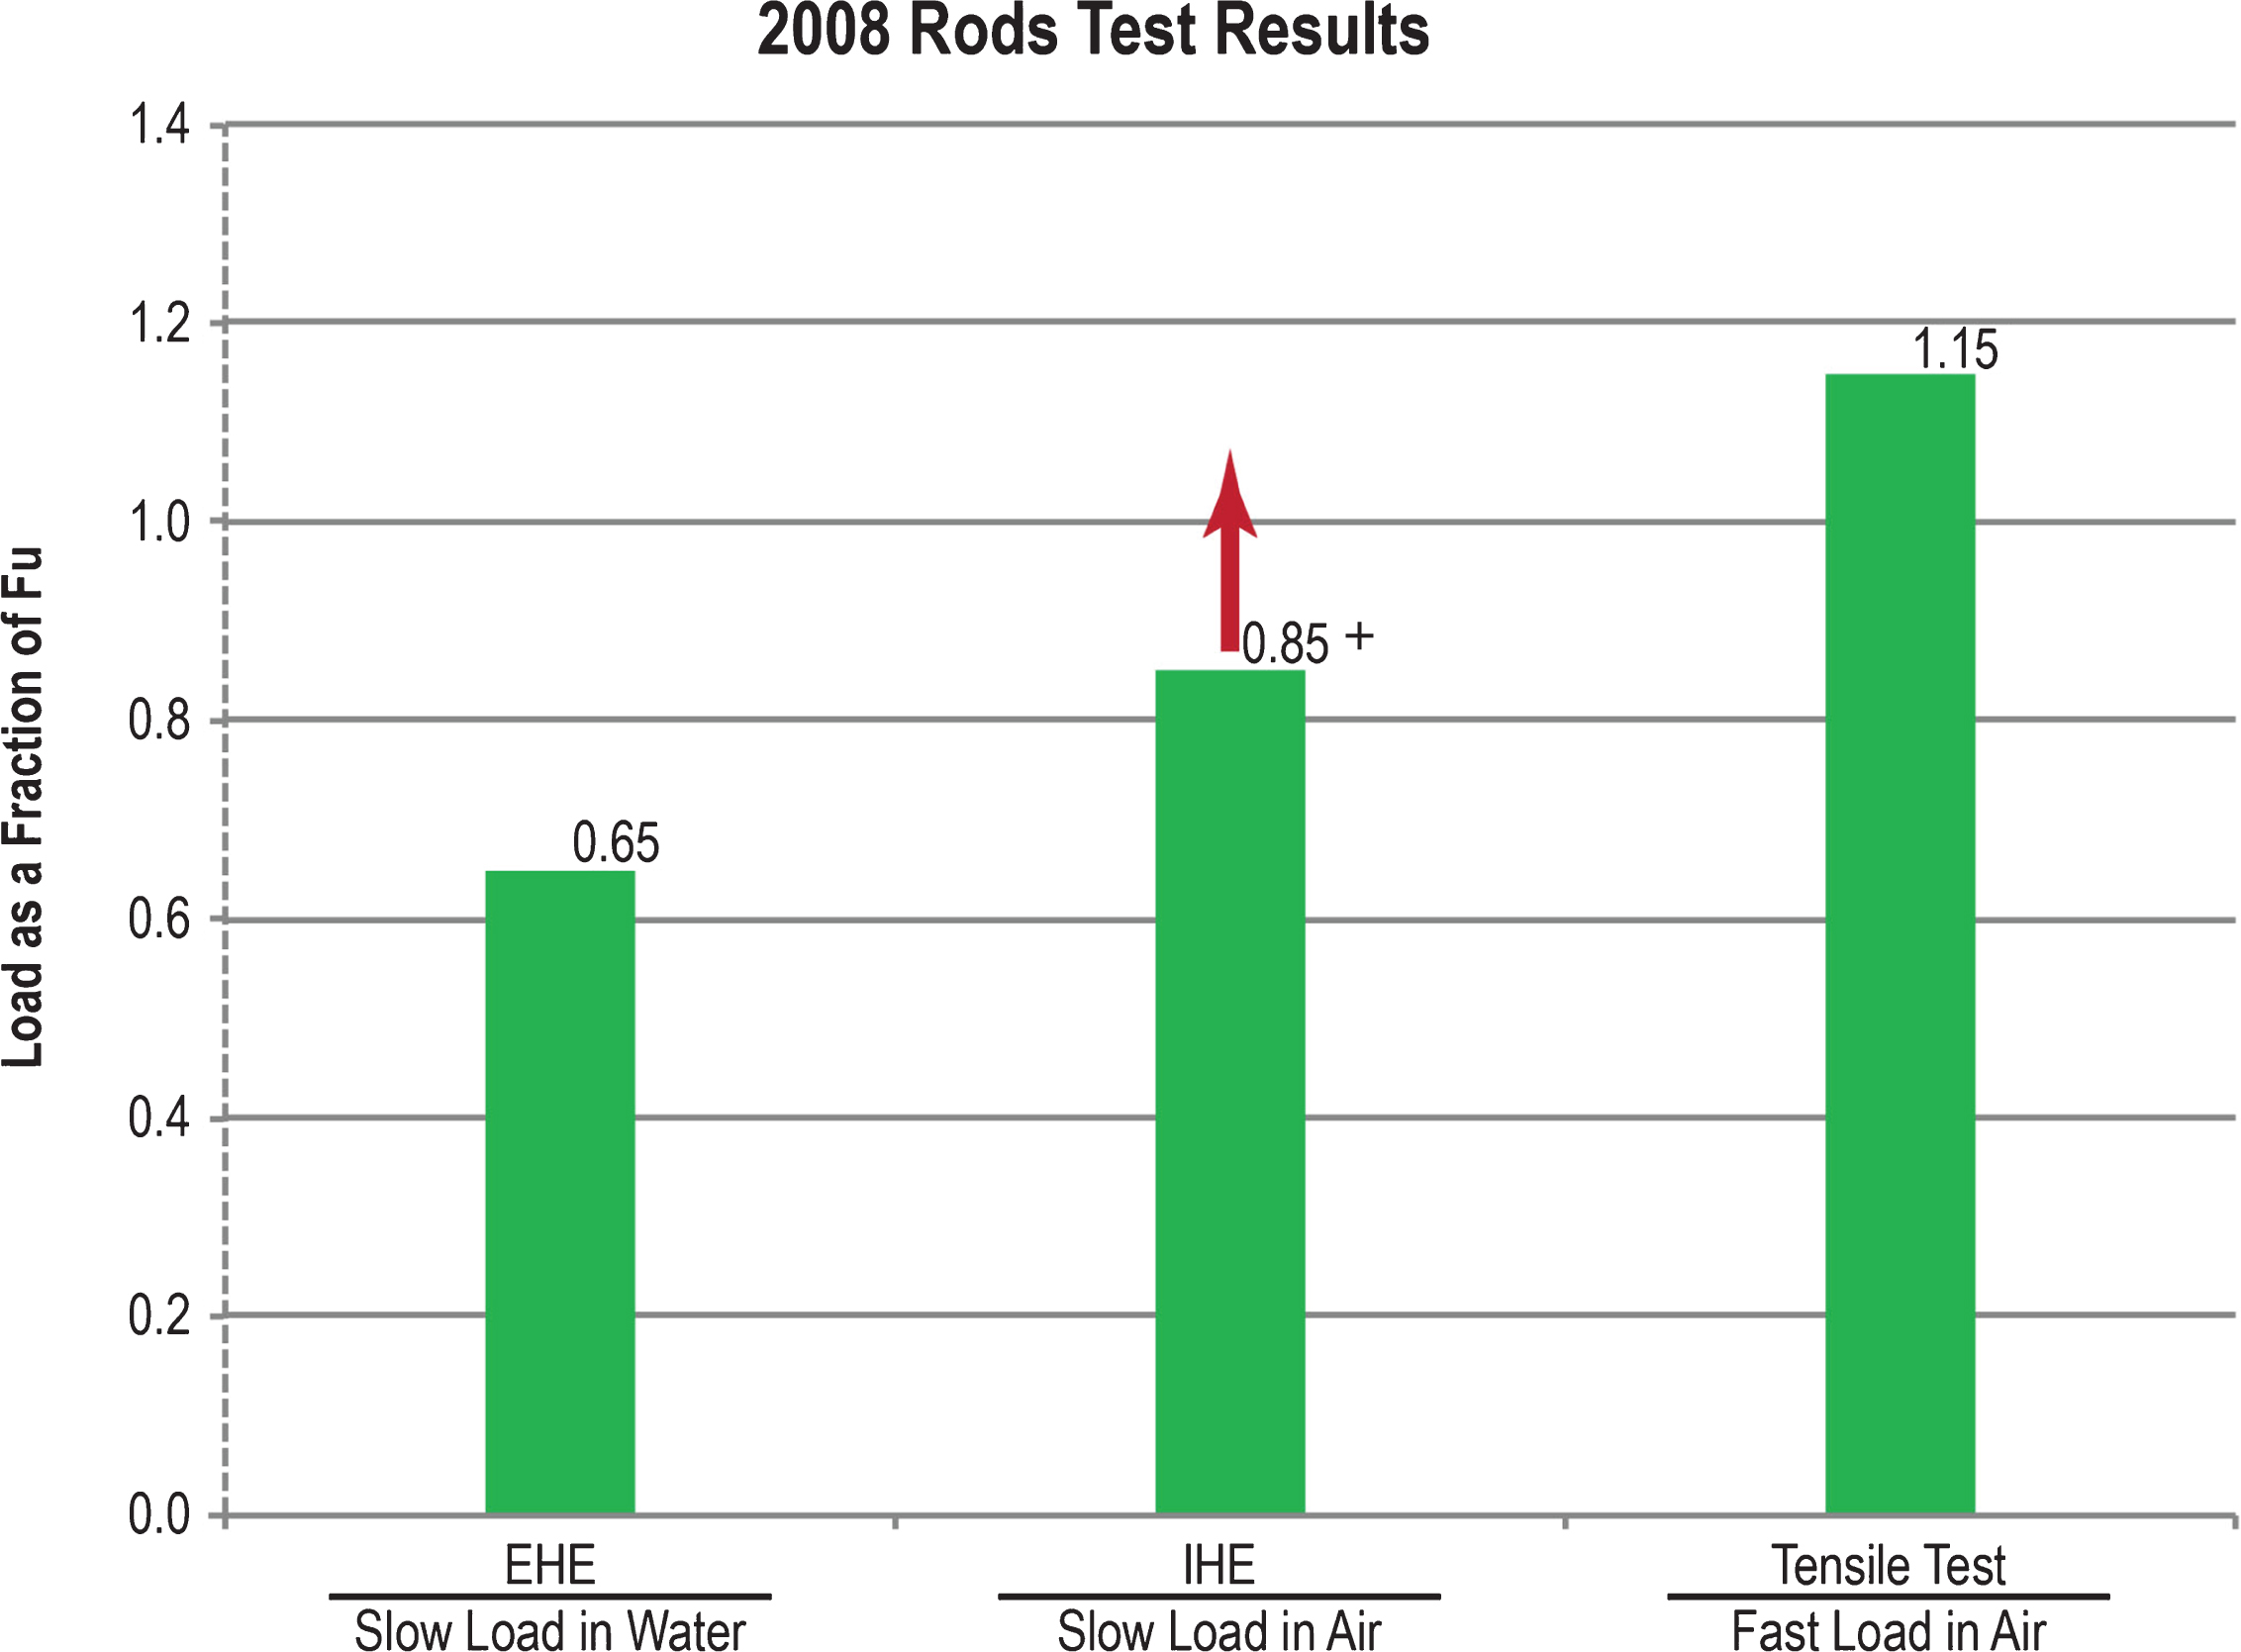
Fig.12
EHE threshold, applied load, and capacity with supplemental barrier.
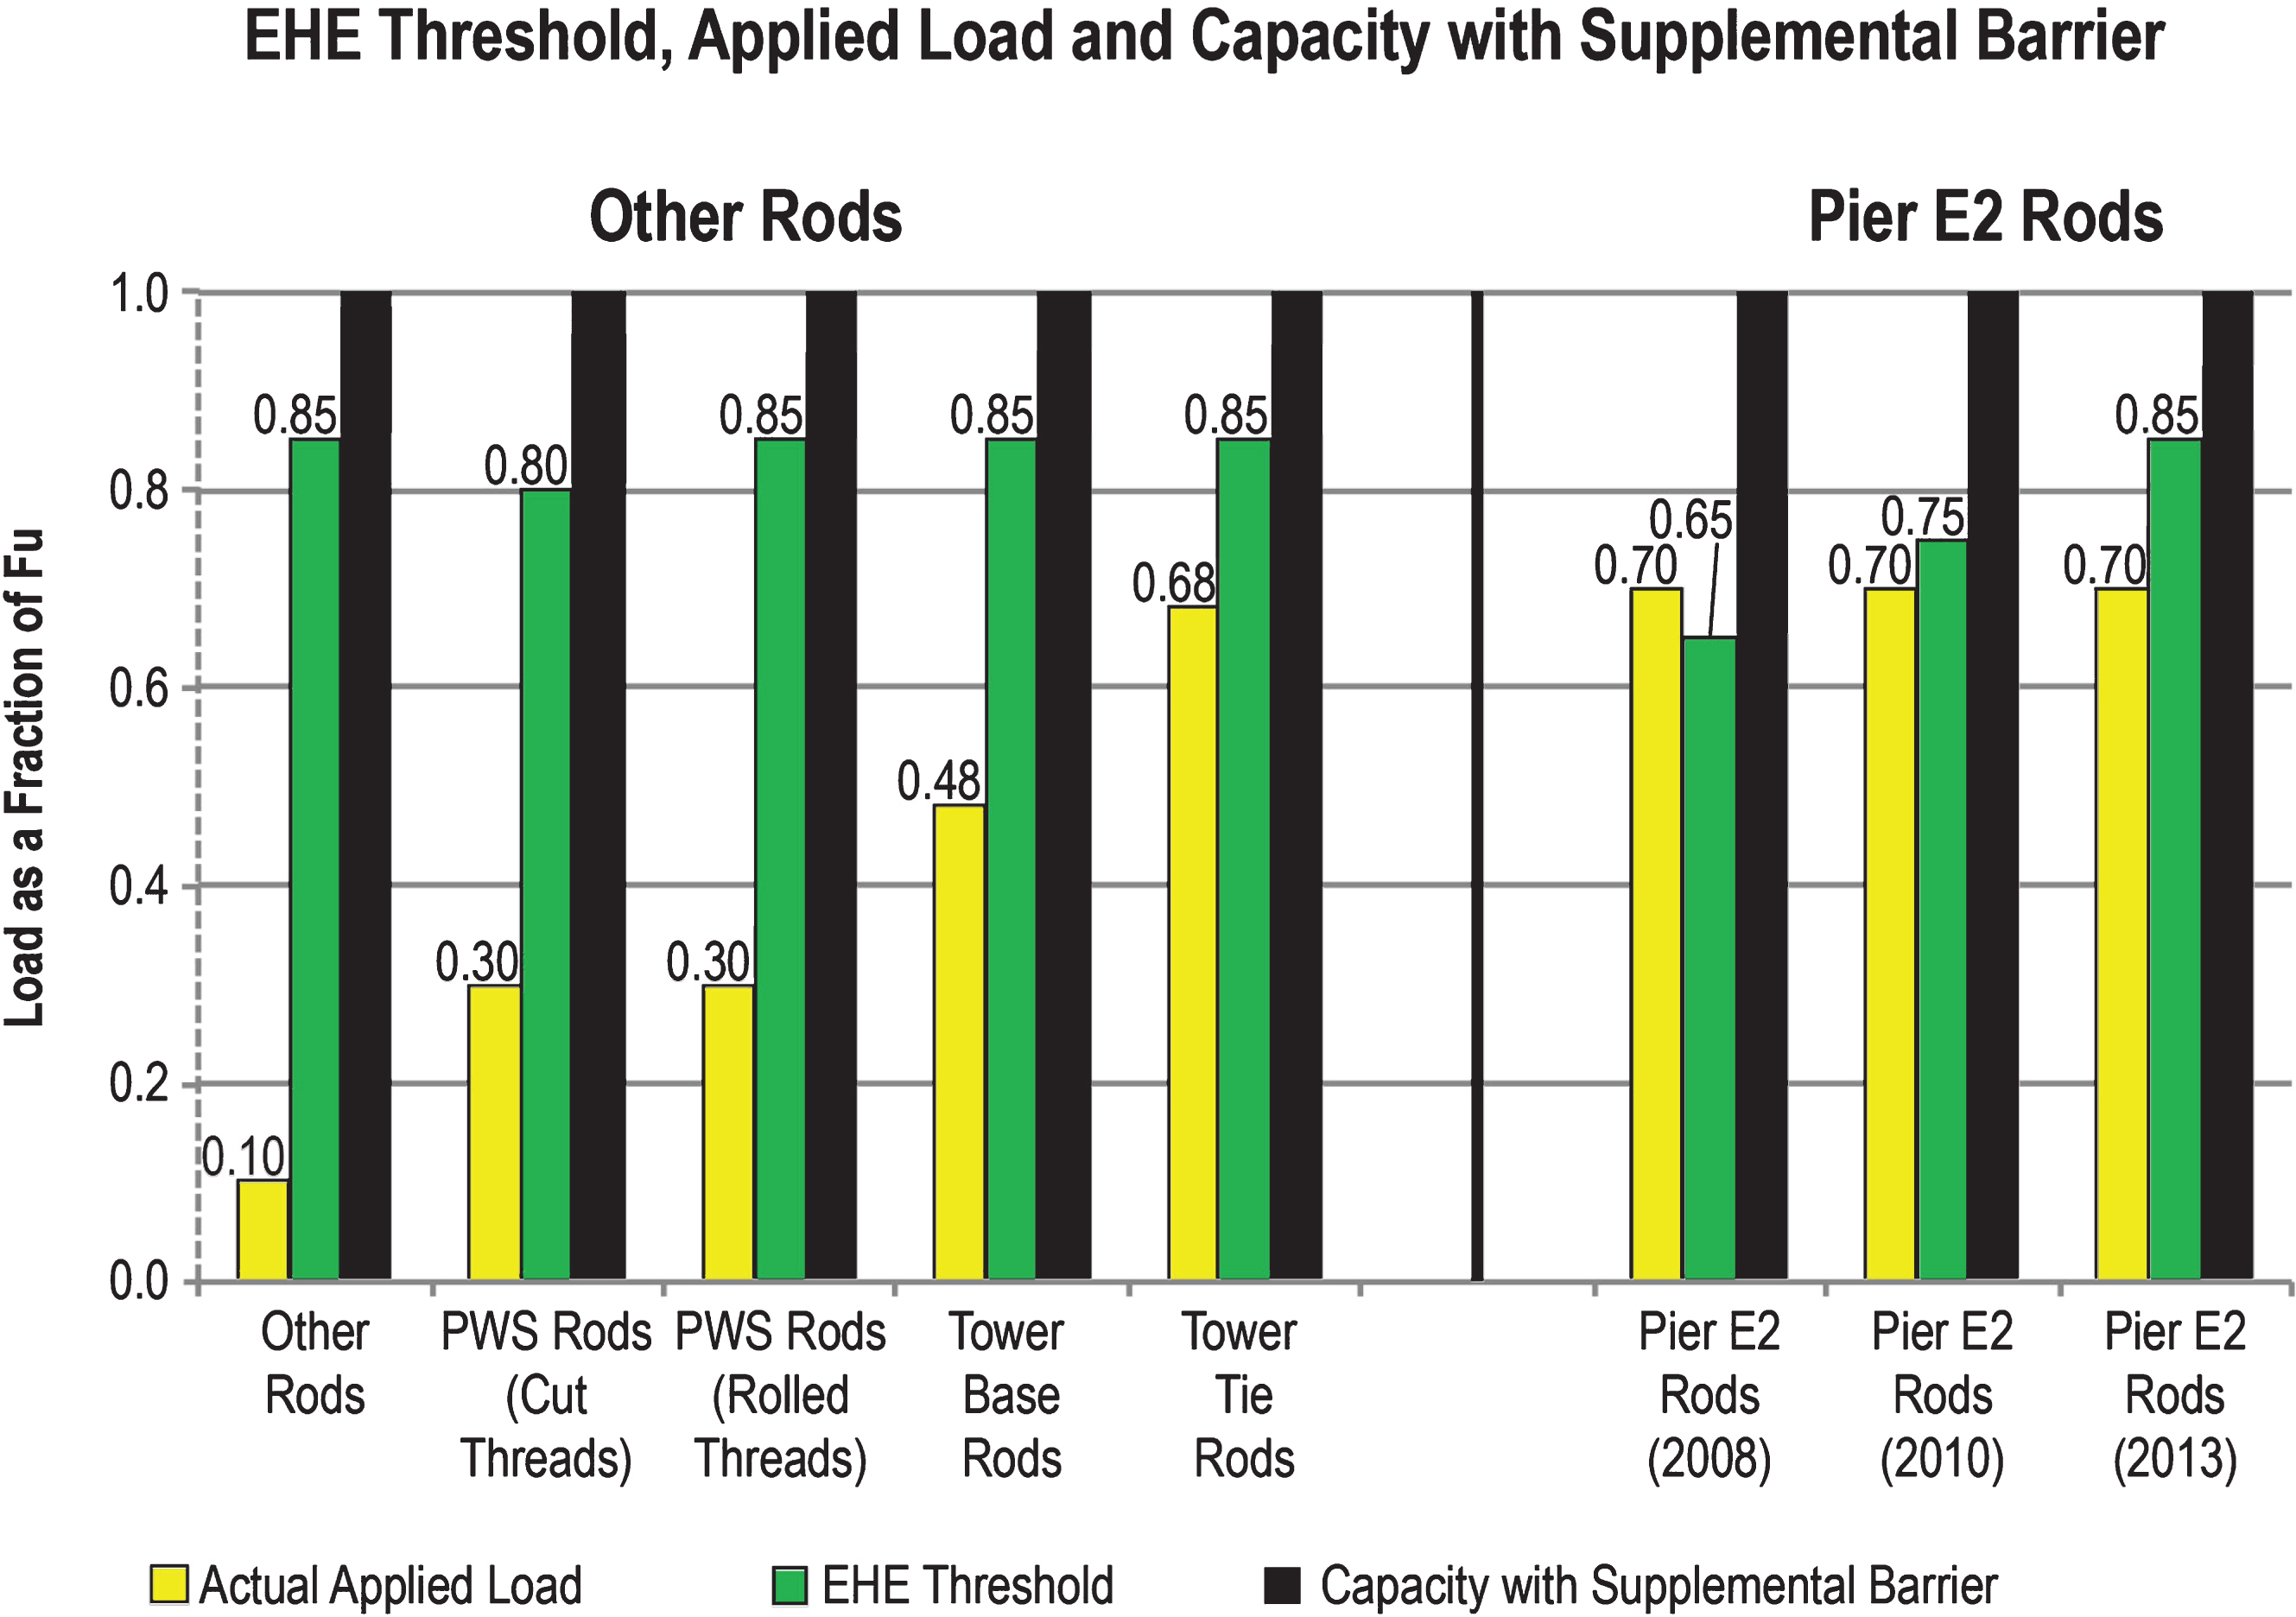
Table 1
Test rods
| Phase | Rod | Identification | Thread | Diameter |
| No. | Type | (inch) | ||
| 1 | 1 | Pier E2 Bearing Anchor Rods (2010) — Bottom Rod ID B1-F4 | Cut | 3 |
| 2 | Pier E2 Bearing Anchor Rods (2010) — Bottom Rod ID B2-F5 | Cut | 3 | |
| 3 | Pier E2 Shear Key Anchor Rods (2010) — Bottom Rod ID S3-D2 | Cut | 3 | |
| 4 | Pier E2 Shear Key Anchor Rods (2010) — Bottom Rod ID S4-E2 | Cut | 3 | |
| 2 | 5 | Pier E2 Bearing Rods — Top Housing Spare Rod | Rolled | 2 |
| 6 | Tower Anchorage Anchor Rods Vulcan, Rod ID b2W-6 | Cut | 3 | |
| 7 | Tower Saddle Tie Rods Rod ID 5 | Rolled | 4 | |
| 8 | PWS Anchor Rods (Main Cable) Rolled Threads, Rod ID E-118, Heat OYI | Rolled | 3.5 | |
| 9 | PWS Anchor Rods (Main Cable) Rolled Threads, Rod ID W-074, Heat OTD | Rolled | 3.5 | |
| 10 | PWS Anchor Rods (Main Cable) Cut Threads, Rod ID E-036, Heat OTD | Cut | 3.5 | |
| 11 | PWS Anchor Rods (Main Cable) Cut Threads, Rod ID E-110, Heat OOF | Cut | 3.5 | |
| 3 | 12 | Pier E2 Shear Key (S1/S2) Anchor Rods (2008) — | Cut | 3 |
| Bottom Rod ID S2-A8, Heat MJF-32, Top Threads | ||||
| 13 | Pier E2 Shear Key (S1/S2) Anchor Rods (2008) — | Cut | 3 | |
| Bottom Rod ID S2-A8, Heat MJF-32, Bottom Threads | ||||
| 4 | 14 | Pier E2 2013 Replacement Anchor | Cut | 3 |
| Rods (CCO 312) Rod ID EB-2-03, Galvanized | ||||
| 15 | Pier E2 2013 Replacement Anchor Rods | Cut | 3 | |
| (CCO 312) Rod ID EB-2-08, Galvanized | ||||
| 16 | Pier E2 2013 Replacement Anchor | Cut | 3 | |
| Rods (CCO 312) Rod ID SK-3-06, Ungalvanized | ||||
| 17 | Pier E2 2013 Replacement Anchor Rods | Cut | 3 | |
| (CCO 312) Rod ID SK-3-13, Ungalvanized | ||||
| 5 | 18 | Pier E2 Shear Key (S1/S2) Anchor Rods (2008) — | Cut | 3 |
| Bottom Rod ID S1-A7, Bottom Threads, Dry Test | ||||
| 19 | Pier E2 Shear Key (S1/S2) Anchor Rods (2008) — | Cut | 3 | |
| Bottom Rod ID S2-H6, Bottom Threads, Dry Test |
Table 2
Test loading schedule
| Rods with Diameter | Rods with Diameter | ||||
| 2-1/2” and under | over 2-1/2” | ||||
| Load | Stress, | Days | Load | Stress, | Days |
| % Fu | ksi | % Fu | ksi | ||
| 30 | 45 | 2 | 30 | 42 | 2 |
| 40 | 60 | 2 | 40 | 56 | 2 |
| 50 | 75 | 2 | 50 | 70 | 2 |
| 55 | 83 | 2 | 55 | 77 | 2 |
| 60 | 90 | 2 | 60 | 84 | 2 |
| 65 | 98 | 2 | 65 | 91 | 2 |
| 70 | 105 | 2 | 70 | 98 | 2 |
| 75 | 113 | 2 | 75 | 105 | 2 |
| 80 | 120 | 2 | 80 | 112 | 2 |
| 85 | 128 | 6 | 85 | 119 | 6 |
Table 3
Test results
| Phase | Rod | Max | Lab Average | Impact Toughness | Potential at | Intergranular | EHE |
| No. | No. | Load | Hardness | CVN ft- | Final Load Volts vs. | Cracking | Threshold |
| % Fu | HRC at Root | lbs @ 40F | Saturated | Detected | % Fu | ||
| Calomel Electrode | in SEM? | ||||||
| 1 | 1 | 85 | 37 | 37 | –0.92 | Yes | 80 |
| 2 | 80 | 37 | 37 | –0.92 | Yes | 75 | |
| 3 | 111 | 39 | 37 | –0.90 | No | 85 | |
| 4 | 85 | 36 | 38 | –0.93 | Yes | 80 | |
| 2 | 5 | 101 | 40 | 29 | –0.88 | No | 85 |
| 6 | 117 | 38 | 39 | –0.87 | No | 85 | |
| 7 | 111 | 36 | 20 | –0.96 | No | 85 | |
| 8 | 110 | 35 | 50 | –0.91 | No | 85 | |
| 9 | 118 | 39 | 36 | –1.01 | No | 85 | |
| 10 | 110 | 38 | 39 | –0.99 | Yes | 80 | |
| 11 | 120 | 41 | 34 | –0.92 | Yes | 80 | |
| 3 | 12 | 70 | 36 | 14 | –1.01 | Yes | 65 |
| 13 | 70 | 35 | 15 | –1.01 | Yes | 65 | |
| 4 | 14 | 109 | NA | 48 | –0.96 | No | 85 |
| 15 | 110 | NA | 48 | –0.94 | No | 85 | |
| 16 | 113 | NA | 47 | –0.70 | No | 85 | |
| 17 | 115 | NA | 47 | –0.70 | No | 85 | |
| 5 | 18 | 115 | NA | NA | Dry Test | No | 85 |
| 19 | 115 | NA | NA | Dry Test | No | 85 |
*NA denotes results interpretation in progress.


