
Parametric optimization and comparative study of machine learning and deep learning algorithms for breast cancer diagnosis
Abstract
Breast Cancer is the leading form of cancer found in women and a major cause of increased mortality rates among them. However, manual diagnosis of the disease is time-consuming and often limited by the availability of screening systems. Thus, there is a pressing need for an automatic diagnosis system that can quickly detect cancer in its early stages. Data mining and machine learning techniques have emerged as valuable tools in developing such a system. In this study we investigated the performance of several machine learning models on the Wisconsin Breast Cancer (original) dataset with a particular emphasis on finding which models perform the best for breast cancer diagnosis. The study also explores the contrast between the proposed ANN methodology and conventional machine learning techniques. The comparison between the methods employed in the current study and those utilized in earlier research on the Wisconsin Breast Cancer dataset is also compared. The findings of this study are in line with those of previous studies which also highlighted the efficacy of SVM, Decision Tree, CART, ANN, and ELM ANN for breast cancer detection. Several classifiers achieved high accuracy, precision and F1 scores for benign and malignant tumours, respectively. It is also found that models with hyperparameter adjustment performed better than those without and boosting methods like as XGBoost, Adaboost, and Gradient Boost consistently performed well across benign and malignant tumours. The study emphasizes the significance of hyperparameter tuning and the efficacy of boosting algorithms in addressing the complexity and nonlinearity of data. Using the Wisconsin Breast Cancer (original) dataset, a detailed summary of the current status of research on breast cancer diagnosis is provided.
1.Introduction
The increase in occurrences of breast cancer worldwide owing to many factors has instilled a natural fear of the disease in many women. Education about the onset and prognosis of disease is thus crucial as much as the developments in the technological advancement of diagnostic science of the disease. In certain parts of the world such as, India and USA, breast cancer is the most common type occurring in women, accounting for nearly 2,87,000 new cases alone in the USA in the year 2022 and 1,78,000 in India in 2020 [1]. These cases also increase the number of deaths. 43,000 women have died in the USA in 2022 according to the National Breast Cancer Foundation.
An unnatural growth of cells is a tumor. It develops when cells don’t die on schedule or multiply more than they need to [2]. A tumor may be benign or malignant (cancerous) (not cancerous). Unless it pushes on a neighboring structure or produces other symptoms, a benign tumor normally does not pose a major threat. Neoplasm is another synonym for tumor. The five-year survival rate for Stage I is reported 95%, for Stage II 92% and 70% for stage III and merely 21% for patients belonging to the Stage IV [3]. As the disease progresses, the chances of survival significantly drop. Hence modern technological solutions have been developing for better diagnosis of the malignancies found in the breast. These include data mining and machine learning algorithms. Consequently, picking the most effective algorithm out of all the available is most necessary part of the problem.
In business and healthcare applications, data mining serves the purpose of analysing vast datasets to uncover meaningful patterns and insights [29,30]. These valuable data patterns aid in predicting business trends and making informed decisions. In the healthcare sector, data mining plays a crucial role in optimizing efficiency, elevating patient quality of life, and, most importantly, saving more lives by identifying potential improvements and cost-saving opportunities. Techniques such as ML, database, statistics, data warehouse, deep learning neural network assist in the detection of different types of cancers [4].
Three tests make up the traditional approach: a clinical examination, radiological imaging, and a pathology test [5]. Modern machine learning focuses on model creation [37], while conventional methods use regression to detect cancer [33]. The model shows promising results in training, testing, and predicting unseen data. The three key tactics in machine learning are pre-processing, feature selection, and classification. Feature extraction, a core component of machine learning, aids in diagnosing and prognosing cancer and distinguishing benign from malignant tumours. The following research issues are addressed, and the deep learning models are highlighted in this study along with their effectiveness, datasets used, and potential for breast cancer detection and classification:
Which machine learning models perform most effectively?
How our proposed ANN technique compares with conventional machine learning techniques?
Comparative analysis of the methods used in our paper with other researches on the Wisconsin Breast Cancer Dataset (original).
The remainder of this paper is organized as follows: Related research including surveys on the subject of breast cancer is included in Section 2. The approach for this study is described in Section 3. The collected results and pertinent considerations are presented in Section 4. Section 5 mentions the clinical implications of the study. Section 6 comes to a conclusion and offers ideas for other study possibilities.
2.Related works
There have been many researches on breast cancer detection through machine learning [39] and data mining techniques, in this section we will go through previous work on multiple datasets including Wisconsin Breast Cancer Dataset (Original), Wisconsin Breast Cancer Dataset (Diagnostic) and others as shown in Table 1.
In this [6] study, Ahmed et al. used a dataset of 1189 records and 22 predictor variables to create prediction models for breast cancer recurrence in patients. Artificial neural networks (ANN), Support vector machines (SVM), and decision trees (C4.5) were used, and their sensitivity, specificity, and accuracy were evaluated. The outcomes demonstrated that the SVM model, which had an accuracy of 0.957, was the most accurate, followed by the DT model (0.936), and the ANN model (0.947). This [6] study shows the promise of data mining methods, such machine learning algorithms, for creating recurrence prediction models for breast cancer. To confirm these results and examine their use in different medical settings, more study is required.
In this [7] paper, Chandra P. Utomo et al. used the Breast Cancer Wisconsin Dataset to develop an ANN using an extreme learning machine approach for breast cancer diagnosis, outperforming the traditional Back Propagation ANN in terms of performance. In the training phase, K-fold cross validation with 5 folds was performed, and performance was assessed using specificity and sensitivity as additional precision metrics. The findings demonstrated that ELM ANN [8] was a superior generalization model for the Breast Cancer Wisconsin Dataset, outperforming Back Propagation ANN in terms of identifying breast cancer.
Jyotismita and Sanjib in their work [9], used data mining techniques to identify the early signs of breast cancer. They used the WEKA data mining programme to carry out their experiment in order to distinguish between benign and malignant breast tumors using the ZeroR and J48 classification algorithms. When compared to J48, which delivered 95.37% accuracy, the ZeroR algorithm did very badly, achieving just approximately 63.86%.
Table 1
Performance metrics of reviewed papers
| Reference | Dataset | Algorithm | Accuracy | Advantages | Disadvantages |
| [6] | ICBC (1997–2008) National Cancer Institute of Terhan | SVM, Decision Tree, ANN (MLP) | 95.7 (SVM-highest of all) | SVM is Effective in high-dimensional spaces, which is useful for datasets with many features. It can handle non-linearly separable data, which is common in medical datasets | SVMs are sensitive to kernel choice and parameters, impacting ICBC dataset performance. Slow training on large datasets can be a limitation due to hardware constraints. |
| [7] | Wisconsin Breast Cancer (original) | ELM ANN, BP ANN | 96.4 (ELM ANN) | ANNs can handle both categorical and numerical data, which is appropriate for the Wisconsin Breast Cancer (original) dataset. | ELMs’ performance on Wisconsin Breast Cancer data depends on activation function and parameters selection sensitivity. |
| [9] | Wisconsin Breast Cancer (original) | ZeroR, J48 | 95.37 (J48) | ZeroR was used as a baseline model for comparison with more complex models. | Ignored feature-target relationships, leading to slightly poorer predictive performance. |
| [10] | Wisconsin Breast Cancer (original) | SVM with LibSVM and SMO (Sequential Minimal Optimization), | 96.69 (SVM with SMO) | SVM with SMO: Efficient for large datasets, complex kernels. Advantageous for Wisconsin Breast Cancer (original) dataset. | SMO’s limitation with noisy data affects Wisconsin Breast Cancer dataset, requiring pre-processing. Computationally expensive vs. MLP (ANN). |
| [15] | Wisconsin Breast Cancer (diagnostic) | SVM, Decision Tree, KNN | 98.10 (SVM-highest of all) | SVM handled linear/nonlinear relationships, boosting predictive performance with features and target variable. | Sensitive regularization choice prevents overfitting/underfitting. Careful parameter selection is vital for optimal model performance. |
| [16] | SEER | Multiple Kernel Learning DSS Model (SVM combined with Random Optimization) | 86.00 | Random optimization finds optimal kernel combinations and weights for better predictive performance than grid search or manual tuning. MKL enhances model predictions by combining multiple kernels. | MKL’s complexity is high, demanding time and resources for training. Best results require careful kernel and weight experimentation. SEER not ideal due to dimensionality and noise. |
| [17] | Wisconsin Breast Cancer (diagnostic) | LR, SVM, KNN | 92.70 (SVM-highest of all) | SVMs can handle non-linearly separable data, which is common in medical datasets. | SVMs can be sensitive to noisy or overlapping classes, which was a limitation for the Wisconsin Breast Cancer (diagnostic) dataset. |
Table 1 (Continued)
| Reference | Dataset | Algorithm | Accuracy | Advantages | Disadvantages |
| [18] | Wisconsin Breast Cancer (diagnostic) | SVM using Modified Recursive Feature Elimination Algorithm with 4 variants of kernel | 99.00 (SVM with Linear Kernel) | Modified RFE reduces dataset dimensionality, enhances model generalization, an advantage for Wisconsin Breast Cancer (diagnostic) dataset. | Modified RFE may not be effective if the dataset has noisy or missing data, and thus it required additional data pre-processing to address. |
| [20] | Adyar Cancer Institute, Chennai, Tamilnadu, India | J48, CART, ADTree | 98.50 (CART) | CART (Classification and Regression Trees) and J48 (C4.5) are decision tree-based algorithms that are easy to interpret and can handle both numerical and categorical data, | Decision tree-based algorithms may not perform well if the dataset has a large number of features or missing data, which was the case for Adyar Cancer Institute Dataset |
Ebru Aydındag and Pınar Kırcı, conducted their [10] research on the Wisconsin Breast Cancer Dataset (original) using SVM and ANN techniques for the prediction and classification of breast cancer. They also used the WEKA tool for visualization, analysis and classification. The novelty in their work includes SMO (Sequential Minimal Optimization) [11] and LibSVM [12] usage as the classification algorithm in SVM in WEKA software. They also included the AUC value of their experiments. SMO produced an accuracy of 96.69% while LibSVM produced nearly 95.53% accuracy with 0.968 and 0.964 as AUCs respectively. They used a Multi-Layer Perceptron [13] and Voted perceptron [14] as their ANN model, producing 95.42% and 90.98% accuracy respectively and 0.988 and 0.929 as their respective AUC scores. Their study showed that ANNs do not generally outperform conventional ML techniques on the Wisconsin Breast Cancer Dataset (original).
Omar et al. conducted a study [15] comparing three machine-learning classifiers (Support Vector Machine, K-nearest Neighbors, and Decision Tree) to identify the best classifier for breast cancer classification. The research utilized the Wisconsin Breast Cancer Dataset (Diagnostic) with the main goal of determining the most accurate classifier. The results revealed that quadratic support vector machines achieved the highest accuracy (98.1%) and the lowest false discovery rates. The experiments were conducted using Matlab, which has a specialized toolbox for machine learning methods.
Ferroni et al. [16] developed a machine learning-based decision support system (DSS) for breast cancer prediction, demonstrating impressive outcomes with a test set of 136 patients (C-index of 0.84 and accuracy of 86%) and a training set of 318 patients. The model was evaluated using a 3-fold cross-validation method and was based on multiple kernel learning and random optimization models. Based on the area under the curve, the researchers determined that ML-RO-4 performed the best (AUC). A promising method for predicting the prognosis of breast cancer, the DSS model shown great performance in the testing set and the capacity to divide patients into low- and high-risk categories.
Using machine learning techniques, Shravya Ch. et al. [17] describe a condensed method for classifying benign and malignant tumors. A 32-attribute dataset from the UCI repository was utilized in the study along with Logistic Regression, SVM, and KNN. SVM produced the best results with an accuracy of 92.7% using PCA for feature extraction. The findings suggest that multidimensional data and various feature selection, classification, and dimensionality reduction strategies can offer practical inference-supporting tools [36]. The goal of future study should be to enhance performance by investigating more models and ensemble-based models.
A machine learning-based Internet of Things diagnostic system for identifying breast cancer is presented in this paper [18]. Wisconsin Diagnostic Breast Cancer has 569 data records, 30 real-valued characteristics, 357 benign cases, and 212 malignant cases in the dataset. The best features were extracted using a Modified Recursive Feature Elimination Algorithm [19] following data pre-processing. Following that, an SVM model with four kernel values—linear, RBF, polynomial, and sigmoid—was applied to the feature set. Metrics including accuracy, specificity, precision, F1-score, MCC, classification error, and execution time were used to gauge the model’s performance. Overall, the suggested system correctly distinguished between breast cancer patients and healthy individuals, and the results demonstrated that the SVM model performed well for all four kernel values.
Three predictive classification methods for identifying breast cancer from mammogram images were given by Padmarpriay B. and Velmurugan T. [20] J48, CART, and ADTree were the three algorithms. These models’ effectiveness was precisely assessed using their specificity, sensitivity, and Kappa statistics. 250 instances of individuals between the ages of 20 and 72 were collected in the DICOM image format from the Cancer Institute, Adyar, Chennai, Tamilnadu, India and used in the tests. Pre-processing was categorized based on each of the nine selected characteristics’ values. The findings revealed that the accuracy of the CART algorithm was 98.50%, while that of ADTree [21] and J48 was 97.70% and 98.10%, respectively.
Fig. 1.
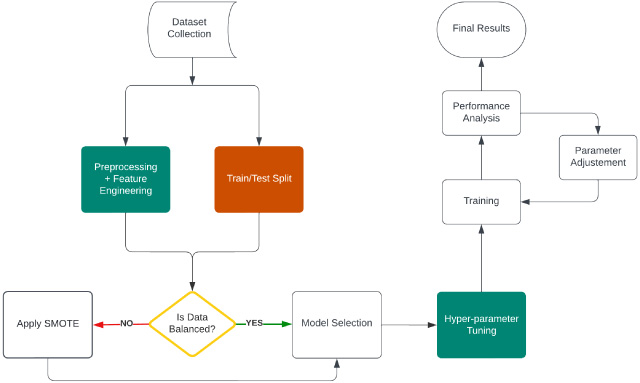
Experiment workflow with Wisconsin dataset.
3.Experimental methods
To carry out a complete data preparation and feature engineering approach, we have principally used 10 supervised machine learning classification algorithms, including specialized boosting-based ensemble algorithms like XgBoost, AdaBoost, and LGBM classifier and proposed a single ANN based custom classifier to cater our solution to the classification problem. Data collection, pre-processing, feature engineering, data exploration, model training, and model performance assessment are the primary processes in this suggested technique. The feature selection, outlier elimination, and skewness correction of the characteristics are all included in the data pre-processing approach. In addition, a thorough data exploration approach is performed to extract meaning from the data and spot trends. The chosen methods are then used to train the model after that. Finally, a variety of performance indicators are used to assess the performance of the model. The challenge of categorization is effectively and efficiently solved by this thorough procedure. Flow diagram for the proposed method is shown in Fig. 1.
3.1.Data pre-processing
The researchers obtained the Wisconsin Breast Cancer Dataset (Original) from the UCI Machine Learning Repository for analysis. The dataset consists of 683 instances classified as benign and malignant, with 11 integer-valued attributes. The dataset comprises of 444 classes of benign class and 239 samples of malignant samples.
In addition to the approaches employed, the performance and precision of the prediction model are also affected by the quality of the dataset and the pre-processing procedures. Preprocessing refers to the activities performed on a dataset prior to the deployment of machine learning techniques. At this stage, the dataset must be prepared and modified so that the algorithm can perceive it. Datasets may have errors, missing data, redundancy, noise, and other issues that hinder the machine learning algorithm from directly utilizing them. Another difficulty is the size of the dataset. When a dataset has a large number of characteristics, it may be more difficult for the algorithm to analyse the data, identify trends, and make precise predictions. Such difficulties can be resolved by evaluating the dataset and employing the right data pre-treatment processes. Depending on the nature of the dataset, the data pre-processing approach may additionally include feature selection, data normalization, missing value imputation, and data cleansing.
Fig. 2.
Correlation matrix.
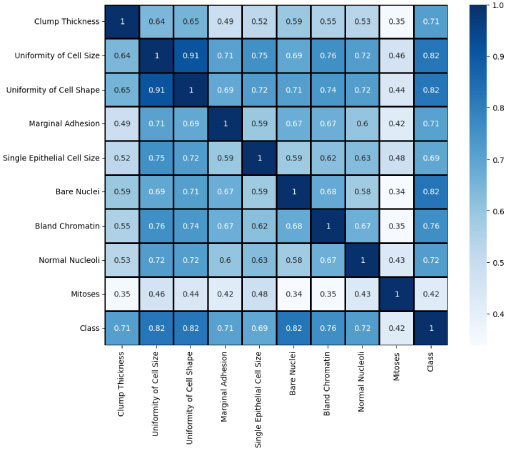
Fig. 3.
Data distribution of features.
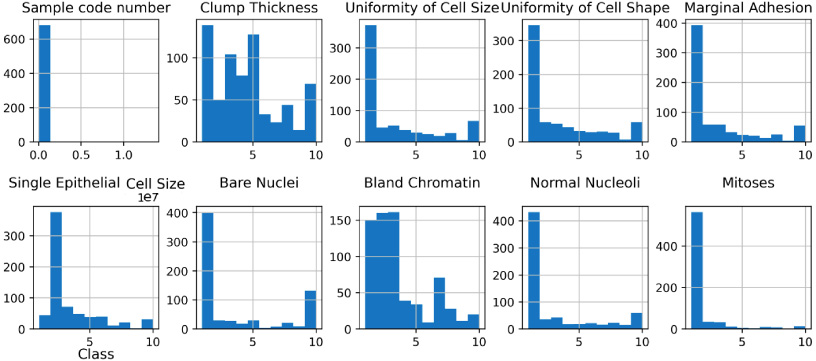
We removed the ‘sample code number’ since it merely served the purpose of identifying the data and was not necessary for our purposes. We also used the StandardScaler [32] method for normalizing data by subtraction of the mean and scaling to unit variance. It is used to alter features by scaling each attribute to a defined range. This is crucial for the proper operation of many machine learning algorithms. It is also used to minimize the impact of outliers and make the dataset more normally distributed, hence enhancing the accuracy of certain models. We applied this scaler on our dataset. We also studied the inter-dependency of every feature with each other which is then used to select the most important features to feed in the machine learning models, the values of correlation of features is visualised in Fig. 2 in the form of correlation matrix. The data distribution of important features is also visualized in Fig. 3 since it is an important part of building machine learning models for classification purposes. Analysing the distribution of data helps in gaining insights into the various properties of the dataset and aids in making informed decisions during the feature selection and model building phases.
The Pearson correlation matrix assesses the linear relationship between variables. It employs the correlation coefficient (r) to quantify the strength and direction of this relationship. xi and yi are the individual values of the x and y variables, respectively, while x and y represent their respective means. The matrix utilizes the correlation coefficient (r) to measure the linear relationship between variables. By comparing individual values (xi, yi) to their respective means (x, y), it identifies the strength and direction of the association. This matrix facilitates insights into dependencies and interactions within datasets. The equation corresponding to this is given in Eq. (1)
(1)
3.2.Feature engineering
Variable selection is used to optimize and streamline these processes by identifying and eliminating duplicate variables. A technique to achieve this is by eliminating variables based on their correlation level. When two variables are highly correlated, they tend to provide nearly identical results for an observation due to their linear relationship [22]. Prior to model training, removing one of the correlated variables aids the learning process and can yield results comparable to those obtained from the complete model [23]. We found that ‘uniformity of cell shape’ and ‘uniformity of cell size’ are highly correlated as shown in Fig. 3 having correlated value of 0.91. Thus uniformity of cell shape is removed from the dataset arbitrarily. Consequently, the use of SMOTE [24] was necessitated by the extremely clear class imbalance between benign and malignant tumors and the absence of any additional imputation or processing requirements. After constructing the train: test split of 70:30, there were 478 instances of train data and 205 instances of test data. There were 317 occurrences of benign classes and 161 instances of malignant classes. Following the use of SMOTE, 317 instances of train data were generated from both benign and malignant classes.
The SMOTE algorithm utilizes an oversampling technique to rebalance the original training set. Unlike a simple replication of minority class occurrences, SMOTE focuses on generating synthetic examples. It achieves this by interpolating between several instances of the minority class within a specific neighborhood. This approach centers on the “feature space” rather than the “data space,” emphasizing the values of the features and their interrelationships, rather than analyzing data points as a whole [24].
In the SMOTE process, the algorithm starts by defining the minority class set A. For each sample x in set A, its k-nearest neighbours are identified based on Euclidean distance calculation. Subsequently, a sampling rate N is set based on the imbalance proportion. For each sample x in set A, N samples are randomly chosen from its k-nearest neighbours to create a new set A1. For each example xk in set A1, a new synthetic example is generated using the formula given in Eq. (2). It takes the difference between x and xk, multiplies it by a random number between 0 and 1, and adds it to the original sample x to generate a new unseen synthetic sample x′. This process is repeated for each sample in A1, resulting in a new set of synthetic samples that can be used to balance the class distribution of the dataset.
(2)
Constructing a model for predicting the disease class, i.e., whether a person has benign tumor or malignant, is the most crucial stage. We have utilized a variety of machine learning techniques for this purpose. Our problem statement is a binary class classification problem, and the approach is a Supervised Learning technique for classifying incoming observations based on predetermined criteria. The Supervised Learning technique [25] is the procedure through which a computer learns from a dataset or collection of observations and then applies this knowledge to classify additional observations into specified categories [38]. Classes may also be known as labels or objectives, depending on the context. It varies from regression in that it yields a categorical result rather than a numerical one. Following is a discussion of the models used to identify whether or not an individual has cardiovascular disease.
Ensemble-based classification algorithms are among the most often employed classification approaches for data streams [26]. Due to their higher performance compared to single-learner systems and their simplicity of implementation in real-world healthcare applications [27,31], their popularity has increased. Because ensemble methods may be paired with algorithms for drift detection and adaptive modifications, such as the selective deletion or addition of classifiers, they are particularly suitable for data stream learning. Our research focuses on classifying data using different ensemble models and comparing them to conventional machine learning techniques. To classify the presence of tumours, we employed a total of 11 machine learning models, including ensemble models such as AdaBoost, GradientBoost, XgBoost, LightGBM, and Random Forest, as well as classical machine learning models such as Support Vector Classifier, Decision Tree, and K-nearest neighbours and one ANN model that we had created.
Table 2
Hyperparameter used in various models
| Model | Parameters used |
| Logistic regression | max_iter=3000, intercept_scaling=0.5 |
| Decision tree classifier | ‘criterion’: ‘gini’, ‘max_depth’: 4, ‘min_samples_leaf’: 3, ‘min_samples_split’: 5 |
| Random forest classifier | ‘bootstrap’: True, ‘max_depth’: 3, ‘max_features’: ‘auto’, ‘min_samples_leaf’: 4, ‘min_samples_split’: 4, ‘n_estimators’: 80 |
| Support vector classifier | kernel=‘rbf’, probability=True, shrinking=False, cache_size=300, verbose=True |
| Naïve Bayes | var_smoothing=1e-8 |
| KNN | n_neighbors=6, weights=‘distance’, algorithm=‘ball_tree’, metric=‘manhattan’ |
| AdaBoost | ‘algorithm’: ‘SAMME’, ‘learning_rate’: 0.05, ‘n_estimators’: 70 |
| Gradient boosting | ‘learning_rate’: 0.1, ‘n_estimators’: 100, criterion: ‘mse’, subsample=0.8 |
| XgBoost | ‘learning_rate’: 0.2, ‘max_depth’: 2, ‘n_estimators’: 60 |
| LightGBM | ‘learning_rate’: 0.05, ‘n_estimators’: 120, ‘num_leaves’: 25 |
3.3.Model description
A summary of the machine learning models utilized in the analysis of the UCI breast cancer dataset has been provided in the Table 2. The models examined include Logistic Regression, Decision Tree Classifier, Random Forest Classifier, Support Vector Classifier, Naïve Bayes, KNN, AdaBoost, Gradient Boosting, XgBoost, and LightGBM. The parameters employed in training these models are also listed. Logistic Regression employed a maximum iteration of 5000 and an intercept scaling of 0.5. Decision Tree Classifier utilized a Gini criterion, a maximum depth of 5, a minimum number of samples per leaf of 1, and a minimum number of samples per split of 3. Random Forest Classifier employed bootstrap sampling, a maximum depth of 8, a maximum number of features of auto, a minimum number of samples per leaf of 1, a minimum number of samples per split of 2, and 48 estimators. Support Vector Classifier utilized a linear kernel, a probability setting of True, and verbose set to False. Naïve Bayes utilized a variance smoothing factor of 2e-9. KNN employed a nearest neighbour parameter of 5, with uniform weights, and the Minkowski distance metric. AdaBoost utilized the SAMME.R algorithm, a learning rate of 0.1, and 200 estimators. Gradient Boosting utilized a learning rate of 0.5 and 100 estimators. XgBoost employed a learning rate of 0.4, a maximum depth of 3, and 175 estimators. Finally, LightGBM employed a learning rate of 0.05, 200 estimators, and 50 leaves. Overall, these models and their associated parameters provide a comprehensive analysis of the UCI breast cancer dataset.
Fig. 4.
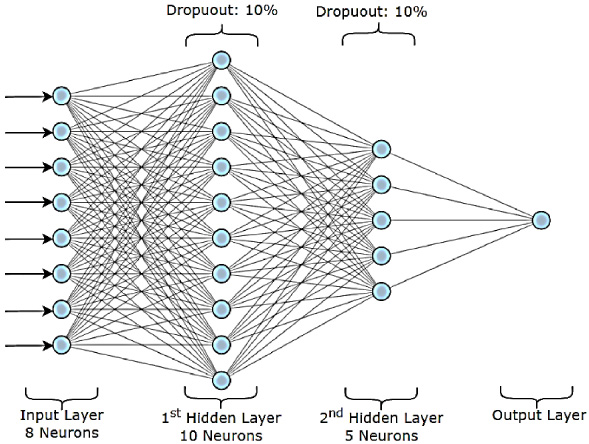
ANN classifier.
3.4.Proposed ANN classifier
Our proposed binary classification model is composed of a sequential network with two hidden layers and one output layer. The first hidden layer consists of 10 neurons and is linked to the input layer’s 8 neurons. There are 5 neurons in the second hidden layer, which is connected to the first hidden layer. The output layer has a single neuron coupled to the second hidden layer. Each hidden layer is given a dropout layer with 0.1 as the dropout rate to prevent overfitting. In the hidden layers, the Rectified Linear Unit (ReLU) is employed as the activation function, whereas the sigmoid function is utilized in the output layer as shown in Fig. 4.
The model was trained using the Adam optimizer and binary cross-entropy loss function. The training process involved 70 epochs with a batch size of 5. The model’s performance was evaluated using accuracy as the metric. The parameters used for training and their values are detailed in the Table 3.
4.Performance evaluation
Table 4 reveals an important finding that hyperparameter tuned models using Grid Search CV [28] outperformed non tuned models in terms of performance. As an illustration, the accuracy of the Random Forest Classifier with Hyperparameter tuning was 98.43% for class 2 and 98% for class 4, while the accuracy of the RFC without tuning was 96.48% for class 2 and 96% for class 4 in line with other studies [34]. This emphasises how crucial hyperparameter adjustment is to improve the performance of ML models.
Table 3
ANN model details
| Parameter | Value |
| Optimizer | Adam |
| Loss function | Binary cross-entropy |
| Metric | Accuracy |
| Epochs trained | 70 |
| Batch size | 5 |
| Optimal epoch range | 68–75 |
| Reason for epochs | Higher accuracy and avoiding overfitting |
| Hardware limitation | Memory accessibility |
| Experimented parameter | Batch size (due to hardware limitations) |
| Performance variance | Depends on hardware resources (variable) |
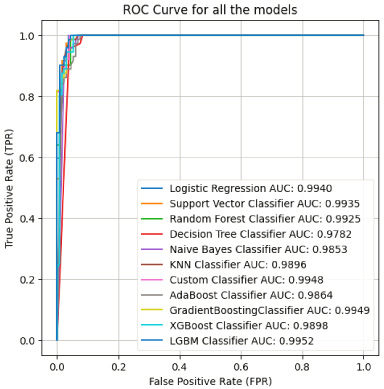
Another observation is that boosting algorithms such as AdaBoost, Gradient Boost, and XGBoost performed very consistently across both benign and malignant tumours, these methods produced results that were comparable, with precision, F1 score, and accuracy all falling within the range of 0.97 and 0.98. This suggests that boosting algorithms are robust and effective in handling the complexity and non-linearity of the data [35], and it can be observed from the given ROC curve in Fig. 5.
The accuracy of the custom classifier was 96.54% for class 2 and 96% for class 4, respectively. The custom classifier’s identity cannot be determined from the Table 4 preventing a comprehensive evaluation of its performance in comparison to other models, despite the fact that it did well.
The majority of research has employed the Support Vector Machine (SVM) algorithm for breast cancer detection, with the maximum accuracy reached between 98 and 99 percent. In specifically, the study [18] employing SVM with Modified Recursive Feature Elimination Algorithm and linear kernel reached 99% accuracy. In addition, research [15,17] have utilized SVM to achieve the greatest accuracy of 98.10% and 92.70%, respectively.
Table 4
Performance metrics
| Model | Class | Precision | F1 Score | Accuracy |
| Logistic regression | Benign | 0.96 | 0.98 | 97.65 |
| Malignant | 0.99 | 0.98 | ||
| Decision tree | Benign | 0.91 | 0.94 | 94.31 |
| Malignant | 0.97 | 0.94 | ||
| Random forest classifier | Benign | 0.99 | 0.98 | 98.43 |
| Malignant | 0.98 | 0.98 | ||
| Random forest classifier | Benign | 0.96 | 0.96 | 96.48 |
| Malignant | 0.97 | 0.96 | ||
| Support vector classifier | Benign | 0.96 | 0.98 | 97.65 |
| Malignant | 0.99 | 0.98 | ||
| Naïve Bayes | Benign | 0.98 | 0.98 | 98.04 |
| Malignant | 0.98 | 0.98 | ||
| KNN | Benign | 0.99 | 0.98 | 98.48 |
| Malignant | 0.98 | 0.98 | ||
| Decision Tree with hyperparameter tuning | Benign | 0.94 | 0.95 | 94.53 |
| Malignant | 0.96 | 0.94 | ||
| AdaBoost | Benign | 0.95 | 0.97 | 97.26 |
| Malignant | 0.99 | 0.97 | ||
| Gradient boost | Benign | 0.97 | 0.97 | 97.75 |
| Malignant | 0.97 | 0.97 | ||
| XGBoost | Benign | 0.98 | 0.98 | 97.27 |
| Malignant | 0.98 | 0.98 | ||
| LGBM Classifier with Hyperparameter tuning | Benign | 0.98 | 0.97 | 96.09 |
| Malignant | 0.95 | 0.96 | ||
| MLP — CustomClassifier | Benign | 0.97 | 0.96 | 96.54 |
| Malignant | 0.96 | 0.96 |
In addition to SVM, additional researches have utilized Decision Tree and CART, with the maximum accuracy achieved by CART in the study [20]. Some research also employed Artificial Neural Networks (ANN), Extreme Learning Machine Artificial Neural Network (ELM ANN), and Backpropagation Artificial Neural Network (BP ANN) with 96.4% accuracy. In other research, other algorithms such as Logistic Regression (LR), K-Nearest Neighbors (KNN), J48, ZeroR, and Multiple Kernel Learning DSS Model were utilized with varied degrees of precision. Next section elaborate the clinical implications of the study.
Fig. 5.
ROC curves.
5.Clinical implications
In the past five years, there has been a significant increase in the integration of AI in medicine [40], with a particular emphasis on developing AI-assisted solutions for treating cancer, especially breast cancer. Breast cancer remains a critical public health challenge, and its early detection is crucial for improving patient outcomes and reducing mortality rates. However, before implementing any automated solution in healthcare, it is essential to thoroughly evaluate its clinical implications, including verifying its safety, advantages, any possible disadvantages, and ensuring it meets regulatory compliance standards. One of the primary clinical implications of our study is the potential for improved diagnostic accuracy in breast cancer detection. Traditional diagnostic methods, such as mammography and biopsy, are effective but are subject to human error and variability. The application of ML and DL models can supplement these traditional methods by providing consistent and nuanced analysis. As per our experiments, high-performing boosting models can easily detect and differentiate between benign and malignant tumors. Such high accuracies can reduce false positives and false negatives, minimizing unnecessary biopsies and surgeries while ensuring that malignant cases are promptly treated.
The implementation of automated diagnostic systems can also lead to cost savings and improved accessibility. In resource-limited settings, where access to specialized healthcare professionals and diagnostic facilities may be scarce, these algorithms can serve as a supplementary diagnostic tool, providing valuable insights and potentially reducing the need for expensive diagnostic tests. We highlight the practicality of using widely available datasets and ML/DL models, suggesting that these technologies can be adapted and utilized in various healthcare settings, regardless of the availability of advanced medical infrastructure.
The use of ML and DL algorithms can also aid in the development of personalized treatment plans. By analysing a patient’s specific data, these models can predict the likely progression of the disease and suggest the most effective treatment options. For example, the use of ANNs and Extreme Learning Machines (ELM ANN) demonstrates the ability to analyze complex patterns within the data, which could be utilized to tailor treatment plans to individual patient profiles. This capability is particularly valuable in cases where the standard protocols may not be optimal for every patient, thereby paving the way for more personalized and targeted therapies. The integration of these algorithms into clinical workflows can streamline the diagnostic process. For instance, an automated system that pre-screens mammograms or biopsy results using ML/DL models could prioritize more intricate cases for radiologists and pathologists, allowing them to focus on the most critical cases. Our study also emphasizes the importance of hyperparameter tuning and boosting algorithms, suggesting that these optimizations can enhance the models’ performance, making them more practical for real-world clinical applications. Early detection of breast cancer is important for increasing survival rates. Our findings indicate that ML and DL algorithms can potentially identify malignancies at an early stage, even when clinical symptoms are not yet apparent. The ability to predict the disease’s progression and recurrence can also be invaluable for prognosis. For instance, models like SVM with various kernel functions and ensemble methods showed promising results in distinguishing early-stage cancers. Early detection through these models can lead to less aggressive treatments and better patient outcomes, including higher survival rates and improved quality of life.
Like any other research on AI-assisted healthcare, our study of ML and DL models in breast cancer diagnosis also raises important ethical and practical considerations. The reliance on data-driven models necessitates careful consideration of data privacy and security. Moreover, the interpretability of these models remains a challenge; clinicians must understand and trust the model outputs to integrate them into their decision-making process effectively. Future research should focus on developing explainable AI models and ensuring that these technologies are used responsibly in regular clinical practice.
6.Conclusion
The study examines the performance of several machine learning models on the original Wisconsin Breast Cancer dataset. Several models, including Logistic Regression, Decision Tree, Decision Tree with Hyperparameter tuning, Random Forest Classifier, Random Forest Classifier with Hyperparameter tuning, Support Vector Classifier, Naive Bayes, KNN, AdaBoost, Gradient Boost, XGBoost, LGBM Classifier with Hyperparameter tuning, and one MLP based Custom Classifier, achieved high accuracy, precision, and F1 scores for benign and malignant tumors.
The research determined that models with hyperparameter tuning outperformed those without. This emphasizes the significance of optimizing model parameters for maximum performance. In addition, boosting techniques like as XGBoost, AdaBoost, and Gradient Boost consistently performed well across both benign and malignant tumors, indicating the efficacy of these algorithms in managing the complexity and nonlinearity of the data.
Comparing the findings of this experiment with those of earlier research, as summarized in the Table 1, it can be seen that the experiment’s greatest level of accuracy, around 98%, is equivalent to the range of 98–99% recorded in previous investigations. Moreover, a number of models utilized in the experiment are consistent with the findings reported in previous studies which also highlighted the efficacy of SVM, Decision Tree, CART, ANN, ELM ANN. Majority of the previous research have utilized some variation of the SVM and it has consistently performed well across all of the breast cancer datasets that are discussed in this study. Besides that, it has been observed that linear kernel performs the best across Wisconsin Breast Cancer Dataset.
In conclusion, the current study illustrates the efficacy of multiple machine learning models in obtaining high diagnostic accuracy for breast cancer, and it can be stated that the Wisconsin Breast Cancer (original) dataset may be utilized successfully to evaluate the performance of these models. This study’s findings also emphasize the significance of hyper parameter tweaking and the efficacy of boosting algorithms in managing the complexity and nonlinearity of data.
Conflict of interest
The authors declare no conflict of interest.
References
[1] | International Agency for Research on Cancer. India Source: Globocan 2020 [cited 11 June 2021]. Available from: https://gco.iarc.fr/today/data/factsheets/populations/356-india-fact-sheets.pdf. |
[2] | Lu Y, , Li J-Y, , Su Y-T, , Liu A-A, A review of breast cancer detection in medical images, in: Proc. IEEE Vis. Commun. Image Process (VCIP). 1–4, 2018. |
[3] | Arumugham R, , Raj A, , Nagarajan M, , Vijilakshmi R, 327P - Survival analysis of breast cancer patients treated at a tertiary care centre in Southern India, Ann Oncol, 25: : iv107, (2014) . [Google Scholar]. |
[4] | Gupta MK, , Chandra P, A comprehensive survey of data mining, Int J Inf Technol, 1–15, (2020) . doi:10.1007/s41870-020-00427-7. |
[5] | Reddy A, , Soni B, , Reddy S, Breast cancer detection by leveraging machine learning, ICT Express, 6: (4)(2020) . doi:10.1016/j.icte.2020.04.009. |
[6] | Ghasem Ahmad L, , Eshlaghy A, , Pourebrahimi A, , Ebrahimi M, , Razavi A, Using three machine learning techniques for predicting breast cancer recurrence, J Health Med Inform, 4: : 124–130, (2013) . |
[7] | Prasetyo C, , Kardiana A, , Yuliwulandari R, Breast cancer diagnosis using artificial neural networks with extreme learning techniques, Int J Adv Res Artif Intell, 3: (7): 10–14, (2014) . doi:10.14569/IJARAI.2014.030703. |
[8] | Chen C, , Li K, , Duan M, , Li K, Chapter 6 - Extreme learning machine and its applications in big data processing, in: Hsu H-H, Chang C-Y, Hsu C-H (eds), Intelligent Data-Centric Systems, Big Data Analytics for Sensor-Network Collected Intelligence. 2017, ISBN 9780128093931, doi:10.1016/B978-0-12-809393-1.00006-4. |
[9] | Talukdar J, , Kalita SK, Detection of breast cancer using data mining tool (WEKA), Int J Sci Eng Res, 6: (11): 1124, (2015) . |
[10] | Bayrak EA, , Kırcı P, , Ensari T, Comparison of machine learning methods for breast cancer diagnosis, in: 2019 Scientific Meeting on Electrical-Electronics & Biomedical Engineering and Computer Science (EBBT). 1–3, 2019. doi:10.1109/EBBT.2019.8741990. |
[11] | Platt J, Sequential minimal optimization: a fast algorithm for training support vector machines, in: Advances in Kernel Methods-Support Vector Learning. 208, 1998. |
[12] | Chang C-C, , Lin C-J, LIBSVM: A library for support vector machines, ACM Trans Intell Syst Technol, 2: (3): 1–27, (2007) . |
[13] | Singh J, , Banerjee R, A study on single and multi-layer perceptron neural network, 35–40, 2019. doi:10.1109/ICCMC.2019.8819775. |
[14] | Freund Y, , Schapire R, Large margin classification using the perceptron algorithm, Mach Learning, 37: : 209–217, (1999) . doi:10.1023/A:1007662407062. |
[15] | Ibrahim Obaid O, , Mohammed M, , Abd Ghani MK, , Mostafa S, , Al-Dhief F, Evaluating the performance of machine learning techniques in the classification of wisconsin breast cancer, Int J Eng Technol, 7: : 160–166, (2018) . doi:10.14419/ijet.v7i4.36.23737. |
[16] | Ferroni P, , Zanzotto FM, , Riondino S, , Scarpato N, , Guadagni F, , Roselli M, Breast cancer prognosis using a machine learning approach, Cancers (Basel), 11: (3): 328, (2019) . doi:10.3390/cancers11030328. PMID: 30866535; PMCID: PMC6468737. |
[17] | Shravya C, , Pravalika K, , Subhani S, Prediction of breast cancer using supervised machine learning techniques, Int J Innovat Technol Expl Eng (IJITEE), 8: (6): 1106–1110, (2019) . |
[18] | Memon M, , Li J, , Haq A, , Memon M, , Zhou W, Breast cancer detection in the IOT health environment using modified recursive feature selection, Int J Wireless Mob Comput, 2019: : (2019) . doi:10.1155/2019/5176705. |
[19] | Jeon H, , Oh S, Hybrid-recursive feature elimination for efficient feature selection, Appl Sci, 10: : 3211, (2020) . doi:10.3390/app10093211. |
[20] | Padmapriya B, , Thambusamy V, Classification algorithm based analysis of breast cancer data, Int J Data Mining Tech Appl, 5: (1): 43–49, (2016) . doi:10.20894/IJDMTA.102.005.001.010. |
[21] | Roure J, , Moore AW, Sequential update of ADtrees, in: Proceedings of the 23rd International Conference on Machine Learning (ICML’06). Association for Computing Machinery (New York, NY, USA), 769–776, 2006. doi:10.1145/1143844.1143941. |
[22] | Vishal R, Feature selection — Correlation and P-value, towardsdatascience.com, September 11, 2018. Available from: https://towardsdatascience.com/feature-selection-correlation-and-p-value-da8921bfb3cf [Accessed: 2021-12-27]. |
[23] | Srinivasan AV, Why exclude highly correlated features when building regression model, towardsdatascience.com, August 23, 2019. Available from: Why exclude highly correlated features when building regression model ?? | by Aishwarya V Srinivasan | Towards Data Science. |
[24] | Fernández A, , Garcia S, , Herrera F, , Chawla N, SMOTE for learning from imbalanced data: Progress and challenges, marking the 15-year anniversary, J Artif Intell Res, 61: : 863–905, (2018) . doi:10.1613/jair.1.11192. |
[25] | Caruana R, , Niculescu-Mizil A, An empirical comparison of supervised learning algorithms, in: Proceedings of the 23rd International Conference on Machine Learning. 161–168, 2006. |
[26] | Rokach L. Pattern Classification Using Ensemble Methods. (2010) . |
[27] | Che D, , Liu Q, , Rasheed K, , Tao X, Decision tree and ensemble learning algorithms with their applications in bioinformatics, Softw Tools Algorithms Biol Syst,191–199, (2011) .. |
[28] | Jiang X, , Xu C, Deep learning and machine learning with grid search to predict later occurrence of breast cancer metastasis using clinical data, J Clin Med, 11: : 5772, (2022) . doi:10.3390/jcm11195772. |
[29] | Baughan N, , Douglas L, , Giger ML, Past, present, and future of machine learning and artificial intelligence for breast cancer screening, J Breast Imag, 4: (5): 451–459, (2022) . |
[30] | Rabiei R, , Ayyoubzadeh SM, , Sohrabei S, , Esmaeili M, , Atashi A, Prediction of breast cancer using machine learning approaches, J Biomed Phys Eng, 12: (3): 297, (2022) . |
[31] | Allugunti VR, Breast cancer detection based on thermographic images using machine learning and deep learning algorithms, Int J Eng Comput Sci, 4: (1): 49–56, (2022) . |
[32] | Thara DK, , Premasudha BG, , Xiong F, Auto-detection of epileptic seizure events using deep neural network with different feature scaling techniques, Pattern Recogn Lett, 128: : 544–550, (2019) . |
[33] | Zizaan A, , Idri A, Machine learning based Breast Cancer screening: Trends, challenges, and opportunities, Comput Meth Biomech Biomed Eng Imag Vis, 11: (3): 976–996, (2023) . |
[34] | Rabiei R, , Ayyoubzadeh SM, , Sohrabei S, , Esmaeili M, , Atashi A, Prediction of breast cancer using machine learning approaches, J Biomed Phys Eng, 12: (3): 297–308, (2022) . doi:10.31661/jbpe.v0i0.2109-1403. PMID: 35698545; PMCID: PMC9175124. |
[35] | Shrivastav LK, , Jha SK, A gradient boosting machine learning approach in modeling the impact of temperature and humidity on the transmission rate of COVID-19 in India, Appl Intell (Dordr), 51: (5): 2727–2739, (2021) . doi:10.1007/s10489-020-01997-6 . Epub 2020 Nov 4. PMID: 34764559; PMCID: PMC7609380. |
[36] | Raiesdana S, Breast cancer detection using optimization-based feature pruning and classification algorithms, Middle East J Cancer, 12: (1): 48–68, (2021) . doi:10.30476/mejc.2020.85601.1294. |
[37] | Humayun M, , Khalil MI, , Almuayqil SN, , Jhanjhi NZ, Framework for detecting breast cancer risk presence using deep learning, Electronics, 12: : 403, (2023) . doi:10.3390/electronics12020403. |
[38] | Shafique R, , Rustam F, , Choi GS, , Díez IdlT, , Mahmood A, , Lipari V , Breast cancer prediction using fine needle aspiration features and upsampling with supervised machine learning, Cancers, 15: : 681, (2023) . doi:10.3390/cancers15030681. |
[39] | Yadav RK, , Singh P, , Kashtriya P, Diagnosis of breast cancer using machine learning techniques—A survey, Proc Comput Sci, 218: : 1434–1443, (2023) . ISSN 1877-0509, doi:10.1016/j.procs.2023.01.122. (https://www.sciencedirect.com/science/article/pii/S1877050923001229). |
[40] | Magrabi F, , Ammenwerth E, , McNair JB, , De Keizer NF, , Hyppönen H, , Nykänen P , Artificial intelligence in clinical decision support: Challenges for evaluating AI and practical implications, Yearbook Med Inform, 28: (1): 128–134, (2019) . |


