
Predictive Value of Computed Tomography Following Neoadjuvant Chemotherapy for Muscle Invasive Bladder Cancer
Abstract
BACKGROUND:
Neoadjuvant chemotherapy (NAC) prior to radical cystectomy (RC) remains standard treatment for select patients with muscle-invasive bladder cancer (MIBC). Although computed tomography (CT) is often obtained prior to RC, its ability to predict pathologic response is poorly characterized.
OBJECTIVE:
The purpose of this study is to evaluate the predictive value of CT in assessing disease burden after NAC.
METHODS:
Patients with MIBC having received NAC prior to RC were identified. Pre- and post-NAC CT scans were reviewed by an abdominal radiologist. The correlation between pathologic complete response (PCR) and radiologic complete response (RCR) was determined as the primary aim. As a secondary aim, the correlation between pathologic partial response (PPR) and radiologic partial response (RPR) was determined. Logistic regression analysis was utilized to determine the predictive value of CT in determining disease burden at RC.
RESULTS:
A total of 141 patients were identified for analysis. PCR and PPR was achieved in 34% and 16% of patients, respectively. The positive predictive value of post-NAC CT was 53.5% for PCR and 28.8% for PPR. The negative predictive value of post-NAC CT was 73.5% for PCR and 46.2% for PPR. There was no significant association between RCR and PCR (OR 1.13, p = 0.67). Similarly, there was no meaningful association between RPR and PPR, lymph node involvement, or presence of extravesical disease.
CONCLUSIONS:
CT findings correlate poorly with final pathology at RC and should not be used to evaluate local disease burden.
INTRODUCTION
The administration of neoadjuvant chemotherapy (NAC) prior to radical cystectomy (RC) for muscle-invasive bladder cancer (MIBC) has been shown to yield a 5% improvement in overall survival over five years [1]. Response to NAC is an important prognostic marker, and patients demonstrating pathological downstaging or complete response have improved survival following RC compared to those with residual invasive disease [2]. Although current evidence supports the use of NAC in selected patients, reliable markers of clinical response prior to RC are lacking.
Computed tomography (CT) is commonly used after completion of NAC as an indicator of disease response, including in bladder preservation trial design, and thus is a potential determinant of surgical candidacy. We assessed the predictive value of contrast-enhanced CT in determining disease burden and treatment response following NAC.
CT is a commonly used imaging modality for the detection of bladder cancer and has been reported to perform well in this setting [3]. CT has been shown to demonstrate high sensitivity and specificity in identifying tumor invasion beyond the bladder serosa and into adjacent structures [4]. Nevertheless, CT carries significant limitations, including the inability to differentiate muscle invasive and non-muscle invasive disease, as the attenuation between the bladder wall and tumor can be difficult to resolve [5]. Clinical estimation of tumor size and response to therapy is commonly based on the World Health Organization and Response Evaluation Criteria in Solid Tumors (RECIST) criteria, both of which may be inaccurate and are subject to inter- and intra-observer variability [6].
Given the morbidity associated with RC and urinary diversion, as well as ongoing clinical trials attempting to identify bladder-sparing protocols following NAC [7, 8], it is imperative to determine reliable means to characterize residual disease burden prior to RC. As up to 40% of patients may be ypT0 at the time of cystectomy, a significant number of patients may be candidates for bladder sparing if complete responders can be identified [9, 10]. Despite the use of CT in the NAC setting, little is known about the correlation between post-chemotherapy CT findings and final pathology at RC. An understanding of the predictive value of CT in the NAC setting is needed to determine the optimal imaging protocol to assess residual disease burden. It is hypothesized that findings on CT correlate poorly with final pathology at RC based on the inherent limitations of this modality.
MATERIALS AND METHODS
Patient Selection
Following Institutional Review Board approval (IRB No. 00145000), we retrospectively identified patients having undergone RC following NAC at The University of Kansas Health System between the years 2008–2020 using the electronic medical record. Patients with a diagnosis of MIBC who received systemic NAC were selected for comparative analysis. Given the retrospective design of the study, informed consent was not required prior to inclusion. Patients who underwent contrast-enhanced CT of the abdomen and pelvis following NAC and prior to RC were included. Patients were not excluded if films were obtained at an outside institution. Patients with missing data regarding initial or final pathology were excluded. A CONSORT diagram is included in Fig. 1.
Fig. 1
CONSORT diagram of patients having undergone neoadjuvant chemotherapy (NAC) followed by radical cystectomy (RC) with available post-NAC imaging (N = 155).
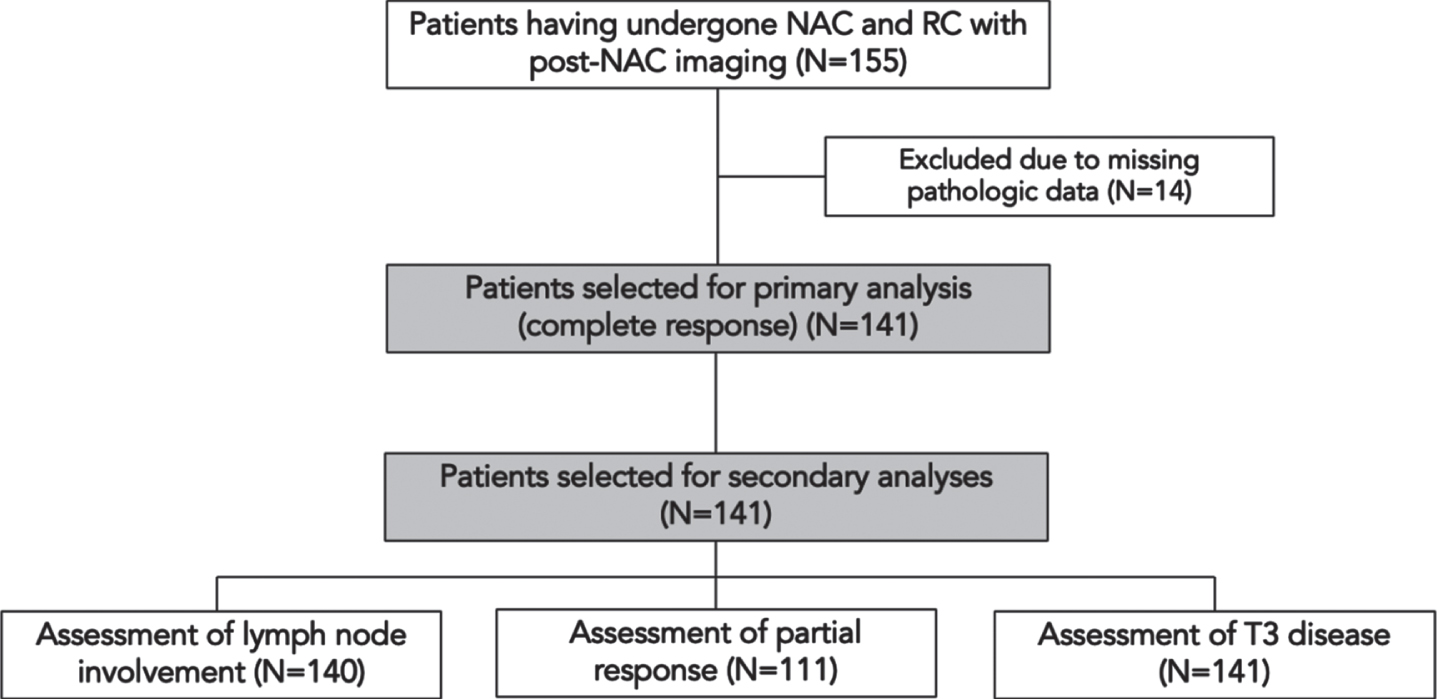
As the timing of pre-operative appointments with imaging may have occurred prior to the completion of NAC, patients were included if only a single cycle of chemotherapy was remaining at the time of CT. A subset of patients with CT scans available at the time of MIBC diagnosis prior to NAC were also identified to determine if interval radiographic changes correlated with final pathology (n = 111). Demographics and clinicopathologic data were abstracted from the electronic medical record and are summarized in Table 1.
Table 1
Patient characteristics including summary of radiographic and pathologic response rates
| Variable | Group | Radiographic Response | Pathologic Response | ||||
| RCR | RPR | RDP | PCR | PPR | |||
| N | N (%) | N (%) | N (%) | N (%) | N (%) | ||
| Sex | Male | 109 | 41 (37.7) | 46 (42.2) | 5 (4.6) | 38 (34.9) | 25 (22.9) |
| Female | 32 | 18 (56.3) | 6 (18.8) | 2 (6.3) | 13 (40.6) | 3 (9.38) | |
| p-value | 0.24 | 0.08 | 0.72 | 0.69 | 0.15 | ||
| NAC | MVAC | 37 | 18 (51.3) | 15 (40.5) | 1 (2.70) | 18 (48.6) | 3 (8.11) |
| Gem/CIS | 79 | 31 (39.2) | 29 (36.7) | 5 (6.33) | 21 (26.6) | 16 (20.3) | |
| p-value | 0.54 | 0.79 | 0.43 | 0.11 | 0.15 | ||
| Smoking History* | >20 pack years | 76 | 40 (52.6) | 18 (23.6) | 6 (7.89) | 21(27.6) | 14 (18.4) |
| <20 pack years | 25 | 10 (40.0) | 5 (20.0) | 1 (4.00) | 9(36.0) | 7 (28.0) | |
| None | 33 | 1 (3.03) | 26 (78.8) | 0 (0.00) | 5(15.2) | 3 (9.09) | |
| p-value | 0.01 | 0.01 | 0.59 | 0.35 | 0.30 | ||
| Prior TURBT* | 1 | 106 | 42 (39.6) | 39 (36.8) | 7 (6.60) | 40 (37.7) | 14 (13.2) |
| >1 | 35 | 12 (34.3) | 10 (28.6) | 0 (0.00) | 9 (25.7) | 8 (22.9) | |
| p-value | 0.70 | 0.53 | 0.43 | 0.72 | 0.25 | ||
Abbreviations: RCR = radiologic complete response, RPR = radiologic partial response, PCR = pathologic complete response, PPR = pathologic partial response, RDP = radiologic disease progression, NAC = neoadjuvant chemotherapy, TURBT = transurethral resection of bladder tumor, UC = Urothelial carcinoma. *Totals not amounting to n = 141 reflect incomplete or unspecified data.
Radiographic and pathologic characterization
All pre- and post-NAC CT scans were reviewed by an abdominal radiologist (S.B.) with significant experience evaluating genitourinary malignancy to determine evidence of bladder cancer and extent of disease. Outcomes were characterized by correlation between radiographic response and pathologic response. Radiologic complete response (RCR) was defined as the absence of any feature of bladder cancer on post-NAC CT. Radiographic partial response (RPR) was determined by comparing pre-and post-NAC scans. RPR was defined as a decrease in tumor size, decrease in tumor number, resolution of lymphadenopathy, or resolution of features suggestive of clinical T3 (cT3) disease. Radiographic cT3 features were defined as hydronephrosis, prominent perivesical fat stranding, serosal nodularity, or extravesical extension.
The primary aim of this study was to determine if post-NAC CT is predictive of complete response (ypT0). Pathologic complete response (PCR) was defined as pT0N0, and pathologic partial response (PPR) was defined as <pT2 and pN0, excluding patients with complete response. Disease progression was defined as an increase in tumor size or number, the presence of a new enhancing bladder mass, interval development of cT3 features, or an increase in or development of lymphadenopathy following NAC.
Statistical analysis
Data analysis was completed for demographic and clinical data using the χ2 test unless 20% or more of the counts had a value of less than five, in which case Fisher’s exact test was employed. Analyses investigating the effect of covariates on the variables of interest were conducted using binary logistic regression. Covariates included age, gender, presence of T3 disease, smoking history, pre-operative intravesical chemotherapy, presence of carcinoma in situ, and multifocal disease. Odds ratios with corresponding p-values and confidence intervals were obtained for all variables in each model. Analyses were conducted using SAS version 9.4.
Additional testing was performed to determine meaningful correlation, including Chi-square analysis and Cohen’s Kappa coefficient (k) determination. By convention, inverse kappa (–) values indicated disagreement. Meaningful agreement was defined as k > 0.25, and meaningful disagreement was defined as k < –0.25. As such, Kappa coefficient values between –0.25–0.25 indicated no meaningful correlation. Data from these ancillary analyses are reported in Supplementary Table 1.
In all cases, p < 0.05 was used to indicate statistical significance. Sensitivity, specificity, positive predictive value, negative predictive value, and accuracy were calculated for all relevant statistical aims.
RESULTS
Patient demographics and clinical associations
A total of 155 patients having undergone NAC followed by RC met inclusion criteria, of which 141 were included in the final analysis based on available pathologic data. Of the total, 111 (78.7%) had CT imaging obtained prior to NAC receipt but after diagnosis of MIBC for comparison. The median time to surgery after post-NAC CT was 31 days, and only 11 (7.8%) patients underwent imaging prior to their completion of NAC. The median age was 65 years. PCR was achieved in 34% of patients and PPR was achieved in 16% following NAC. No significant association was observed between pathologic response (PCR or PPR) and sex, NAC regimen, smoking history, or number of prior transurethral resections (TURBTs). The association between patient demographics and clinical history with radiographic and pathologic disease response is displayed in Table 1.
RCR was achieved in 37.4% of patients, and RPR was achieved in 32.9% of patients. Several factors were associated with the identification of radiographic response. A total of 51.3% of patients receiving MVAC achieved RCR compared to 39.2% of patients receiving gemcitabine/cisplatin (p = 0.04). A smaller proportion of never-smokers (3.03%) achieved RCR as compared to those with a smoking history of <20 pack years (40.0%) or >20 pack years (52.6%, p = 0.01). Male patients more commonly achieved RPR than female patients (42.2% vs. 18.8%, p = 0.04). Radiographic disease progression occurred in 4.96% of patients and was not associated with observed differences in patient demographic or clinical history.
Correlation between imaging and final pathology
There was no significant association between RCR and PCR on logistic regression analysis (OR 1.13, p = 0.67) after adjusting for covariates. Similar findings were noted when including carcinoma in situ (CIS) in the definition of complete response (based on low likelihood of radiologic identification) (OR 1.09, p = 0.70). Similarly, there was no meaningful association between RPR and PPR (OR 0.58, p = 0.25). The association between post-NAC CT findings and final pathology at RC is displayed in Table 2. No significant correlation between RCR and PCR was noted via ancillary statistical analyses including Cohen’s kappa coefficient (k = 0.03, CI –0.13–0.19) and Chi-squared analysis (χ2 = 0.178, p = 0.67). A summary of agreement statistics as defined by Cohen’s Kappa coefficient can be found in Fig. 2. Kappa coefficients and Chi-squared findings are further summarized in Supplemental Table 1.
Fig. 2
Correlation between radiographic and pathologic findings based on Cohen’s Kappa Coefficient. 95% confidence intervals are represented by solid lines. Dashed red lines delineate outer boundary for values corresponding to poor agreement (k = –0.25–0.25).
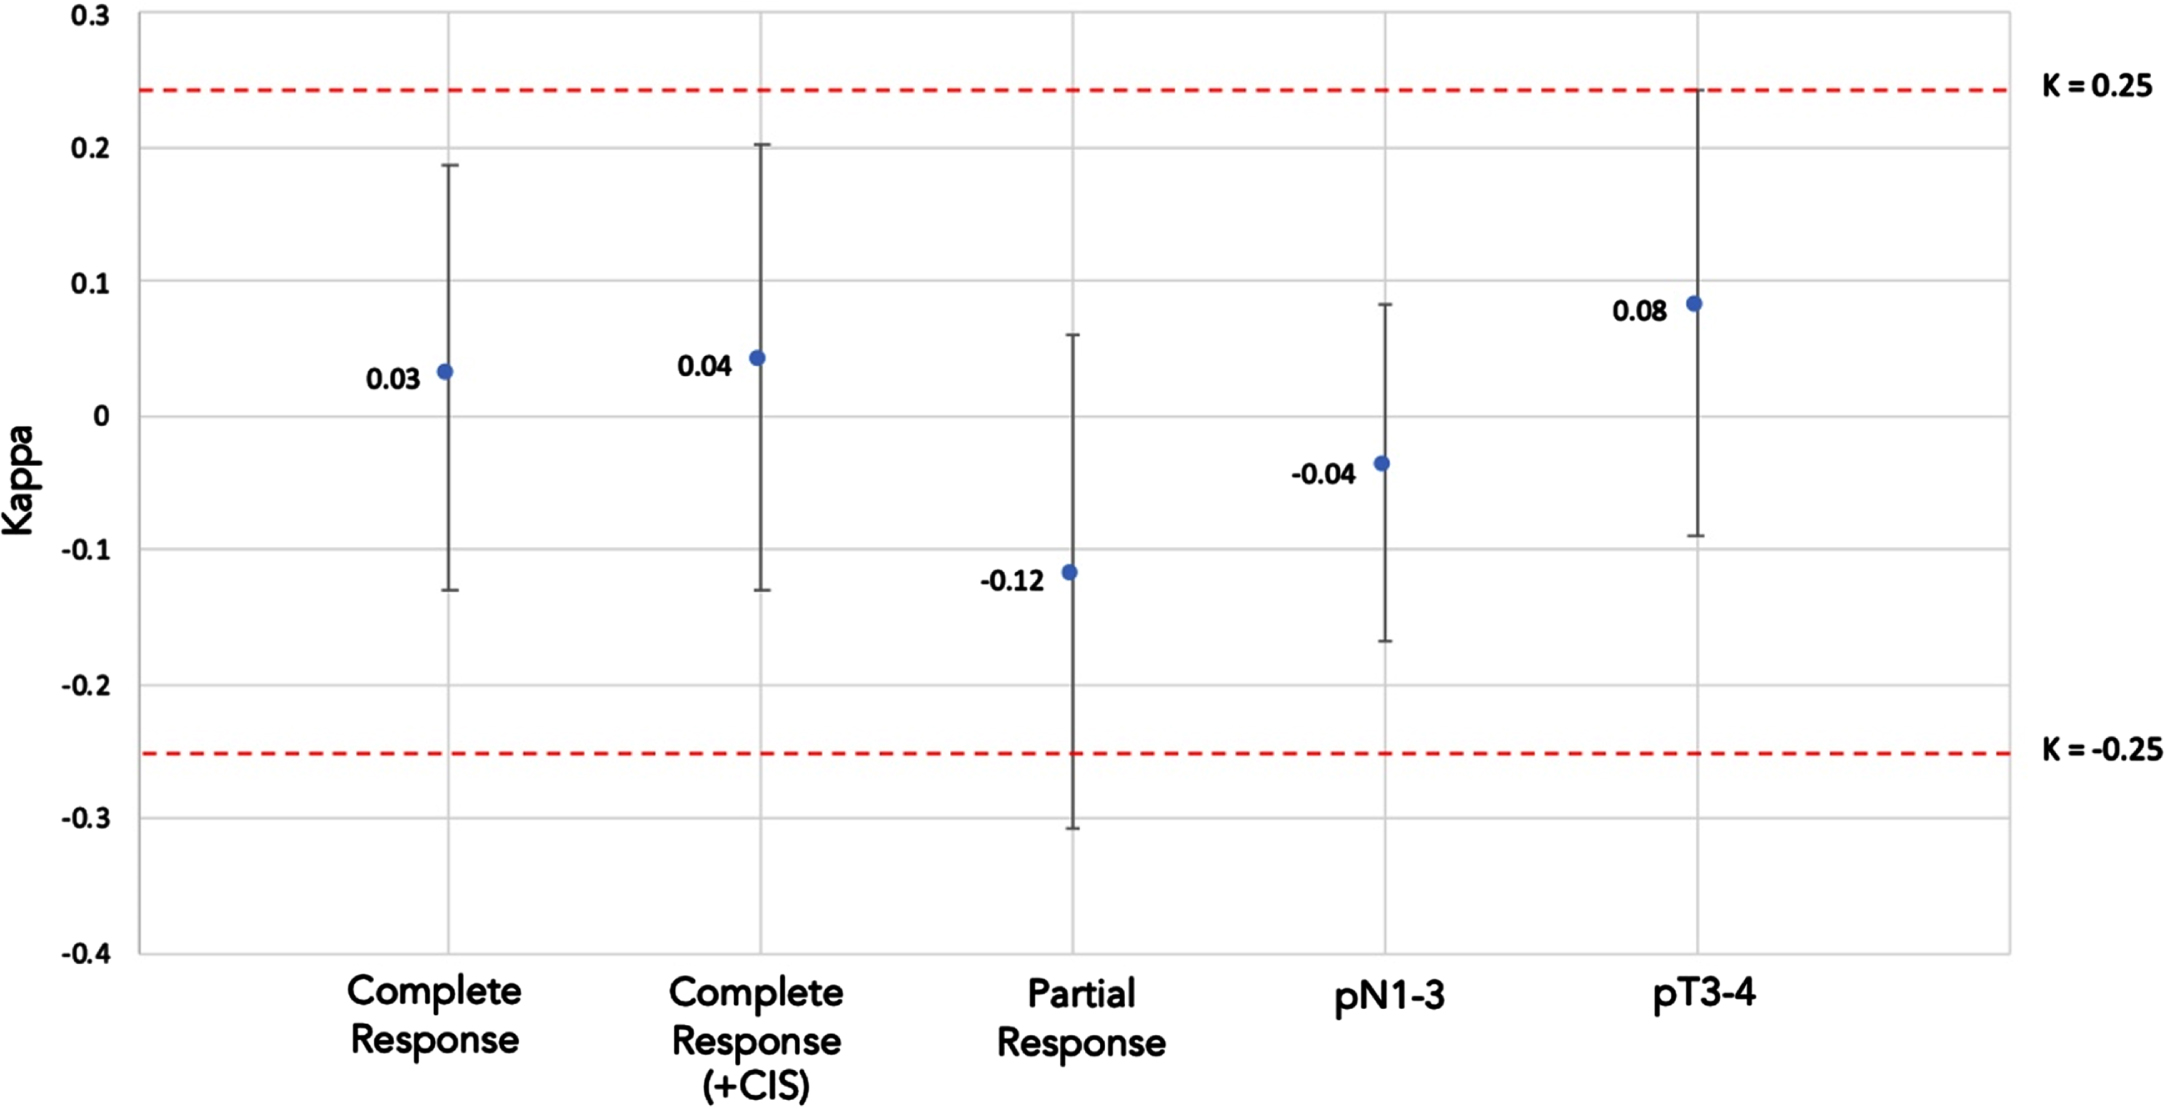
Table 2
Summary findings and correlation between observed radiographic response and pathologic response
| Radiographic Response | Pathologic Response (N%) | Total (N%) | OR (95% CI) | |
| pT0N0 | Residual Disease | 1.13 | ||
| Complete Response | 17 (44) | 41 (41) | 58 (41) | |
| Residual Disease | 22 (56) | 61 (59) | 83 (59) | |
| Total | 39 | 102 | 141 | |
| pT0N0 or CIS | Residual Disease | 1.09 [0.47, 2.56] | ||
| Complete Response | 23 (43) | 35 (40) | 58 (41) | |
| Residual Disease | 30 (57) | 53 (60) | 83 (59) | |
| Total | 53 | 88 | 141 | |
| Partial Response | No response | 0.58 [0.26, 1.13] | ||
| Partial Response | 20 (40) | 32 (52) | 52 (47) | |
| No Response | 30 (60) | 29 (48) | 59 (53) | |
| Total | 50 | 61 | 111* | |
| pN1-3 | N0 | 0.82 [0.15, 4.6] | ||
| Lymph Node Involvement | 2 (6) | 10 (9) | 12 (9) | |
| No Enlarged Lymph Nodes | 31 (94) | 97 (91) | 128 (91) | |
| Total | 33 | 107 | 140* | |
| ≤pT3 | <pT3 disease | 1.63 [0.77, 3.45] | ||
| Evidence of T3 Disease | 19 (41) | 31 (33) | 50 (35) | |
| No Evidence of T3 Disease | 28 (59) | 64 (67) | 92 (65) | |
| Total | 46 | 95 | 141 | |
*Totals not amounting to 141 reflect incomplete or unspecified data.
Diagnostic value of CT
The positive predictive value of post-NAC CT was 29.3% for PCR and 38.4% for PPR. The negative predictive value of post-NAC CT was 73.5% for PCR and 49.1% for PPR.
Post-NAC CT demonstrated low sensitivity for PCR (43.6%), PPR (43.4%), downstaging of disease (40.0%), evidence of T3 disease (40.4%), and identification of lymph node metastasis (6.1%). Post-NAC CT exhibited similarly low specificity for PCR (59.8%), PPR (60.2%), and downstaging (47.5%), although specificity for lymph node metastasis was high (90.4%). The sensitivity, specificity, positive predictive value, negative predictive value, and accuracy of post-NAC CT for each aim are summarized in Table 3.
Table 3
Sensitivity, specificity, positive predictive value, negative predictive value, and accuracy of post-NAC CT based on final pathology at radical cystectomy
| Radiographic Feature | Sensitivity (%) | Specificity (%) | PPV (%) | NPV (%) | Accuracy (%) |
| Complete Radiographic Response | 43.6 | 59.8 | 29.3 | 73.5 | 55.3 |
| Complete Radiographic Response (+CIS) | 43.4 | 60.2 | 39.6 | 63.9 | 44.1 |
| Radiographic Partial Response | 40.0 | 47.5 | 38.4 | 49.2 | 53.9 |
| Radiographic Lymphadenopathy | 6.06 | 90.7 | 16.7 | 75.8 | 70.7 |
| Radiographic cT3 Features | 40.4 | 67.4 | 38.0 | 69.5 | 58.4 |
Abbreviations: PPV = positive predictive value, NPV = negative predictive value.
DISCUSSION
The results of this study do not demonstrate a meaningful correlation between post-NAC CT and final pathology at RC. Notably, there was no significant correlation between the identification of a complete response on CT and the absence of residual disease after RC (OR 1.13, p = 0.67). Similarly, poor correlation was noted for partial disease response, lymph node involvement, and the presence of >T2 disease (Table 2). These findings were supported by both Cohen’s kappa coefficient testing and Chi-squared analysis (Supplementary Table 1). As up to 40% of patients with MIBC are expected to experience a complete response to NAC (34% in this study), additional diagnostic modalities should be explored to better risk stratify patients prior to RC [1, 10].
Few studies have previously explored the predictive value of CT in identifying complete response following NAC, and results have varied. In a study of 59 patients by Fukui et al., CT findings based on the RECIST criteria were unable to reliably identify patients with pT0 status at RC [11]. In contrast, Reese et al. concluded that radiographic restaging would avoid RC in approximately 10% of patients, although correlation between clinical and pathologic diagnosis was not evaluated, which limits the validity of the findings [12].
Choi et al. evaluated the role of urothelial phase CT, which is obtained 60–80 seconds after contrast administration and can improve identification of urothelial malignancy [13]. Using this technique, absence of thin inner-layer enhancement or bladder wall thickening demonstrated favorable sensitivity (74.1–81.5%) and specificity (80.4–84.8%) for complete response after NAC [9]. Ancillary tools such as computerized decision-support systems and deep learning have exhibited improved identification of pT0 disease by CT, with an area under the curve approaching 0.80, although direct comparisons to traditional CT protocols have not been made [14, 15]. Unfortunately, such attempts to augment the utility of CT in the detection of bladder cancer are rarely employed in clinical practice.
Characterization of partial response by CT was poor in this study, with a 95% confidence interval from Cohen’s kappa analyses including values representing meaningful disagreement (k = 0.12, CI –0.31–0.06). The poor correlation and suboptimal PPV (38.4%) and NPV (49.2%) for partial response suggest that CT cannot reliably predict the extent of residual disease after NAC. In a study by Paik et al., CT was able to discriminate the depth of invasion in only 1.2% of patients and correctly identified extravesical tumor spread in only 4.9% of patients. Paik et al. demonstrated an accuracy of 54.9% for determination of stage, which mirrors the accuracy seen for RCR (55.3%) and RPR (53.9%) observed here [16]. Similar to our study, poor correlations between lymph node involvement and T3 disease have been demonstrated in prior series [17, 18].
The results of this study are likely due to inherent limitations of CT in evaluating bladder cancer. Findings present after TURBT and NAC, including desmoplastic reaction, infection, scar tissue, and necrosis, are difficult to distinguish from malignancy and may preclude definitive characterization of response [5]. Tumors of the bladder neck and prostate may go undetected, and the finding of diffuse bladder wall thickening can be due to benign causes, most notably poor bladder distension [3, 19]. Partial response can be challenging to assess due to loss of fat planes between the bladder and adjacent organs, making T3-4 disease difficult to distinguish from less-invasive disease. Furthermore, although a single radiologist was used in our study, interobserver variability is expected to play a role [6]. Variations in radiology protocols affect the ability for CT to identify bladder cancer, and disease progression may occur between the identification of RPR and RC, thereby limiting accurate assessment of response [9].
Retrospective analysis demonstrates that active surveillance following complete clinical response to NAC is associated with a five-year disease specific survival rate of 90% and a recurrence free survival rate of 64% [2]. Given the aggressive nature of MIBC, the level of accuracy to identify complete response should approach 100% if bladder-sparing therapies are to be considered. The use of magnetic resonance imaging (MRI) and the validated VI-RADS system may potentially be useful in this setting. VI-RADS can discriminate MIBC from NMIBC with a PPV and NPV of 77.5% and 97.1%, respectively [19]. Multi-parametric MRI carries a sensitivity of 75% and specificity of nearly 100% in differentiating residual bladder tumor from treatment-related artifacts, which are difficult to delineate on CT [21]. In a prospective study of 90 patients with MIBC having undergone NAC, dynamic contrast-enhanced and diffusion-weighted MRI demonstrated diagnostic accuracy, sensitivity, and specificity of >90% with an AUC of 0.97–0.98 for characterizing response [22]. The use of MRI therefore carries potential to assess disease burden after NAC and has already been shown to have favorable interobserver variability in predicting complete response following neoadjuvant immunotherapy [23].
Non-radiographic modalities are also being evaluated to determine treatment response after NAC. In a study of 101 patients with MIBC, cystoscopy findings after NAC were an independent predictor of extravesical disease, downstaging, and survival [24]. In contrast, a more recent trial evaluating systematic endoscopic evaluation and tissue sampling revealed that nearly half of patients with a negative evaluation harbored residual disease with 25.8% having MIBC at the time of cystectomy [25]. In a retrospective study by Regmi et al., cystoscopy appeared to augment the predictive value of cross-sectional imaging to determine interim NAC response, although the study cohort included patients having undergone PET-CT or MRI, modalities that are likely to have greater predictive value than CT [26]. TURBT alone has not been shown to correlate well with pT0 status after NAC [27].
Limitations include retrospective design and reduced power to assess partial response, as some patients did not have pre-NAC imaging available. Although the utilization of a single radiologist limits interobserver variability within the study, it compromises the generalizability of the findings. Clinical parameters such as prior resection number, tumor location, and size of prior resection were not controlled for and may serve as confounders based on the appearance of scar tissue or necrosis on imaging. Additionally, we did not differentiate patients with >T2 disease on TURBT, which limited our ability to capture patients with pathologic partial response who may have responded to NAC but still had muscle-invasive disease at RC.
Although all images were reviewed internally, not all scans were performed at the same institution, introducing variability in image quality, slice thickness, and radiographic protocols, which have been shown to affect diagnostic performance [13]. Furthermore, a small subset of patients (n = 11) had not completed their final cycle of NAC prior to imaging, which could have led to an inaccurate estimation of disease burden prior to RC. The evaluation of routine imaging in this population, however, may be more applicable to the general MIBC population. Smoking status was not controlled for directly and has shown to be associated with response to NAC [28]. Correlation between CT findings and outcomes could not be assessed in this study as the inclusion of only patients undergoing cystectomy would introduce unacceptable selection bias for this aim.
CONCLUSIONS
CT does not accurately characterize response to NAC. As such, clinical decision making after NAC should not be based on CT alone, and inclusion of CT in clinical trial surveillance algorithms should be suspect. The identification of progression to metastatic disease prior to RC, however, remains a relevant indication to obtain CT following NAC. While it remains unclear if RC may be safely deferred in patients who respond to NAC, identifying reliable methods to characterize treatment response is critical. Our data indicate post-NAC CT scans should not be used to determine candidacy for surgical intervention based on local response. Further studies are needed to evaluate novel imaging modalities and biomarkers to determine response to NAC.
ACKNOWLEDGMENTS
The authors have no acknowledgements.
FUNDING
The authors report no funding.
AUTHOR CONTRIBUTIONS
Syed Alam: conception, performance of work, interpretation of data, manuscript writing.
Austin Martin: performance of work, interpretation of data, manuscript writing.
Matthew McLeay: performance of work, interpretation of data, manuscript writing.
Holly Smith: performance of work, interpretation of data, manuscript writing.
Maghol Golshani: interpretation of data, manuscript writing.
Jeffrey Thompson: performance of work, interpretation of data, manuscript writing.
Mihaela Sardiu: performance of work, interpretation of data, manuscript writing.
Shaun Best: conception, performance of work, interpretation of data, manuscript writing.
John A. Taylor III: conception, performance of work, interpretation of data, manuscript writing.
CONFLICT OF INTEREST
John A. Taylor III is an Editorial Board member of this journal but was not involved in the peer-review process nor had access to any information regarding its peer-review. The remainder of the authors (S.A., A.M., M.M., H.S., M.G., J.T., M.S., S.B.) report no conflicts of interest.
SUPPLEMENTARY MATERIAL
[1] The supplementary material is available in the electronic version of this article: https://dx.doi.org/10.3233/BLC-230015.
REFERENCES
[1] | Vale C Neoadjuvant chemotherapy in invasive bladder cancer: Update of a systematic review and meta-analysis of individual patient data advanced bladder cancer (ABC) meta-analysis collaboration. Eur Urol. (2005) ;48: (2):202–6. |
[2] | Robins D , Matulay J , Lipsky M , et al. Outcomes following clinical complete response to neoadjuvant chemotherapy for muscle-invasive urothelial carcinoma of the bladder in patients refusing radical cystectomy. Urology. (2018) ;111: :116–21. |
[3] | Lee CH , Tan CH , Faria S de C , Kundra V Role of imaging in the local staging of urothelial carcinoma of the bladder. American Journal of Roentgenology. (2017) ;208: (6):1193–205. |
[4] | Vikram R , Sandler CM , Ng CS Imaging and staging of transitional cell carcinoma: Part 1, lower urinary tract. American Journal of Roentgenology. (2012) ;192: (6):1481–7. |
[5] | Kim B , Semelka RC , Ascher SM , Chalpin DB , Carroll PR , Hricak H Bladder tumor staging: Comparison of contrast-enhanced CT, T1- and T2-weighted MR imaging, dynamic gadolinium-enhanced imaging, and late gadolinium-enhanced imaging. Radiology. (1994) ;193: (1):239–45. |
[6] | Suzuki C , Torakzad M , Jacobsson , et al. Interobserver and intraobserver variability in the response evaluation of cancer therapy according to RECIST and WHO-criteria. Acta Oncol. (2010) ;49: (4):509–14. |
[7] | Iyer G , Ballman K , Atheron P , Murray K , Kowk Y , Steen P , et al. A phase II study of gemcitabine plus cisplatin chemotherapy in patients with muscle-invasive bladder cancer with bladder preservation for those patients who tumors harbor deleterious DNA damag response (DDR) gene alterations (Alliance A01). Journal of Clinical Oncology. (2020) ;40: 16_suppl, TPS4615–TPS4615. |
[8] | Geynisman D , Abbosh P , Ross E , Zibelman M , Ghatalia P , Anari F , et al. A phase II trial of risk enabled therapy after initiating neoadjuvant chemotherapy for bladder cancer (RETAIN BLADDER): Interim analysis. Journal of Clinical Oncology.6_suppl. (2021) ;39: :397–397. |
[9] | Choi S , Park K , Lee G , et al. Urothelial phase CT for assessment of pathologic complete response after neoadjuvant chemotherapy in muscle-invasive bladder cancer. Eur J Radiol. (2020) ;126. |
[10] | Grossman HB , Natale RB , Tangen CM , Speights VO , Vogelzang NJ , Trump DL , et al. Neoadjuvant chemotherapy plus cystectomy compared with cystectomy alone for locally advanced bladder cancer. New England Journal of Medicine. (2009) ;349: (9):859–66. |
[11] | Fukui T , Matsui Y , Umeoka S , et al. Predictive value of radiological response rate for pathological response to neoadjuvant chemotherapy and post-cystectomy survival of bladder urothelial cancer. Jpn J Clin Oncol. (2016) ;46: (6):560–7. |
[12] | Reese AC , Ball MW , Gandhi N , et al. The utility of an extensive postchemotherapy staging evaluation in patients receiving neoadjuvant chemotherapy for bladder cancer. Urology. (2014) ;84: (2):358–63. |
[13] | Metser U , Goldstein M , Chawla T , et al. Detection of urothelial tumors: Comparison of urothelial phase with excretory phase CT urography–a prospective study. Radiology. (2012) ;264: (1):110–8. |
[14] | Cha KH , Hadjiiski L , Chan H-P , Weizer AZ , Alva A , Cohan RH , et al. Bladder cancer treatment response assessment in CT using radiomics with deep-learning. Sci Reports. (2017) ;7: (1):1–12. |
[15] | Cha J , Hadjiiski L , Cohan R , et al. Diagnostic accuracy of CT for prediction of bladder cancer treatment response with and without computerized decision support. Acad Radiol. (2019) ;26: (9):1137–45. |
[16] | Paik ML , Scolieri MJ , Brown SL , Spirnak JP , Resnick MI Limitations of computerized tomography in staging invasive bladder cancer before radical cystectomy. J Urol. (2000) ;163: (6):1693–6. |
[17] | Jalón Monzón A , Fernández Gómez JM , Escaf Bramada S , Álvarez Múgica M , García Rodríguez J , Regadera Sejas FJ Efecto terapéutico de mitomicina C en el postoperatorio inmediato de pacientes con tumores vesicales no músculo invasores de bajo riesgo. Actas Urol Es. (2008) ;32: (8):811–20. |
[18] | Baltaci S , Rseorlu B , Yagci C , et al. Computerized tomography for detecting perivesical infiltration and lymph node metastasis in invasive bladder carcinoma. Urol Int. (2008) ;81: (4):399–402. |
[19] | Maurer T , Horn T , Heck M , Gschwend JE , Eiber M , Beer AJ Current staging procedures in urinary bladder cancer. Diagnostics. (2013) ;3: (3):315–24. |
[20] | Giudice F Del , Barchetti G , Berardinis E De , Pecoraro M , Salvo V , Simone G , et al. Prospective assessment of Vesical Imaging Reporting and Data System (VI-RADS) and its clinical impact on the management of high-risk non– muscle-invasive bladder cancer patients candidate for repeated transurethral resection. Eur Urol. (2020) ;77: (1):101–9. |
[21] | Donaldson S , Bonington S , Kershaw L , et al. Dynamic contrast-enhanced MRI in patients with muscle-invasive transitional cell carcinoma of the bladder can distinguish between residual tumour and post-chemotherapy effect. Eur J Radiol. (2013) ;82: (12):2161–8. |
[22] | Abdalla S , Taher M , Ali E , et al. Diagnostic performance of contrast-enhanced dynamic and diffusion-weighted MR imaging in the assessment of tumor response to neoadjuvant therapy in muscle-invasive bladder cancer. Abdom Radiol. (2021) ;46: (6):2712–21. |
[23] | Necchi A , Bandini M , Calareso G et al. Multiparametric magnetic resonance imaging as a noninvasive assessment of tumor response to neoadjuvant pembrolizumab in muscle-invasive bladder cancer: Preliminary findings from the PURE-01 study. European Urology. (2020) ;7: (5):636–43. |
[24] | Kukreja J , Porten S , Golla V , et al. Absence of tumor on repeat transurethral resection of bladder tumor does not predict final pathologic T0 stage in bladder cancer treated with radical cystectomy. Eur Urol Focus. (2018) ;4: (5):720–4. |
[25] | Zibelman M , Ashgar A , Parker D , et al. Cystoscopy and systematic bladder tissue sampling in predicting pT0 bladder cancer: A prospective trial. J Urol. (2021) ;205: (6):1605–11. |
[26] | Regmi SK , Kalapara A , Konety BR The need for interim assessment of neoadjuvant chemotherapy response for muscle invasive bladder cancer—can we help prevent definitive treatment delay in nonresponders? J Urol. (2021) ;205: (2):327–9. |
[27] | Ghandour R , Kusin S , Wong D , et al. Does grossly complete transurethral resectionimprove response to neoadjuvant chemotherapy? Urol Oncol. (2020) ;38: (9):736.e11–736.e18. |
[28] | Cacciamani GE , Ghodoussipour S , Mari A , Gill KS , Desai M , Artibani W , et al. Association between smoking exposure, neoadjuvant chemotherapy response and survival outcomes following radical cystectomy: Systematic review and meta-analysis. J Urol. (2020) ;204: (4):649–60. |


