
A New Functional Gene, Zinc Finger Protein 485 (ZNF485), is Involved in Bladder Cancer Proliferation
Abstract
BACKGROUND:
Bladder cancer is the second most common urological cancer worldwide, with low early diagnosis and high mortality. The limited progress in diagnostics and treatment greatly impedes the survival of bladder cancer patients.
OBJECTIVE:
Potential therapeutic biomarkers are urgently needed for future clinical treatment.
METHODS:
We analyzed the sequencing data and corresponding clinicopathological features and survival information of bladder cancer patients in the TCGA database and identified a new zinc finger protein 485 gene, termed ZNF485, which is highly expressed in the tissues of bladder cancer patients and was verified in cells, animal models and tissue microarrays.
RESULTS:
We found that inhibition of ZNF485 in the bladder cancer cell lines T24 and 5637 obviously inhibited proliferation and promoted the apoptosis of cancer cells. Furthermore, wound healing and invasion assays showed that downregulation of ZNF485 significantly decreased the mobility and invasion of T24 and 5637 cells. In addition, ZNF485-shRNA transfection obviously inhibited tumor growth in nude mice. Immunohistochemical results of clinical samples showed that the expression level of ZNF485 protein in cancer tissues was higher than that in adjacent tissues. Mechanistic analysis identified possible downstream target genes.
CONCLUSIONS:
Taken together, the results provide evidence that ZNF485 is involved in bladder cancer proliferation and might be a potential therapeutic biomarker for the treatment of this disease
INTRODUCTION
Bladder cancer is one of the most prevalent genitourinary malignancies globally [1, 2] and occurs nearly four times more often in men than in women [3]. Generally, smoking and exposure to chemicals are the main risk factors for bladder cancer [4, 5]. It develops into aggressive and invasive tumors with long-term invasive surveillance. The high recurrence rate and high morbidity and mortality are the main causes of death in bladder cancer patients [6]. Currently, the most common treatment for bladder cancer is radical surgery-based comprehensive therapy, but this method does not significantly improve the survival of patients [6, 7]. The diagnostics, treatment and five-year survival rates for bladder cancer have remained unchanged since the 1990s [8, 9]. To combat this disease, screening new markers and therapeutic targets is urgently needed [1, 2, 10].
Recent studies have found several genes and multilevel cell signal network disorders that are closely correlated with bladder cancer. For example, the human enhancer of the filamentation 1 gene has a profound effect on the proliferation, invasion and metastasis of bladder cancer cells [11]. Adenylatekinase 4 was found to promote bladder cancer cell proliferation and invasion [12]. In this study, we identified a new gene, zinc finger protein 485 (termed ZNF485), which is highly expressed in the tissues of bladder cancer patients. ZNF485 silencing inhibited the proliferation and invasion of T24 and 5637 bladder cancer cells and suppressed tumor formation in nude mice. Thus, ZNF485 may be a new biomarker candidate and therapeutic target for the prognosis of bladder cancer.
MATERIALS AND METHODS
The original data download and analysis
From TCGA website (https://portal.gdc.cancer.gov/), we downloaded the mRNA sequencing data (data type: fpkm) of 433 cases of bladder cancer (BLCA), including 414 cases of BLCA and 19 cases of normal control group. The clinicopathological features included age, sex, grade, stage and T_stage (Primary tumor_stage), N_stage (Local lymph node_stage), and M_stage (Distant metastasis_stage). Rx643.6.1 software was used to analyze data, including expression differences, survival analysis, correlation analysis with clinicopathological parameters, univariate Cox analysis and multivariate Cox analysis. The main packages used were as follows: edge, limma, survival, surviviner, etc.
Obtaining samples
Human bladder cancer samples were obtained from abdominal surgery at Anhui Provincial Cancer Hospital, West Branch of the First Affiliated Hospital of University of Science and Technology of China. The pathological condition was determined by an experienced surgical specialist. Before sampling, the purpose of sampling was communicated with patients, and consent was signed by the patients. The collection was demonstrated and agreed upon by the medical ethics committee of the First Affiliated Hospital of University of Science and Technology of China (No. 2021-BE(H)-126).
Cell lines and culture
Two bladder cancer cell lines used in this study, 5637 (ATCC NO. HTB-9) and T24 (ATCC NO. HTB-4) were purchased from the Chinese Academy of Sciences Committee on Culture Collection Cell Bank, Shanghai Institutes for Biological Sciences, Shanghai, China. Cells were cultured in RPMI 1640 (Invitrogen) +10% fetal bovine serum (Invitrogen) and 1% glutamine at 37°C in 5% CO2.
Western blotting
Cells were lysed with lysis buffer (60 mM Tris–HCl, pH 6.8, 2% SDS, 20% glycerol, 0.25% bromophenol blue, 1.25% 2-mercaptoethanol) and heated at 95 °C for 10 min before electrophoresis. The protein was separated by 12% SDS–PAGE and then transferred to polyvinyl difluoride membranes (Millipore, Bedford, MA) by electroblotting. After blocking with 5% nonfat dry milk, the blots were incubated with primary antibodies (against ZNF485 and GAPDH). The target bands were revealed by an enhanced chemiluminescence reaction (Pierce), and the relative density (level) of proteins over the GAPDH band was quantified with the Gel-Pro Analyzer (Media Cybernetics). Anti-ZNF485 (Ag15297) was purchased from ImmunoWay (http://www.immunoway.com/index.asp), and anti-rabbit IgG (SA00001-2) was purchased from San Ying Biotechnology, China (https://www.ptglab.com/).
The siRNA transfection
The siRNA and the scramble sequence control (NC) as well as riboFECT CP transfection kits were supplied by Guangzhou RiboBio (Guangzhou, China). Transfection of ribonucleic acid reagents mentioned above was performed according to the manufacturer’s instructions. The sequences used in this study are as follows:
Table 1
Demographic data and CSF biomarker concentrations across the diagnostic groups
| si-ZNF485-1 sense | GCAGGCAAACAGCCUUAUAGATT |
| si-ZNF485-1 antisense | UCUAUAAGGCUGUUUGCCUGCTT |
| si-ZNF485-2 sense | GGGAUAAUUCAACUGUGUUGGTT |
| si-ZNF485-2 antisense | CCAACACAGUUGAAUUAUCCCTT |
| si-ZNF485-3 sense | GCCCUAAAGCAAAGCACUUCUTT |
| si-ZNF485-3 antisense | AGAAGUGCUUUGCUUUAGGGCTT |
RNA analysis
Total RNA was isolated from the cells during the logarithmic phase using TRIzol (Tiangen Biotech Co., Ltd., Beijing, China). For the mRNA analysis, cDNA primed by oligo-dT was made with a prime Script RT reagent kit (Tiangen Biotech Co., Ltd., Beijing, China), and the mRNA level of ZNF485 was quantified by a duplex-qRT–PCR analysis where TaqMan probes with different fluorescence for GAPDH (provided by Shing Gene, Shanghai, China) were used in the FTC-3000P PCR instrument (Funglyn Biotech Inc., Canada). Using the 2–ΔΔCt method, normalization to the GAPDH level was performed before the relative levels of the target genes were compared. The sequences of primers used for the qRT–PCR analysis are as follows:
Table 2
Demographic data and CSF biomarker concentrations across the diagnostic groups
| H-GAPDH-S | TGACTTCAACAGCGACACCCA |
| H-GAPDH-A | CACCCTGTTGCTGTAGCCAAA |
| H-CDK4-F | CTGGTGTTTGAGCATGTAGACC |
| H-CDK4-R | GATCCTTGATCGTTTCGGCTG |
| H-CDKN1B-F | ATCACAAACCCCTAGAGGGCA |
| H-CDKN1B-R | GGGTCTGTAGTAGAACTCGGG |
| H-CCND1-F | TGGAGCCCGTGAAAAAGAGC |
| H-CCND1-R | TCTCCTTCATCTTAGAGGCCAC |
| H-AKT1-F | TCCTCCTCAAGAATGATGGCA |
| H-AKT1-R | GTGCGTTCGATGACAGTGGT |
| H-FAS-F | AGATTGTGTGATGAAGGACATGG |
| H-FAS-R | TGTTGCTGGTGAGTGTGCATT |
| H-JUN-F | GCGTTAGCATGAGTTGGCAC |
| H-JUN-R | CGCATGAGGAACCGCATCGC |
| H-MAPK14-F | TCAGTCCATCATTCATGCGAAA |
| H-MAPK14-R | AACGTCCAACAGACCAATCAC |
| H-MAPK8-F | TGTGTGGAATCAAGCACCTTC |
| H-MAPK8-R | AGGCGTCATCATAAAACTCGTTC |
| H-MTOR-F | TCCGAGAGATGAGTCAAGAGG |
| H-MTOR-R | CACCTTCCACTCCTATGAGGC |
| H-MYC-F | GGCTCCTGGCAAAAGGTCA |
| H-MYC-R | CTGCGTAGTTGTGCTGATGT |
| H-NFKB1-F | AACAGAGAGGATTTCGTTTCCG |
| H-NFKB1-R | TTTGACCTGAGGGTAAGACTTCT |
| H-CDKN1A-S | GTACCACCCAGCGGACAAGT |
| H-CDKN1A-AS | CCTCATCCCGTGTTCTCCTTT |
| H-P53-F | TCAACAAGATGTTTTGCCAACTG |
| H-P53-R | ATGTGCTGTGACTGCTTGTAGATG |
| H-PTEN-F | TTTGAAGACCATAACCCACCAC |
| H-PTEN-R | ATTACACCAGTTCGTCCCTTTC |
| H-TNF-F | CCTCTCTCTAATCAGCCCTCTG |
| H-TNF-R | GAGGACCTGGGAGTAGATGAG |
| H-TRAF2-F | CCTTCCCAGATAATGCTGCCC |
| H-TRAF2-R | GCTCTCGTATTCTTTCAGGGTC |
| H-APC2-F | TCCTCCGCAATGTGTCCAG |
| H-APC2-R | AGGCTGTGCGAAGTCAGATG |
| H-CCNB1-F | TTGGGGACATTGGTAACAAAGTC |
| H-CCNB1-R | ATAGGCTCAGGCGAAAGTTTTT |
| H-NOTCH1-F | GTGACTGCTCCCTCAACTTCAAT |
| H-NOTCH1-R | CTGTCACAGTGGCCGTCACT |
| H-STAT1-F | ATCAGGCTCAGTCGGGGAATA |
| H-STAT1-R | TGGTCTCGTGTTCTCTGTTCT |
| ZNF485-F | GGAGAGCGAACGAAAAGTGTC |
| ZNF485-R | AACTGTTCATAAAGGCGATCCC |
Cell proliferation assay
The capacity for cellular proliferation was measured by CCK-8-based cell proliferation assay. Cells infected with lentivirus or control or transfected with ZNF485 siRNA or control siRNA were seeded in 96-well plates at a density of 5×10³ cells per well, and cell proliferation assays were performed every 24 hours using CCK8. The number of viable cells was measured by their absorbance at 450 nm at the indicated time points.
Flow cytometry apoptosis analysis
Cells transfected with ZNF485siRNA or control siRNA were seeded into 6-well plates, harvested after 48 hr and rinsed with PBS twice. Cells were treated with 200μl binding buffer, 5μl Annexin V-FITC and 5μl propidium iodide (PI). After incubation in the dark for 30 min at room temperature, the cell apoptotic rate was measured by flow cytometry (Beckman) and analyzed by FlowJo Software. The experiments were performed independently three times, and a representative is shown.
Cell cycle analysis
Cells were collected and fixed in 70% cold ethanol for 24 hours at 4 °C. Then, the cells were stained with 50μg/ml PI at room temperature for 30 minutes in the dark. The cell cycle was evaluated using a FACSCalibur instrument (FACSVerse), and the results were analyzed according to the manufacturer’s instructions.
Wound-healing assays
For cell motility assays, cells stably expressing mimics, antagomiRs or NC were seeded in 24-well plates and cultured to near confluence. After 6 hours of culture in 1640 without FBS, a linear wound was carefully made using a sterile 10μl pipette tip across the confluent cell monolayer, and the cell debris was removed by washing with phosphate-buffered saline. The cells were incubated in 1640 plus 10% FBS, and the wounded monolayers were then photographed at 0, 8, 24 and 48 hours after wounding.
Invasion assays
Cell invasion assays were performed in a 24-well plate with 8 mm pore size chamber inserts (Corning, New York, NY, USA). For invasion assays, 1x10⁴ cells stably expressing mimics, antagomiRs or NC were placed into the upper chamber in each well with the Matrigel-coated membrane, which was diluted in serum-free culture medium. In the assay, cells were suspended in 100μl of 1640 without FBS when they were seeded into the upper chamber. In the lower chamber, 500μl of 1640 supplemented with 10% FBS was added. After incubation for 30 hr at 37°C and 5% CO2, the membrane inserts were removed from the plate, and noninvading cells were removed from the upper surface of the membrane. Cells that moved to the bottom surface of the chamber were stained with 0.1% crystal violet for 30 min. The cells were then imaged and counted in at least 5 random fields using a CKX41 inverted microscope (Olympus, Tokyo, Japan). The assays were conducted three independent times.
In vivo studies
Animal experiments were performed as previously described [13–15]. The experiments were undertaken in accordance with the National Institutes of Health Guide for the Care and Use of Laboratory Animals. Four-week-old male BALB/c nude mice were purchased from Zhejiang Weitong Lihua Laboratory Animal Technology Co., Ltd. The nude mice were kept in the SPF Animal Laboratory of China University of Science and Technology and were approved by the Institutional Animal Care and Use Committee (IACUC) of the University of Science and Technology of China (2021-N(A)-139).
Animal experiments were conducted in accordance with the National Guidelines for the Health Use of Laboratory Animals. Animal research was approved by the Biomedical Ethics Committee of China University of Science and Technology. The procedures for mouse experiments were implemented in accordance with the Regulations on the Administration of Laboratory Animals approved by the State Council.
shZNF485-transfected 5637 cells or the control were embedded in BD Matrigel Matrix and subcutaneously injected into the dorsal flanks of each mouse. After tumors formed, the tumor size was measured every 2 days with calipers and humanely sacrificed approximately 25 days later, and the subcutaneous tumors were isolated, weighed and imaged. The tumor weight was described as the mean±S.D., and the tumor volume was calculated by the equation V = 0.5×D×d2 (V: volume, D: longitudinal diameter, d: latitudinal diameter).
Immunohistochemistry assays
Tissue arrays were constructed using 64 pairs of bladder cancer and 48 pairs of paracancerous tissues. Paraffin embedding, sectioning, and immunohistochemistry (IHC) were programmed to detect ZNF485 expression.
Statistical analyses
The data are presented as the mean, and the error bars indicate the S.D. All statistical analyses were performed with GraphPad Prism 5. Two-tailed Student’s test, one-way analysis of variance or the Mann–Whitney U test were used to calculate statistical significance. p value of < 0.05 was considered significant.
RESULTS
Expression of ZNF485 is upregulated in bladder cancer patients
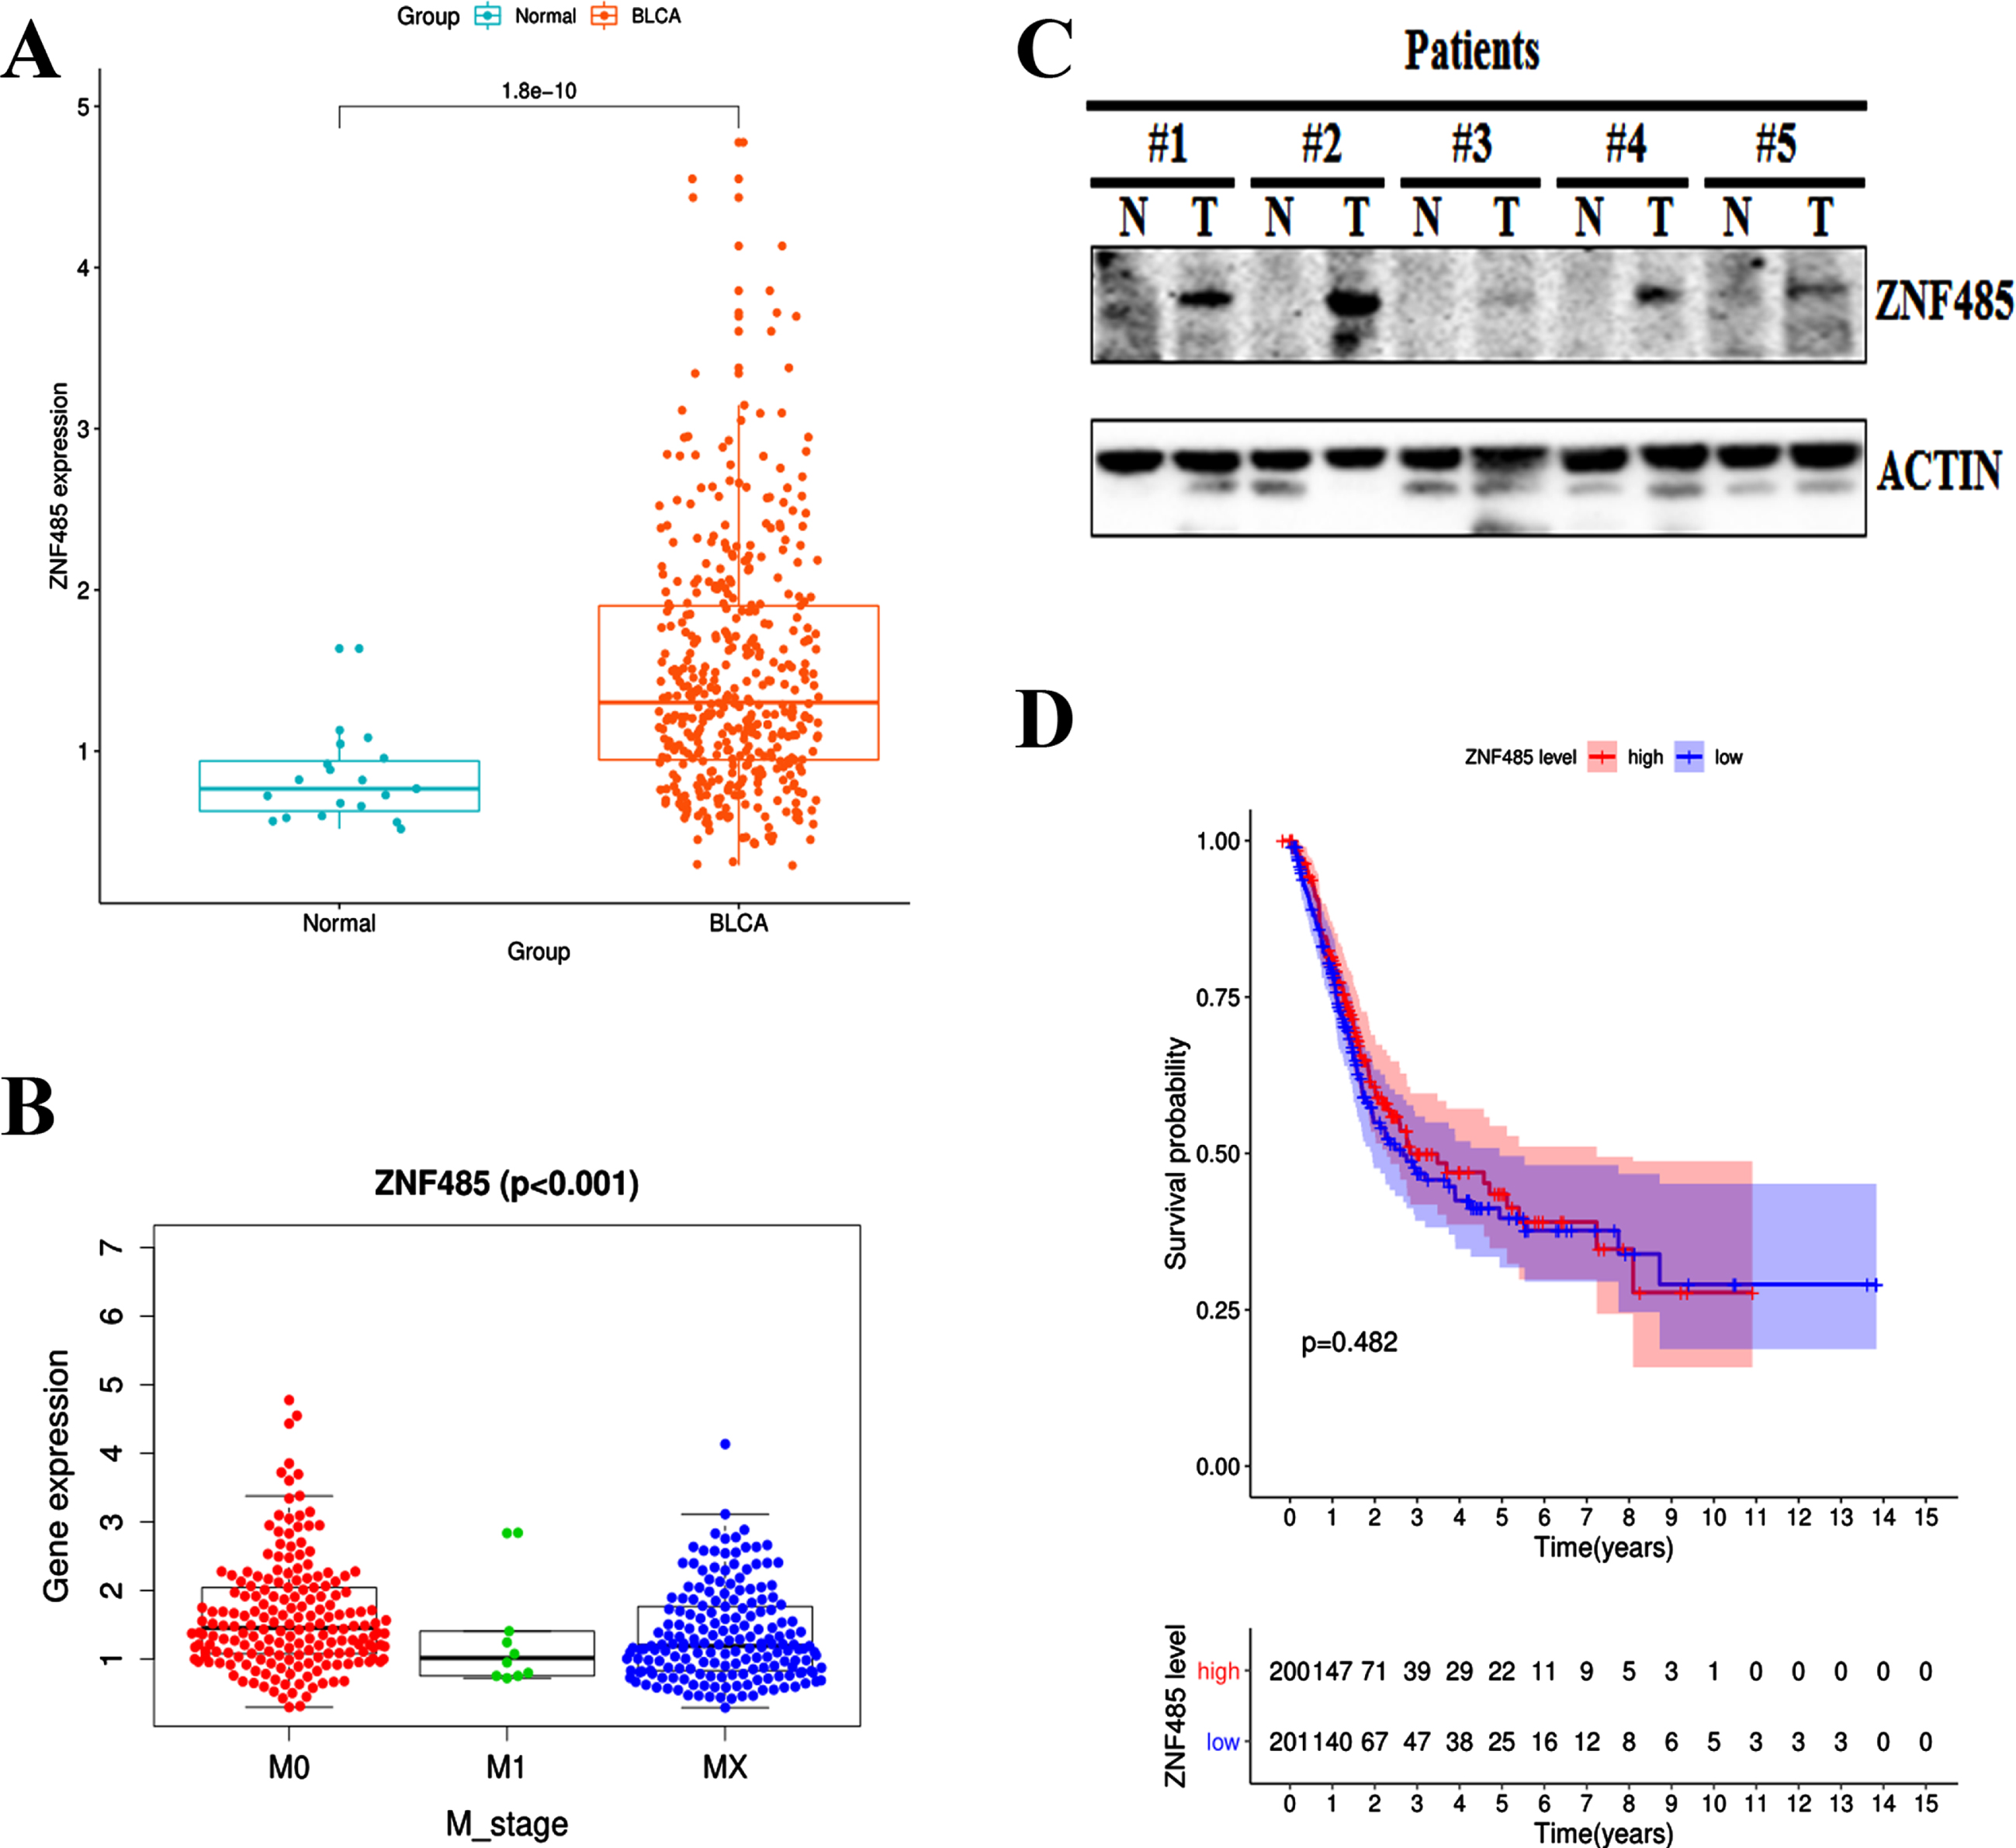
We applied the RNA-seq technique to screen the differentially expressed genes in bladder cancer patients from TCGA database (Data type: FPKM, https://portal.gdc.cancer.gov/). Compared to the normal tissues from 19 samples, the expression of ZNF485 was significantly higher in the tissues of 414 bladder cancer patients (Fig. 1A). Further clinicopathological analysis showed that the expression profile of ZNF485 was variable in grade and M stage among bladder cancer patients, compared to the M1 and MX stages, the M0 stage patients in which the cancer has not spread to other parts of the body have slightly higher and more variable expression of ZNF485 (Fig. 1B). Western blotting assay showed the expression of ZNF485 in five paired BLCA tumor samples (T) slightly higher than the adjacent normal tissues (N) (Fig. 1C). Unfortunately, based on Kaplan-Meier plot, the expression of ZNF485 has little prognostic ability (Fig. 1D). These results demonstrated that ZNF485 is highly expressed in bladder cancer patients and presents variable expression profiles in patients of different stages.
Fig. 1
Bioinformatics analysis showed that the expression level of the ZNF485 gene in bladder cancer (BLCA) was significantly higher than that in adjacent tissues. (A) Relative expression levels calculated from the ZNF485 FPKM data in 414 paired BLCA samples and 19 paired normal control group. ***, p value < 0.001. (B) The relationship between ZNF485 and clinicopathological parameters in patients with BLCA. The expression of ZNF485 was significantly different in the grade (B) and M_stage (C) groups. (C) Western blotting assay of ZNF485 expression in five paired BLCA tumor samples (T) and adjacent normal tissues (N). (D) There was no correlation between ZNF485 and the survival of BLCA patients.
Downregulation of ZNF485 regresses the proliferation of bladder cancer cells
To gain mechanistic insight into the function of ZNF485 in bladder tumorigenesis, we downregulated the level of ZNF485 in the bladder cell lines T24 and 5637. We first analyzed the expression of ZNF485 in T24 and 5637 bladder cancer cells by real-time PCR and western blot. The results showed that T24 and 5637 cells had a higher expression of ZNF485 at both the mRNA and protein levels (Fig. 2A). Afterwards, three different siRNAs targeting ZNF485 were synthesized to test the effect of ZNF485 downregulation on the proliferation of T24 cells. Indeed, transfection of any of three siRNAs significantly inhibited the expression of ZNF485 at both the mRNA (Fig. 2B) and protein levels (Fig. 2C).
Fig. 2
Knockdown of ZNF485 inhibits BLCA cell proliferation. (A) Levels of ZNF485 in BLCA 5637 and T24 cells measured by real-time PCR and western blot analyses. (B and C) The mRNA and protein levels of ZNF485 determined by (B) real-time PCR and (C) western blot analyses in three different regions of siRNAs transfected into T24 cells versus the negative control (siCtrl). (D) CCK-8 assays every 24 hours showed that ZNF485 inhibited the proliferation of T24 cells transfected with three different regions of siRNAs versus the negative control (siCtrl). (E) CCK-8 assays every 24 hours showed that ZNF485 inhibited the proliferation of 5637 cells transfected with ZNF485knockdown versus the negative control (siCtrl). (F) ZNF485 inhibited cell proliferation, as shown by EdU staining assays, in T24 cells transfected with ZNF485 knockdown versus the negative control (siCtrl). ***, p value < 0.001.
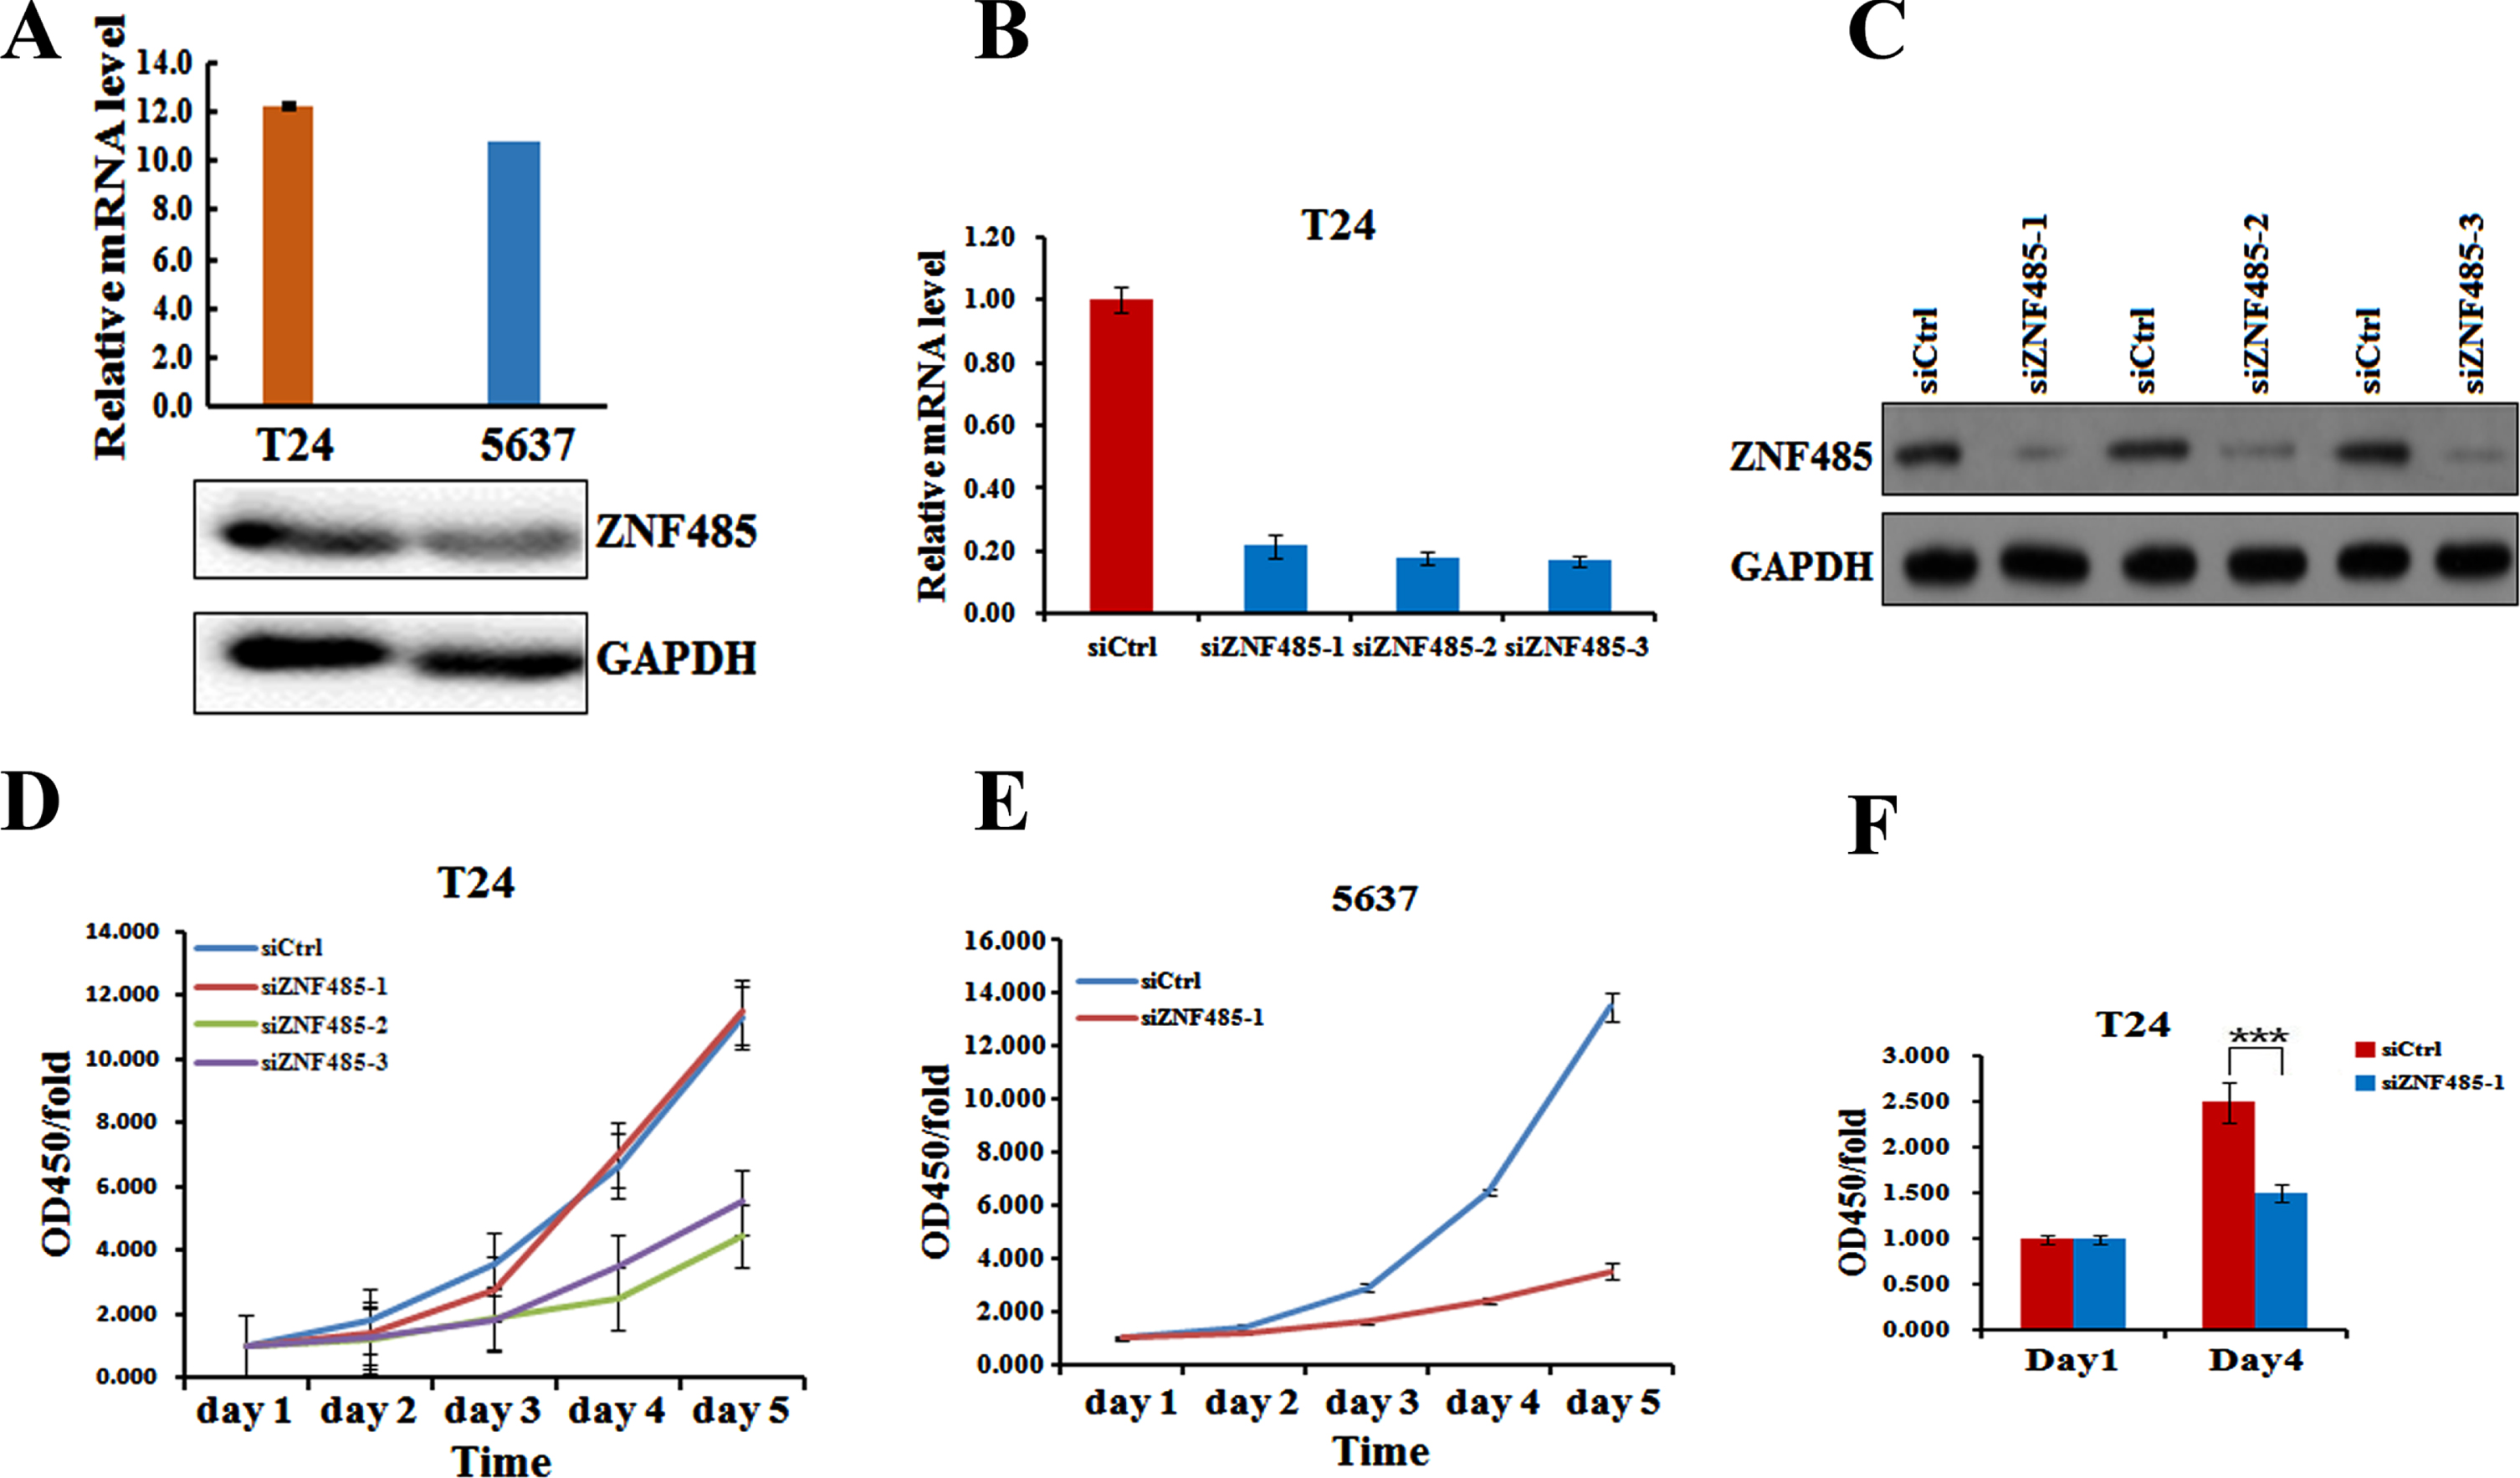
By measuring the OD450 every 24 hours, the CCK-8 assays showed that downregulation of ZNF485 by three siZNF485 decreased the cell growth rate of T24 cells, with siZNF485-2 and siZNF485-3 having a more significant effect (Fig. 2D). Moreover, transfection of siZNF485-1 also dramatically decreased the cell growth of 5637 cells (Fig. 2E). Further EdU staining assays also confirmed a decreased cell growth rate of T24 cells on day 4 when transfected with siZNF485-1 (Fig. 2F).
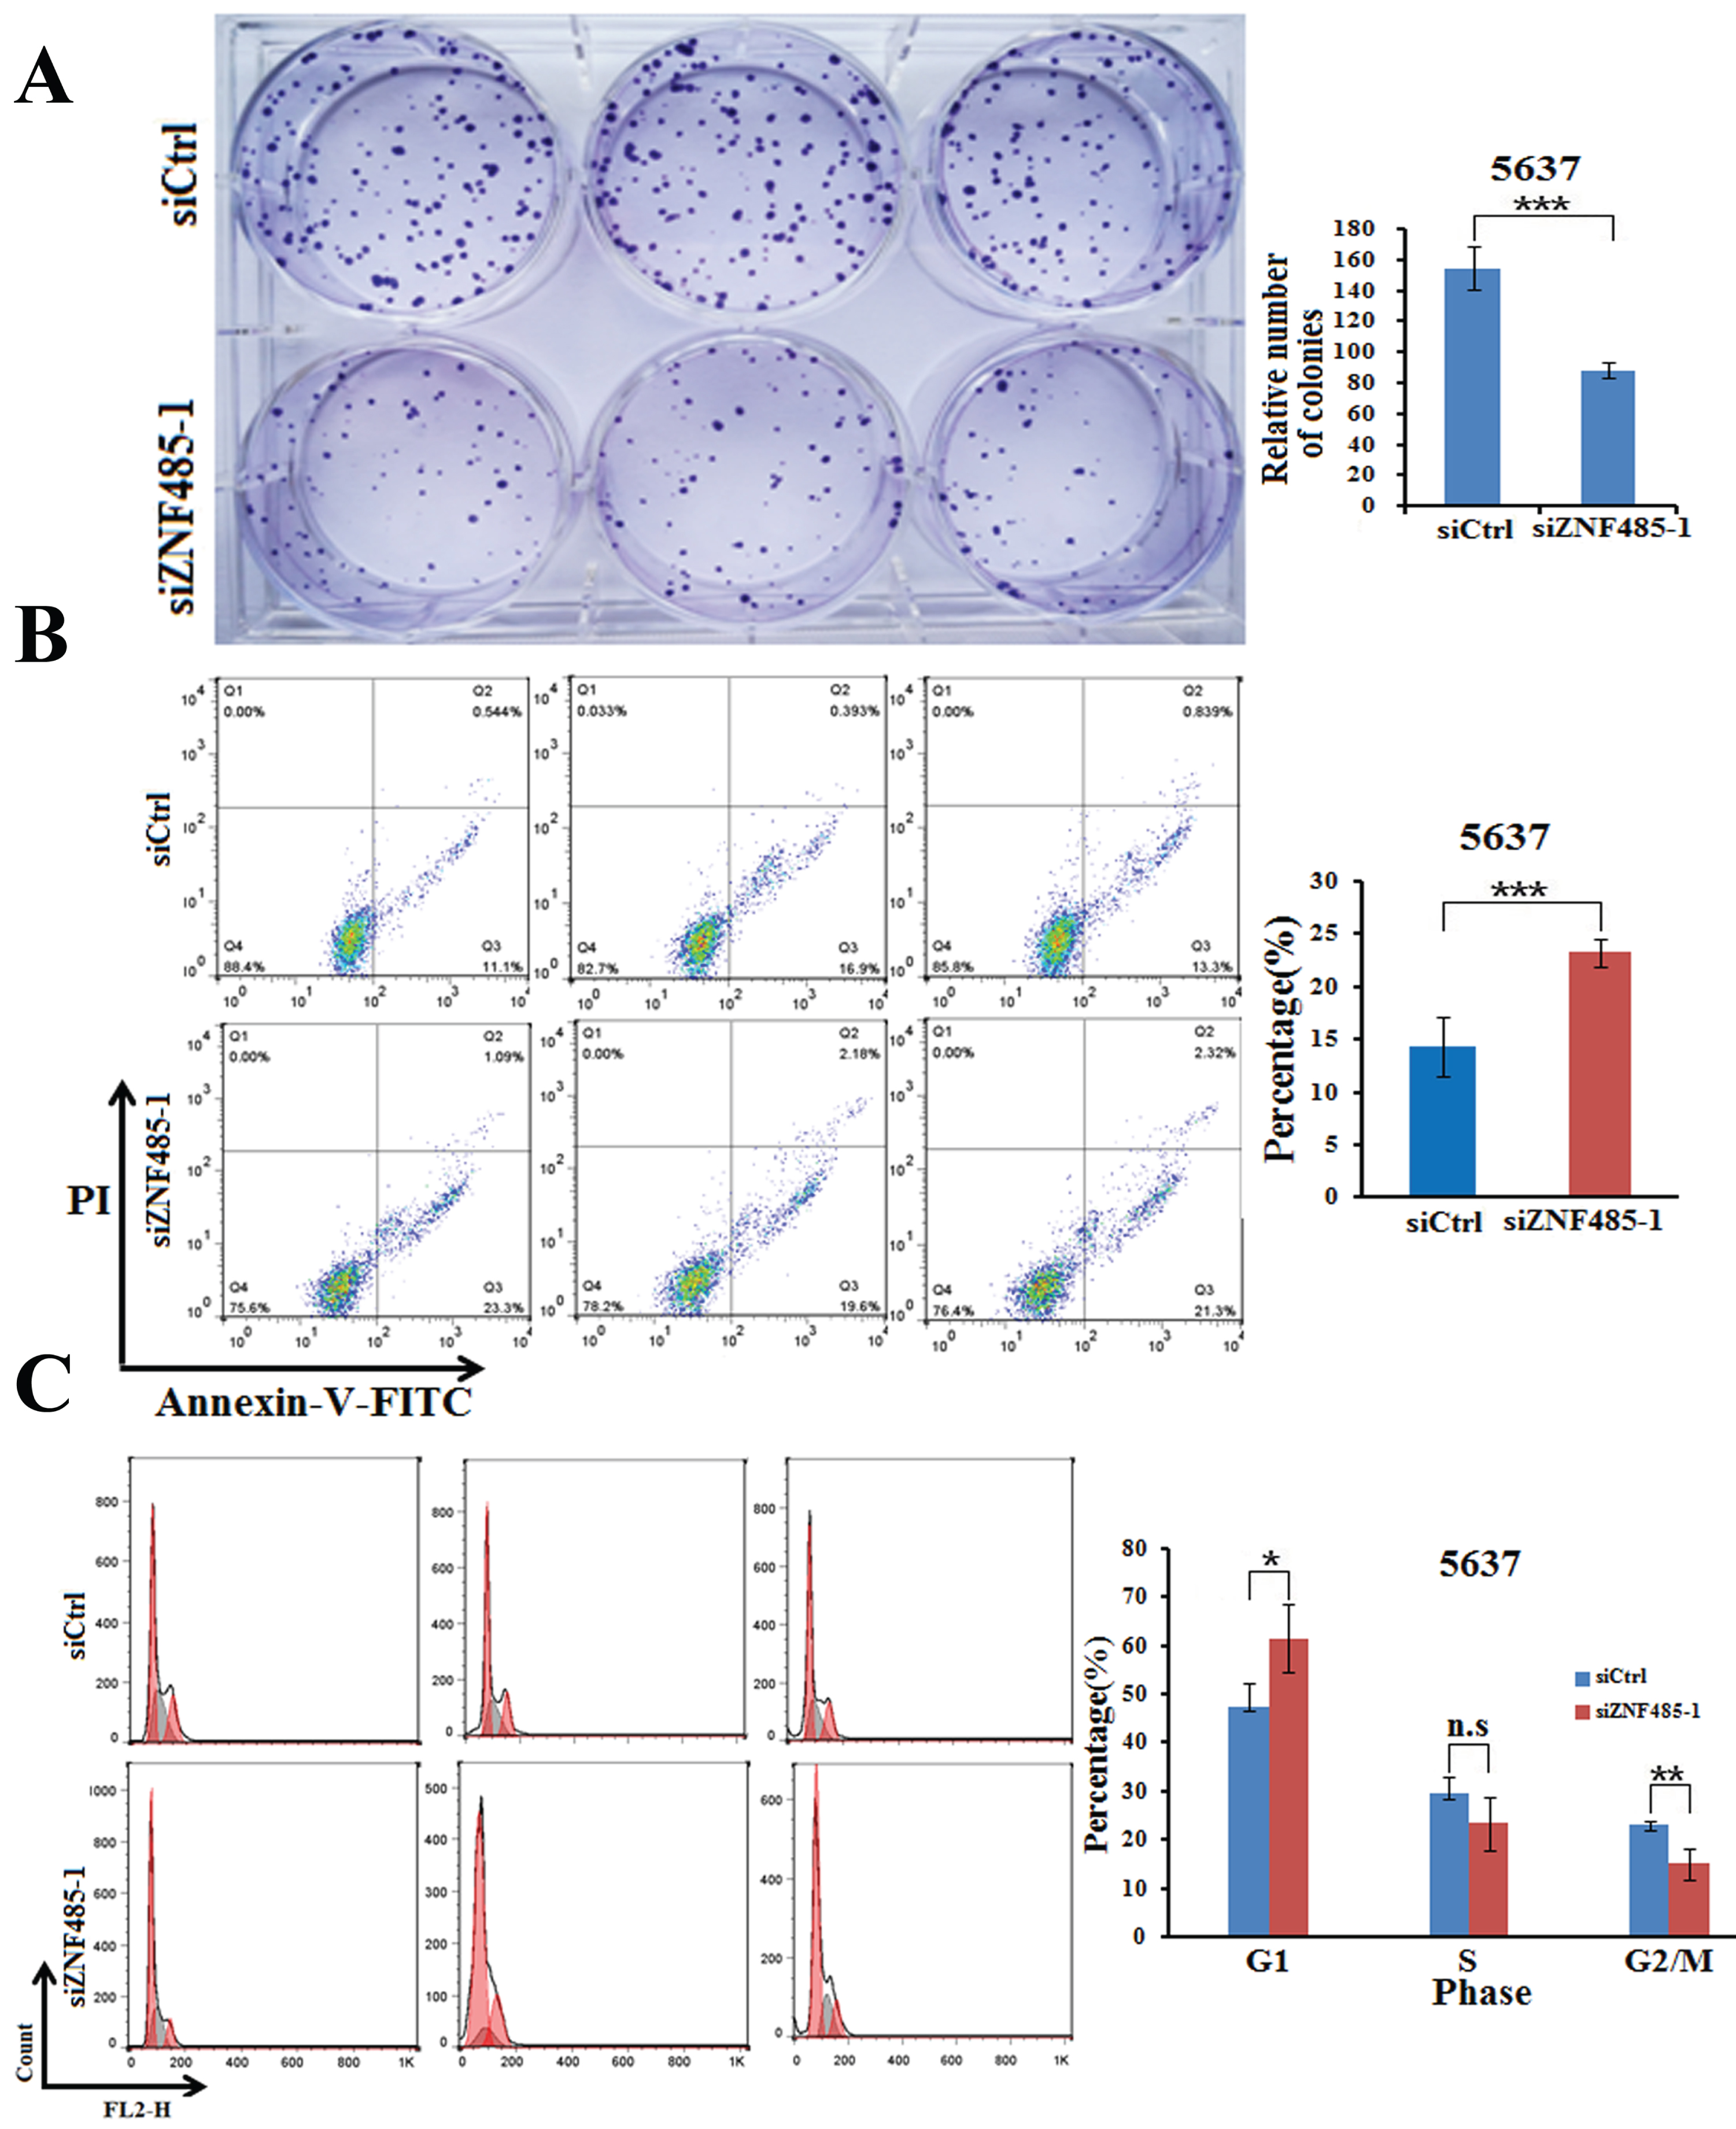
We further performed colony formation assays to test the effect of ZNF485 downregulation on the proliferation of 5637 cells. As shown in Fig. 3A, transfection of siZNF485-1 into 5637 cells decreased the cell colonies to ∼60% compared to the control cells (Fig. 3A). All these results clearly showed that downregulation of ZNF485 in bladder cancer cells inhibits cell proliferation, which indicates that high expression of ZNF485 in bladder cancer might promote cell proliferation.
Fig. 3
Downregulation of ZNF485 inhibits cell colony formation, promotes apoptosis and increases the number of cells in G1 phase. (A) Colony formation assays showed that ZNF485 knockdown inhibited cell proliferation in 5637 cells versus the negative control (siCtrl). ***, p value < 0.001. (B) ZNF485 knockdown induced apoptosis, as shown by annexin V-FITC staining assays in 5637 cells versus the negative control (siCtrl). ***, p value < 0.001. (C) Cycle analysis conducted by flow cytometry indicated G1 phase arrest in 5637 cells transfected with ZNF485 knockdown versus the negative control (siCtrl). *, p value < 0.05.
Downregulation of ZNF485 promotes the apoptosis of bladder cancer cells
To further decipher the effect of ZNF485 on bladder cancer cells, we analyzed cell apoptosis when 5637 cells were treated with ZNF485 knockdown. Compared to the control cells, which had an apoptotic rate of ∼15%, ZNF485 downregulation significantly elevated cell apoptosis to ∼25% (Fig. 3B). The following cell cycle analysis conducted by flow cytometry indicated that the majority of 5637 cells were arrested in G1 phase when transfected with siZNF485-1 (Fig. 3C). Consequently, the cell fractions in the S and G2/M phases were much less abundant than those in the control group. The results indicated that ZNF485 at a high level in bladder cancer cells inhibits cell apoptosis, most likely by G1 phase arrest.
The inhibition of ZNF485 reduces cell mobility and invasion of bladder cancer cells
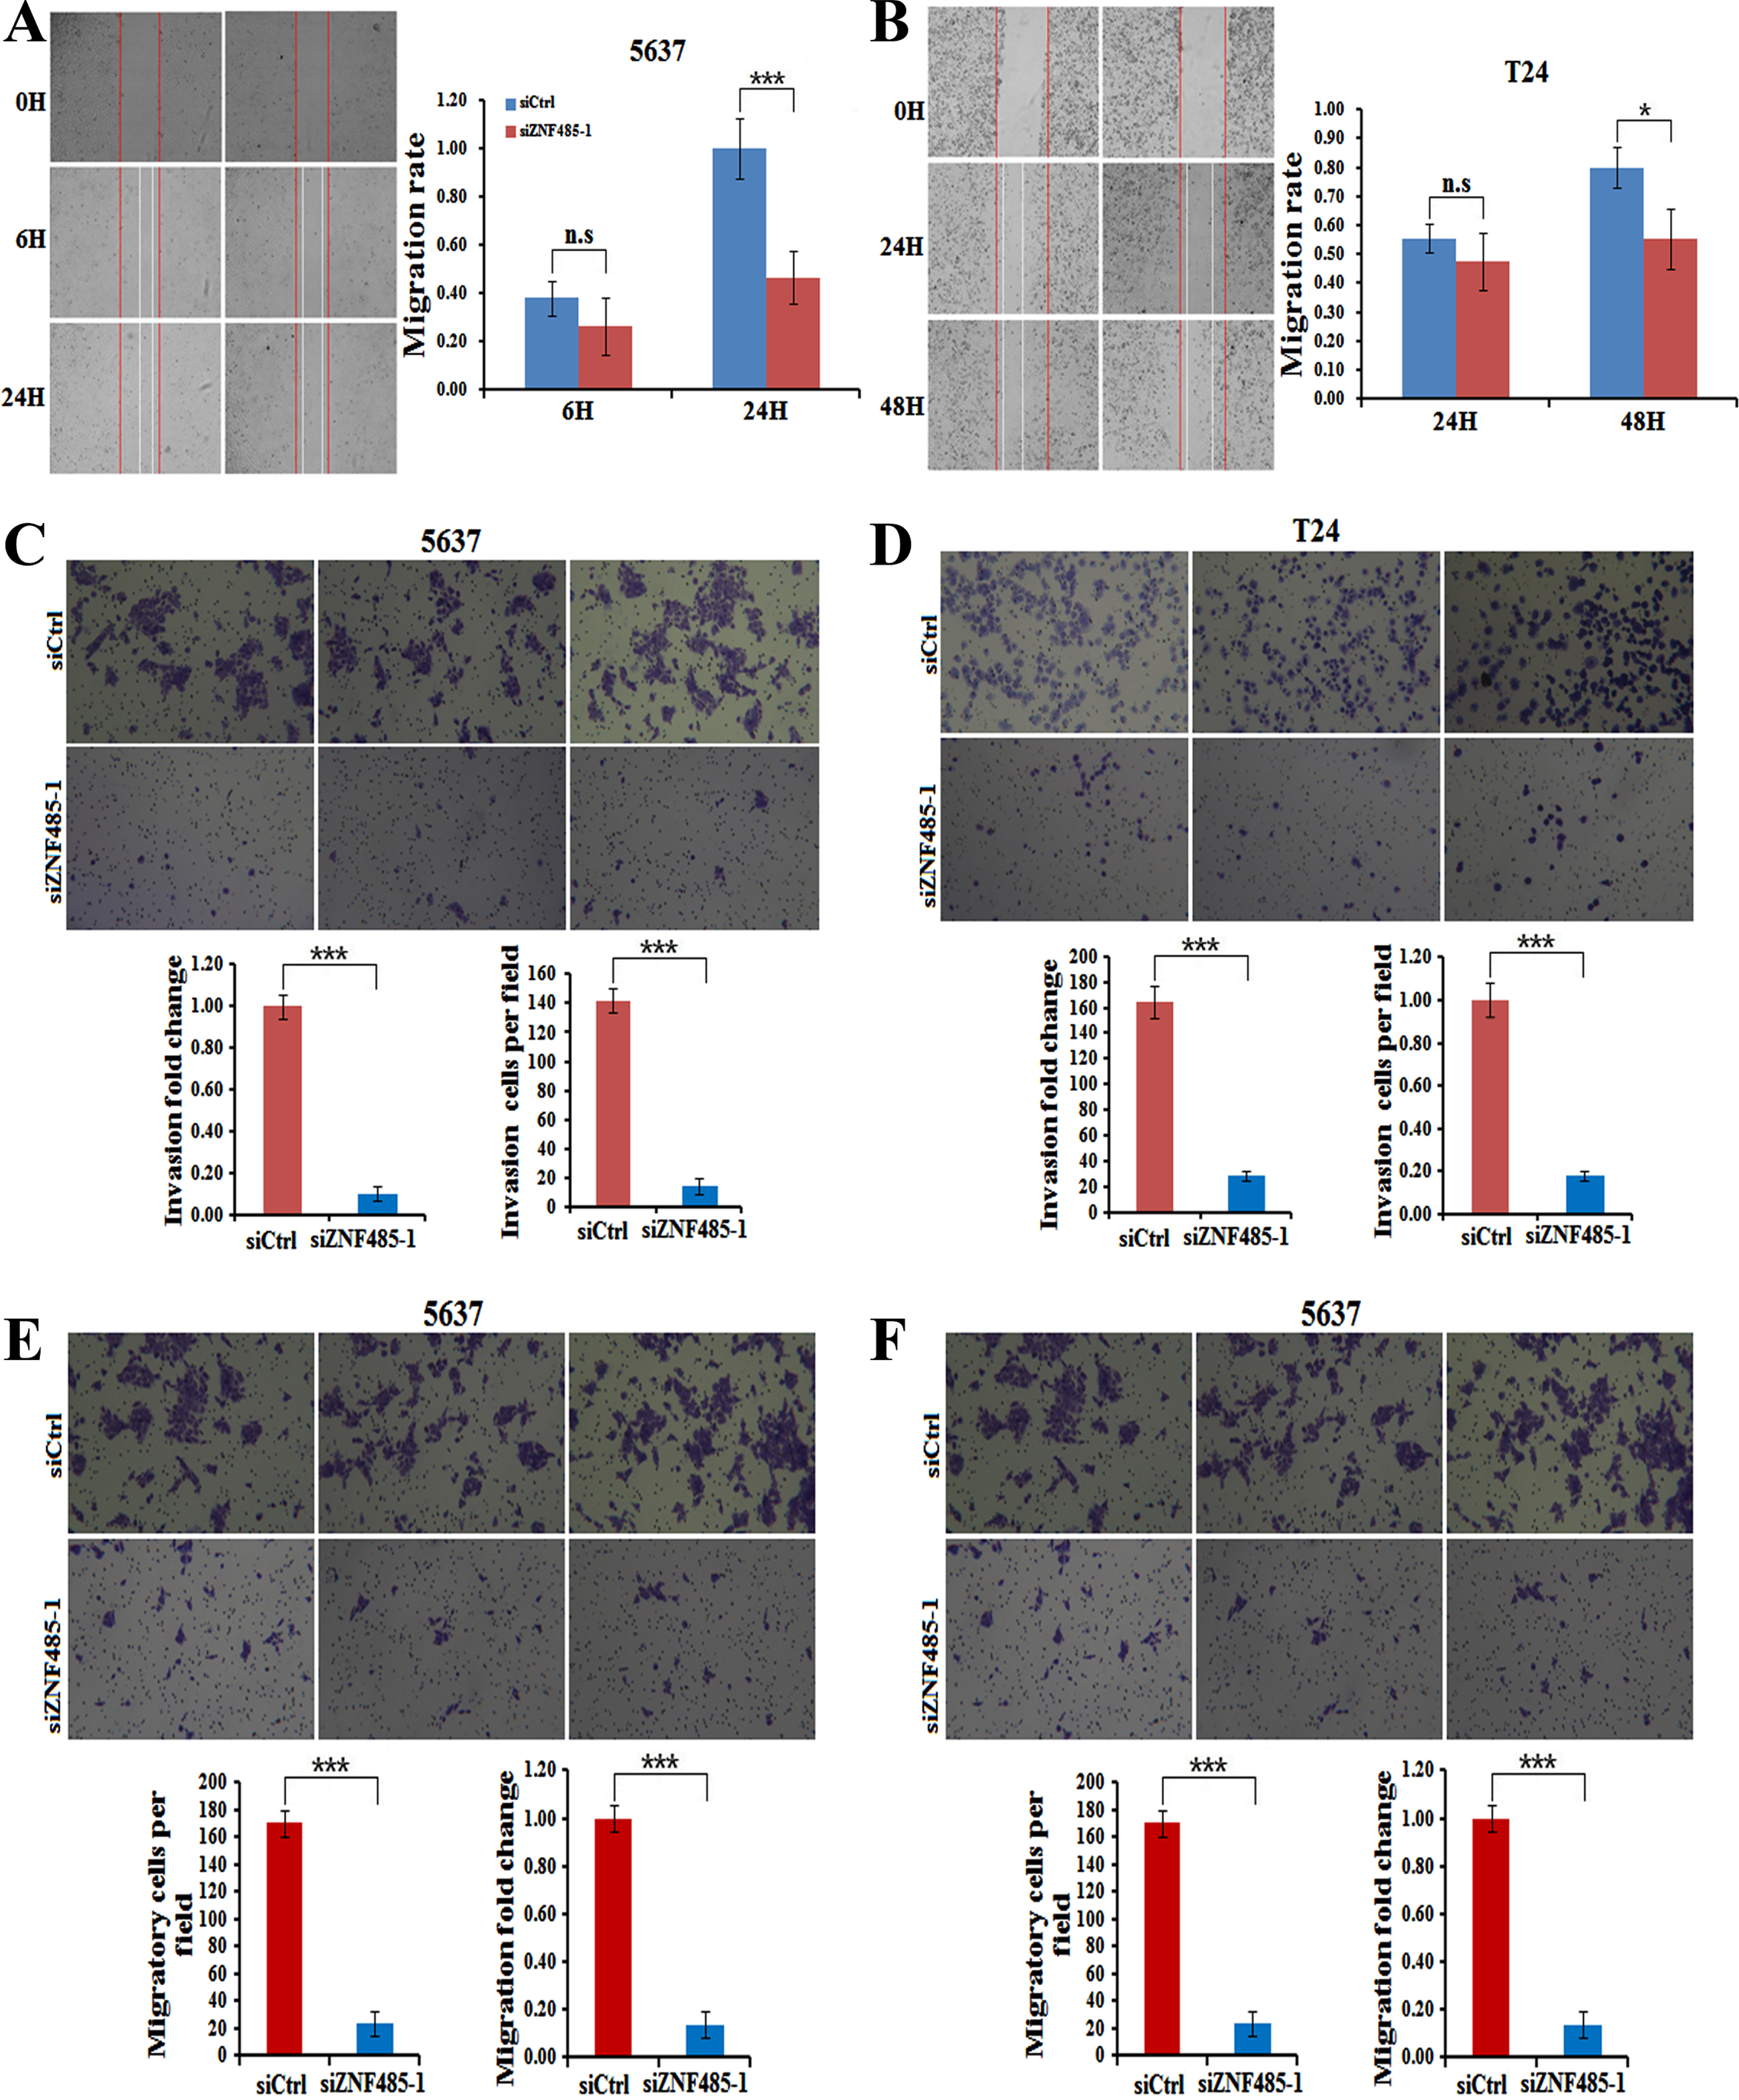
Since cell motility is required for tumor metastasis, we thus explored the effects of ZNF485 interference on bladder cancer cell migration and invasion. Wound healing assays were used to test the changes in cell mobility. Compared with non effective scrambled siRNA-treated cells, ZNF485-silenced cells showed a larger scratch space in the 5637 cell line after scratching for 24 hours (Fig. 4A), indicating a reduced capability of cell mobility. A similar case was also found after scratching for 48 hours in T24 cells transfected with siZNF485-1 (Fig. 4B). Moreover, the invasion assays showed that downregulation of ZNF485 by siZNF485-1 transfection dramatically decreased the invasion capability of both 5637 and T24 cells, in which the cell numbers and the OD value of 570 nm were reduced markedly after ZNF485 ablation (Figs. 4C and 4D). In addition, as shown by the cell migration assays, ZNF485 downregulation inhibited the migration of both 5637 and T24 cells (Figs. 4E and 4F). Taken together, these results suggested that ZNF485 plays a pivotal role in the mobility, invasion and migration of bladder cancer cells.
Fig. 4
ZNF485 knockdown inhibits BLCA cell wound healing and invasion. (A) The wound healing assays showed that ZNF485 knockdown reduced the cell mobility of 5637 cells versus the negative control (siCtrl) for 48 hours, and the results were recorded (left) and quantitatively analyzed (right). ***, p value < 0.001. (B) The wound healing assays showed that ZNF485 knockdown reduced the cell mobility of T24 cells versus the negative control (siCtrl) for 48 hours (left) and quantitatively analyzed (right). *, p value < 0.05. (C) Representative images (left) and quantification (right) of invasion assays showed that ZNF485 knockdown reduced the invasion of 5637 cells versus the negative control (siCtrl) at 36 hours. *, p value < 0.05. Scale bar: 100μm. (D) Representative images (left) and quantification (right) of invasion assays showed that ZNF485 knockdown reduced the invasion of T24 cells versus the negative control (siCtrl) at 36 hours. *, p value < 0.05. Scale bar: 100μm. (E) Representative images (left) and quantification (right) of migration assays showed that ZNF485 knockdown reduced the migration of 5637 cells versus the negative control (siCtrl) for 36 hours. *, p value < 0.05. Scale bar: 100μm. (F) Representative images (left) and quantification (right) of migration assays showed that ZNF485 knockdown reduced the migration of T24 cells versus the negative control (siCtrl) for 36 hours. *, p value < 0.05. Scale bar: 100μm.
ZNF485 ablation inhibits bladder cancer proliferation in nude mice
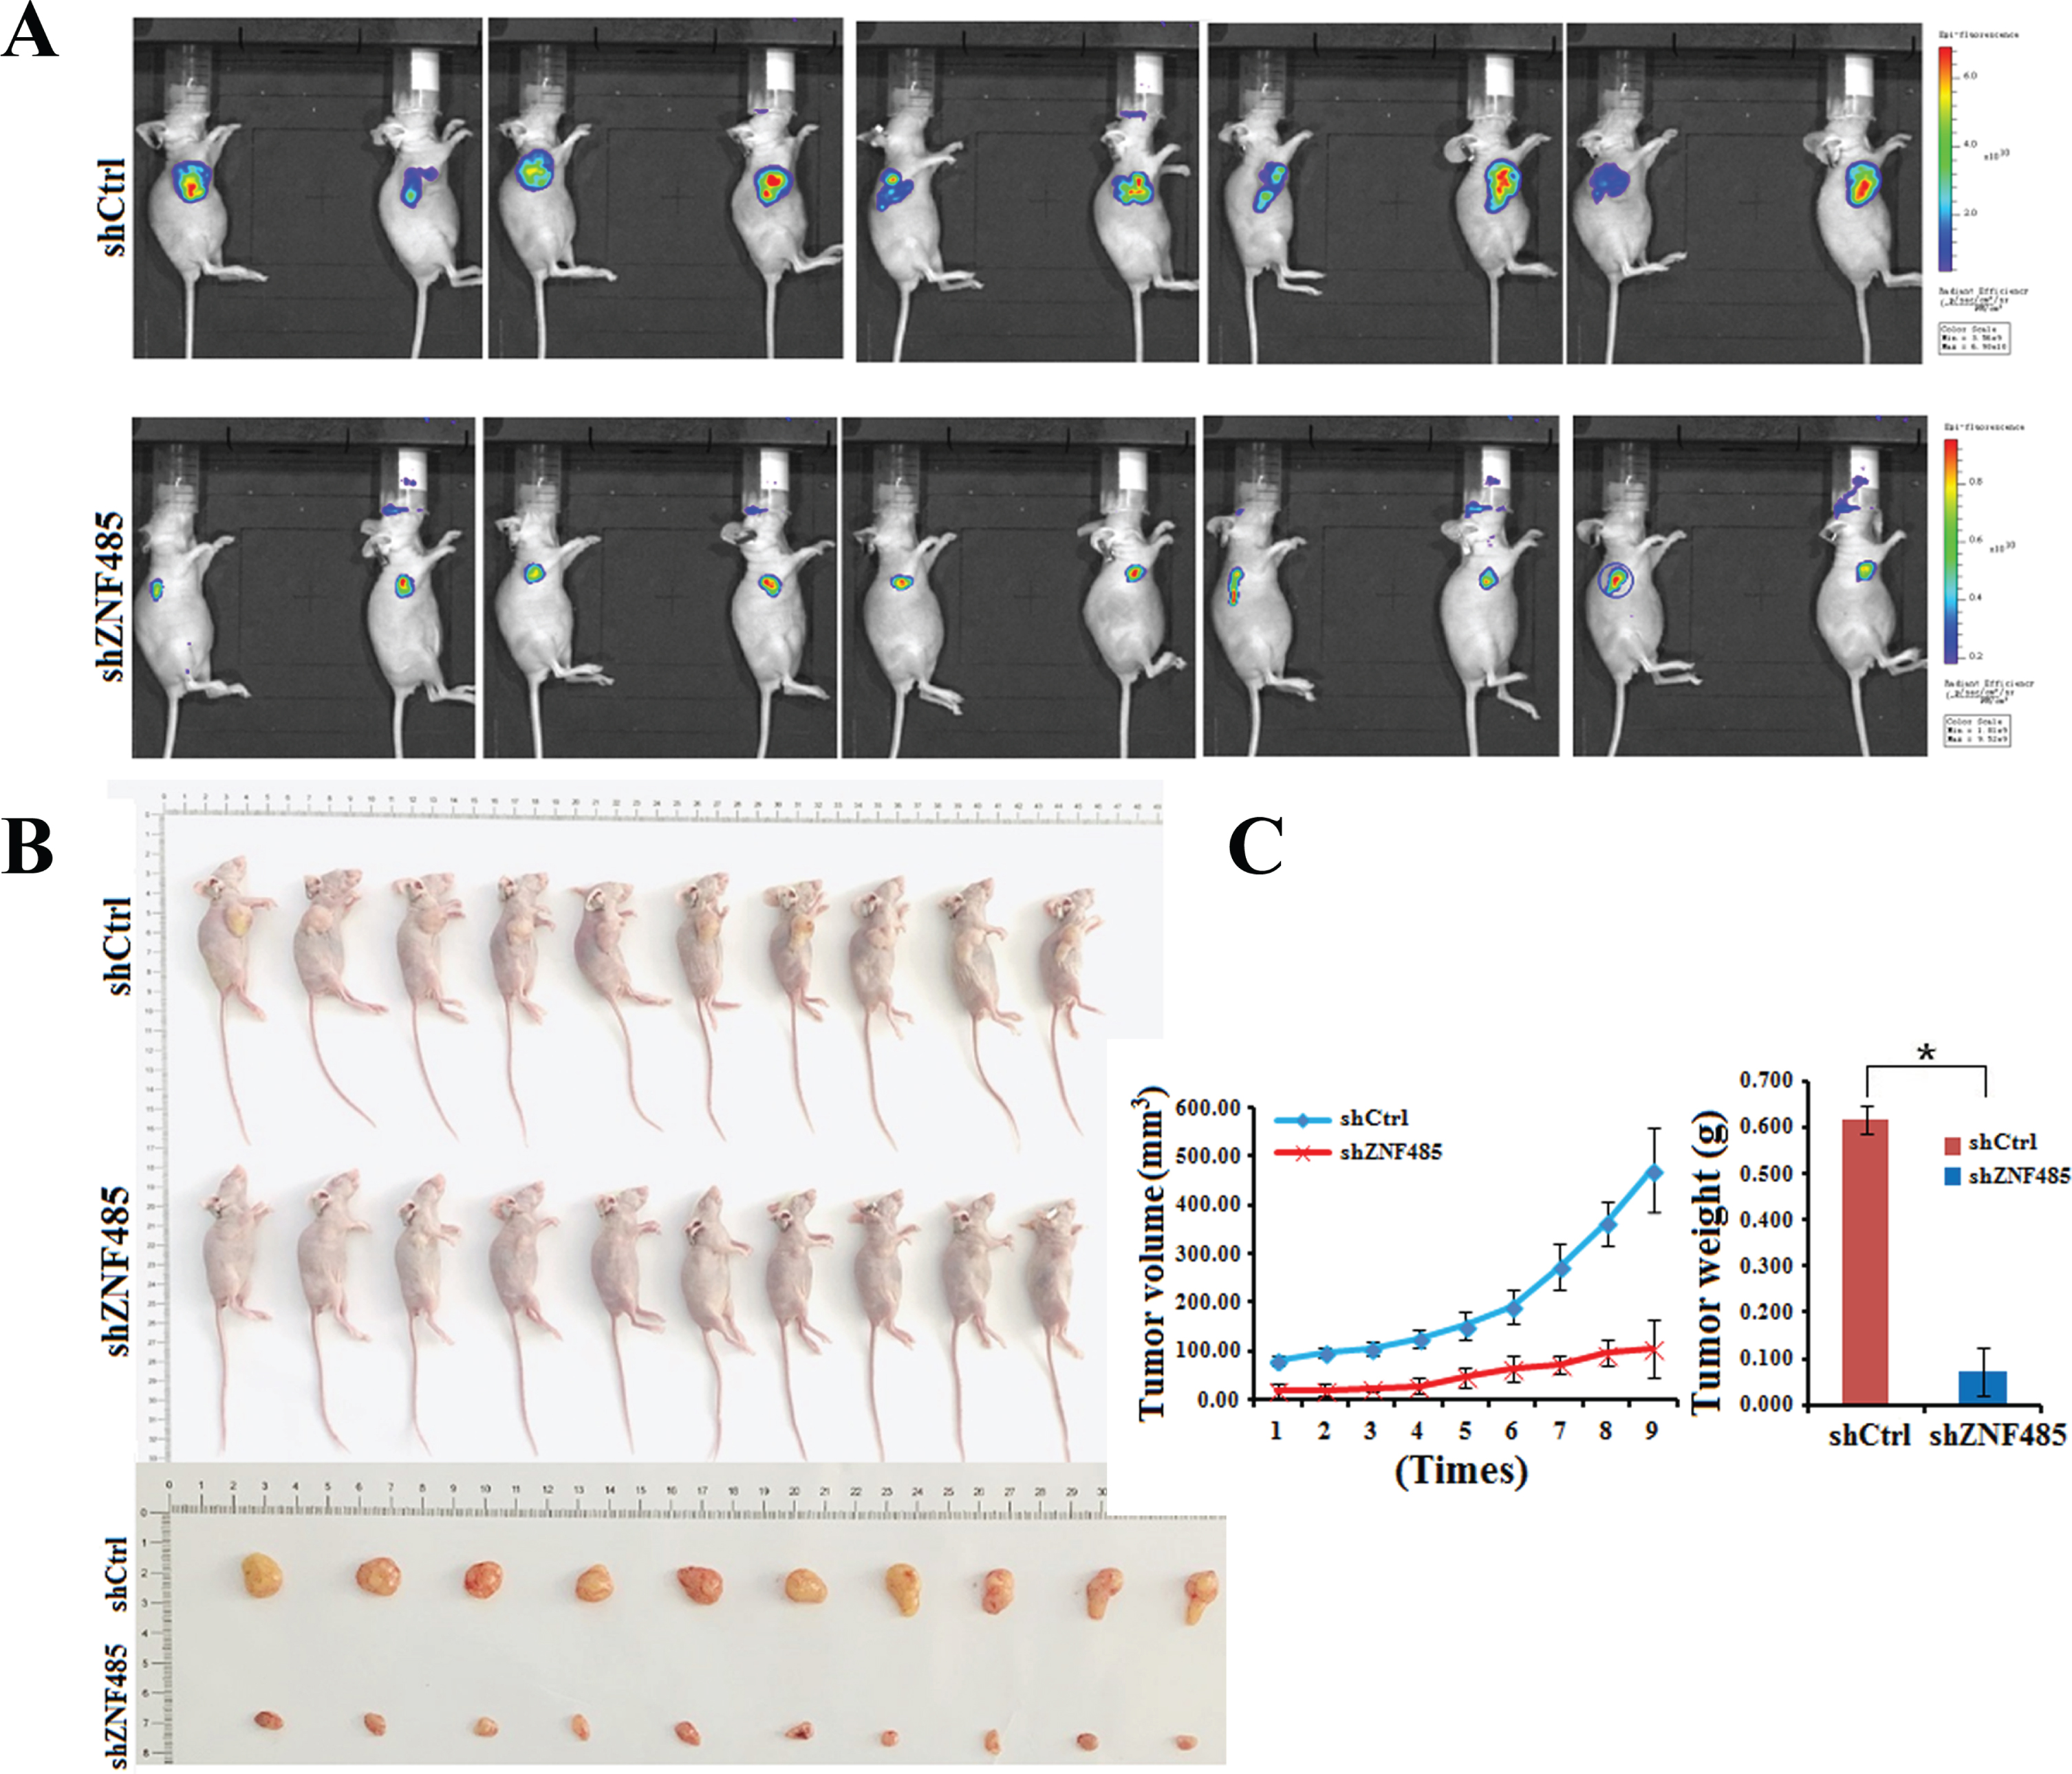
Our in vitro data indicated an important role of ZNF485 in the proliferation and invasion of bladder cancer cells. To further determine whether inhibition of ZNF485 could suppress the progression of bladder cancer, an in vivo tumor model injected with 5637 cells infected with siCtrl or shZNF485 lentivirus was used. shZNF485 lentivirus were used in the nude mouse interference experiment. The experimental process is to synthesize siRNA transiently transfected knockdown znf485. After verifying the knockdown efficiency, shRNA is designed for the knockdown efficiency target, after packaging lentivirus infected cells and screening stable cell lines, the tumor formation experiment was carried out. The tumor sizes, volumes and weights were measured every 2 days 4 weeks after cell injection. Ten representative tumors from each group were subjected to an in vivo imaging experiment. Compared with the control group, the tumor fluorescence intensity of the shZNF485 group was significantly decreased (Fig. 5A). Tumor growth from the xenograft model in the shZNF485 group was significantly inhibited, yielding an average size, volume and weight, and photographed and shown in Figs. 5B and 5C. The results confirmed that ZNF485 functions in vivo to promote bladder tumorigenesis in nude mice.
Fig. 5
ZNF485 knockdown inhibits BLCA cell migration and tumor formation in nude mice. (A) In vivo imaging experiments of the shZNF485 group and control group showed tumor fluorescence intensity in nude mice. (B and C) The effect of ZNF485 on tumor formation, tumor weight and tumor volume change in a nude mouse T24-derived xenograft model. Representative images of tumors from ZNF485-knockdown versus the negative control (siCtrl) (n = 10 for each group).
Mechanism analysis of ZNF485
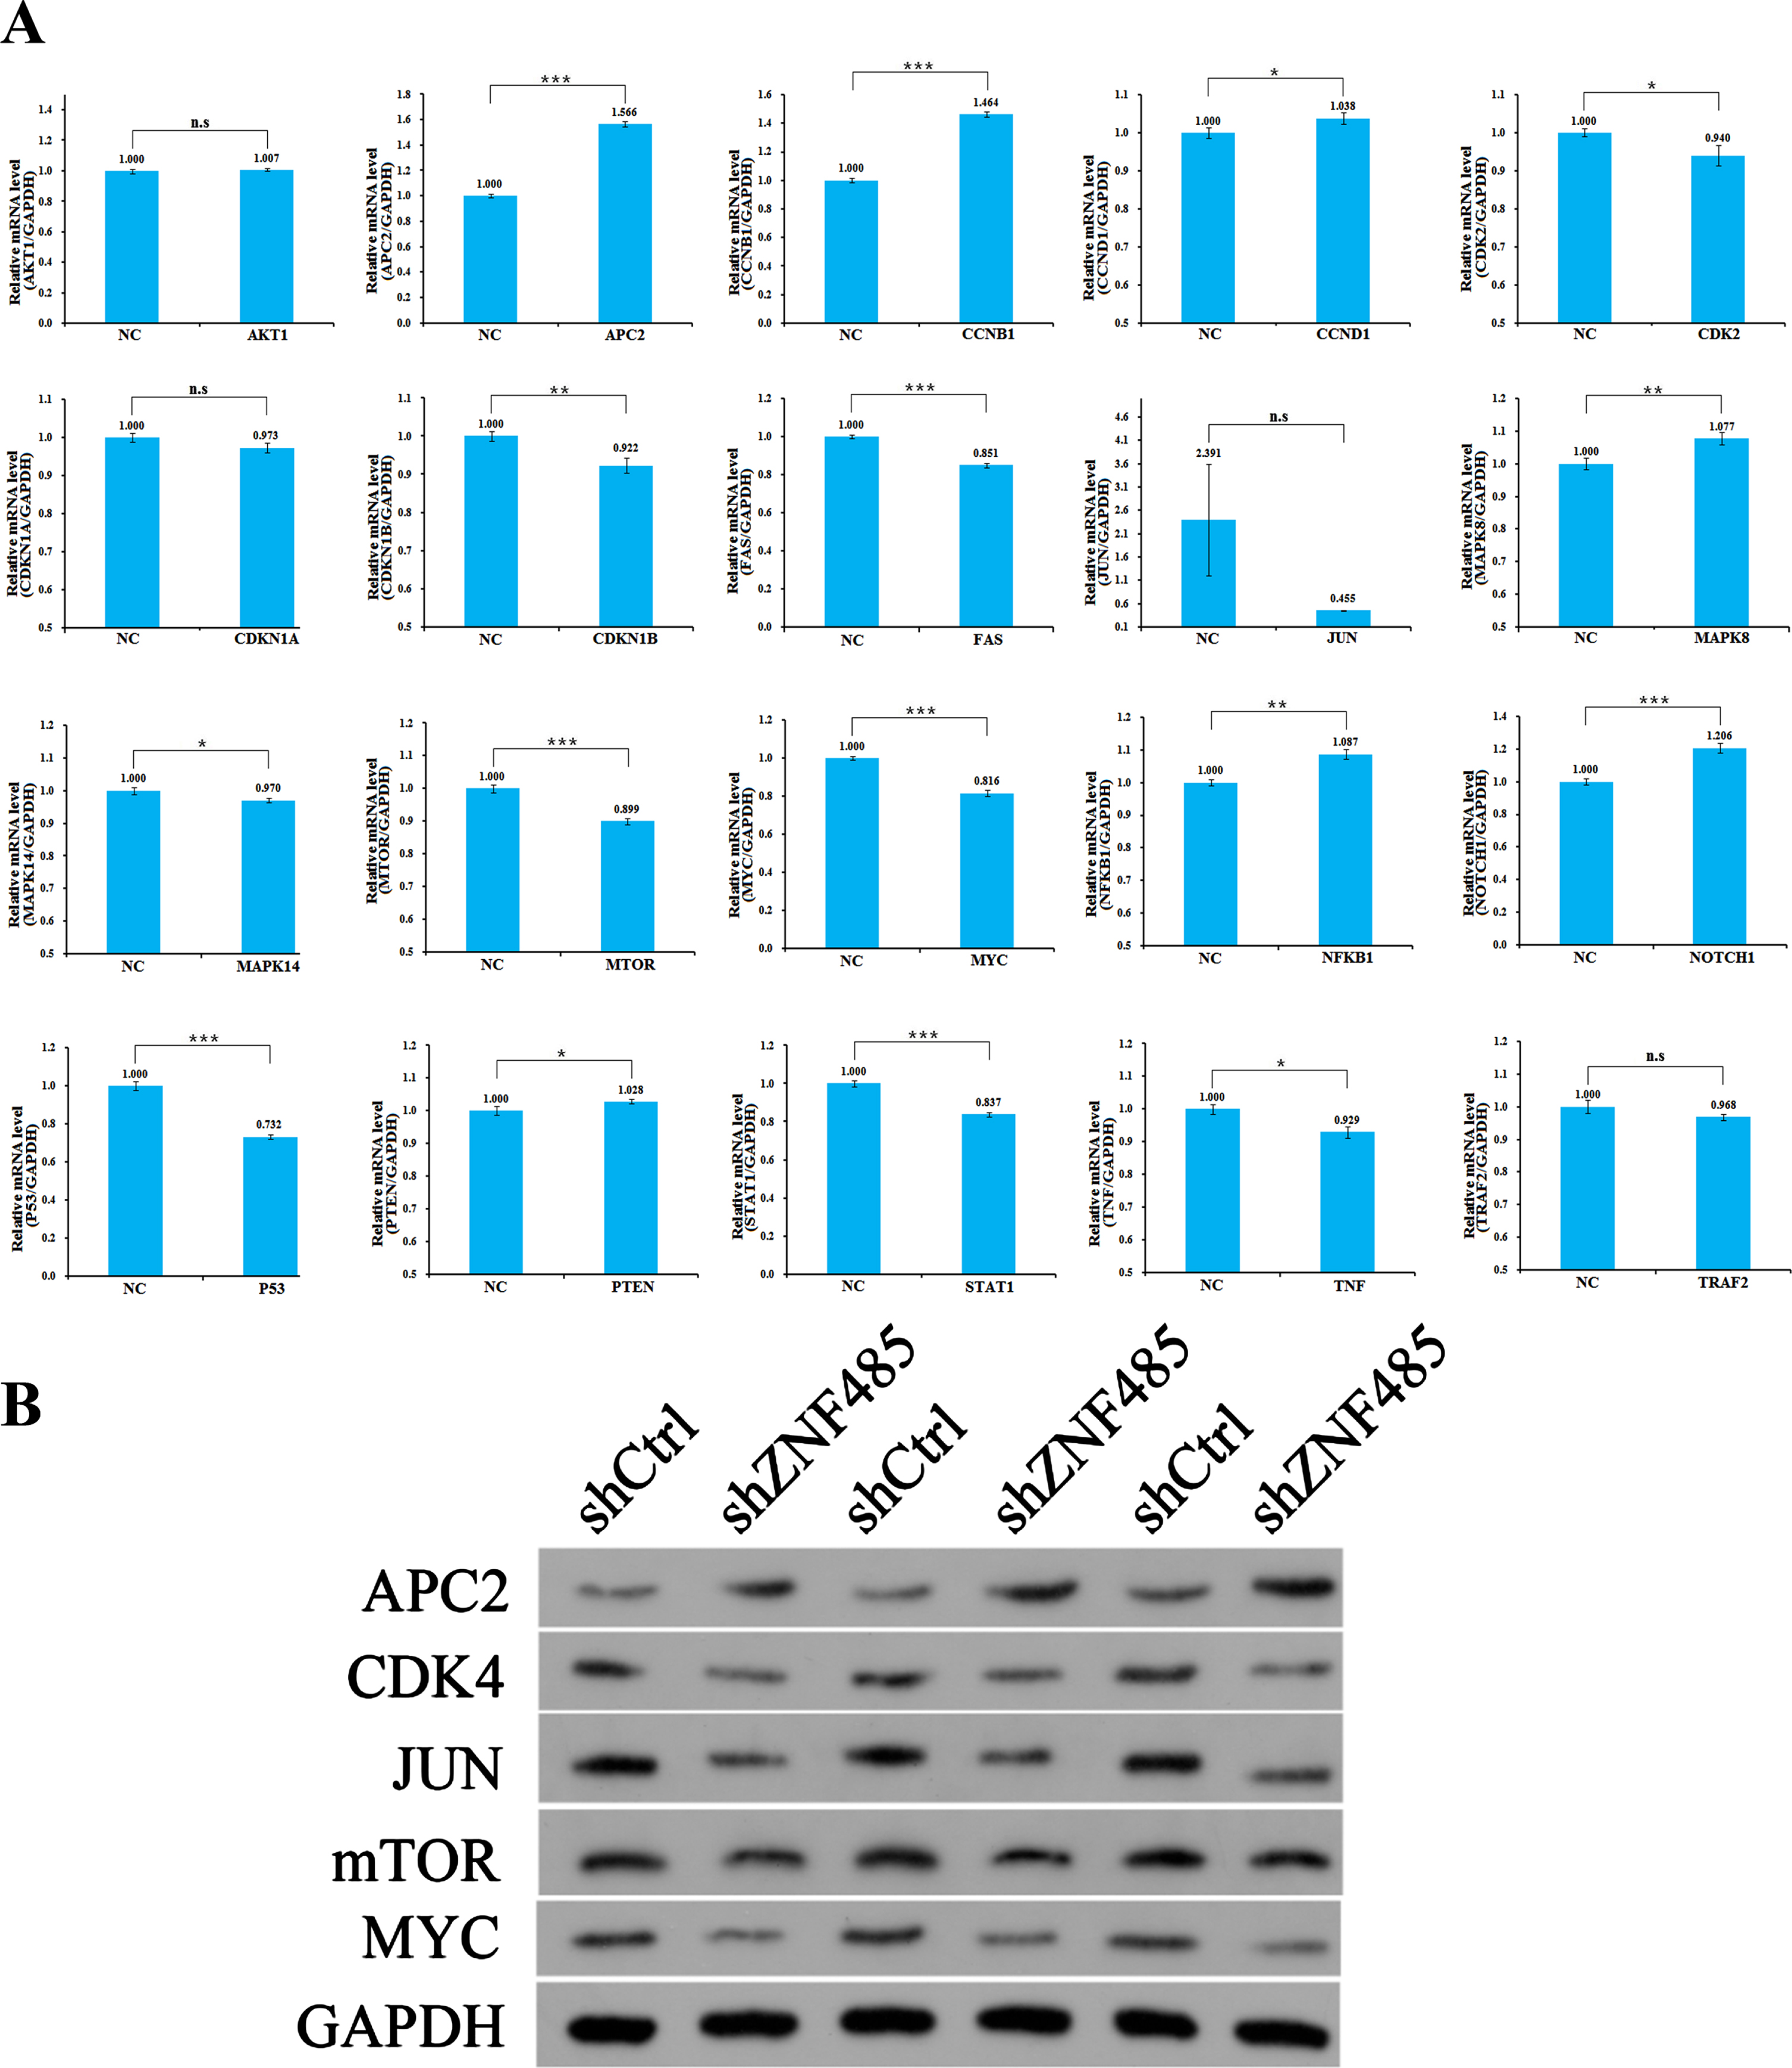
We made an associated bioinformatics prediction to identify possible downstream target genes related to popular pathways, which are strongly associated with cell cycle apoptosis and proliferation, and have a great impact on tumorigenesis and development. The purpose is to select the pathways with strong regulation correlation through wide screening and conduct in-depth research. The signaling pathways to be verified were preliminarily selected, and the expression levels of approximately 20 target genes in the candidate pathways were detected by qPCR in the T24 cell line. Compared with the control group, after interference with ZNF485, the expression abundances of APC2, CCNB1 and NOTCH1 increased by 1.6, 1.5 and 1.2 times, respectively. However, the expression abundances of CDK4, CDKN1B, FAS, JUN, mTOR, MYC, P53, STAT1, TNF, TRAF2 and MAPK14 decreased by 0.94, 0.92, 0.85, 0.45, 0.90, 0.82, 0.73, 0.84, 0.93, 0.97 and 0.97 times, respectively; however, the expression abundances of AKT1, CCND1, CDKN1A, mAPK8, NFKB1 and PTEN remained unchanged (Fig. 6A). Five target genes with large expression changes were selected, and Western blotting was used to detect the expression levels. The western blot results showed that the APC2 protein content increased and the CDK4, JUN, mTOR and MYC protein content decreased in the shZNF485 group after lentivirus infection (Fig. 6B).
Fig. 6
Mechanism analysis of ZNF485. (A) qRT-PCR experiments were used to detect the expression levels of 20 related genes in the candidate pathway. (B) Western blotting verified that qPCR detected the expression levels of five genes with great differences.
Detection of ZNF485 expression in clinical paraffin samples
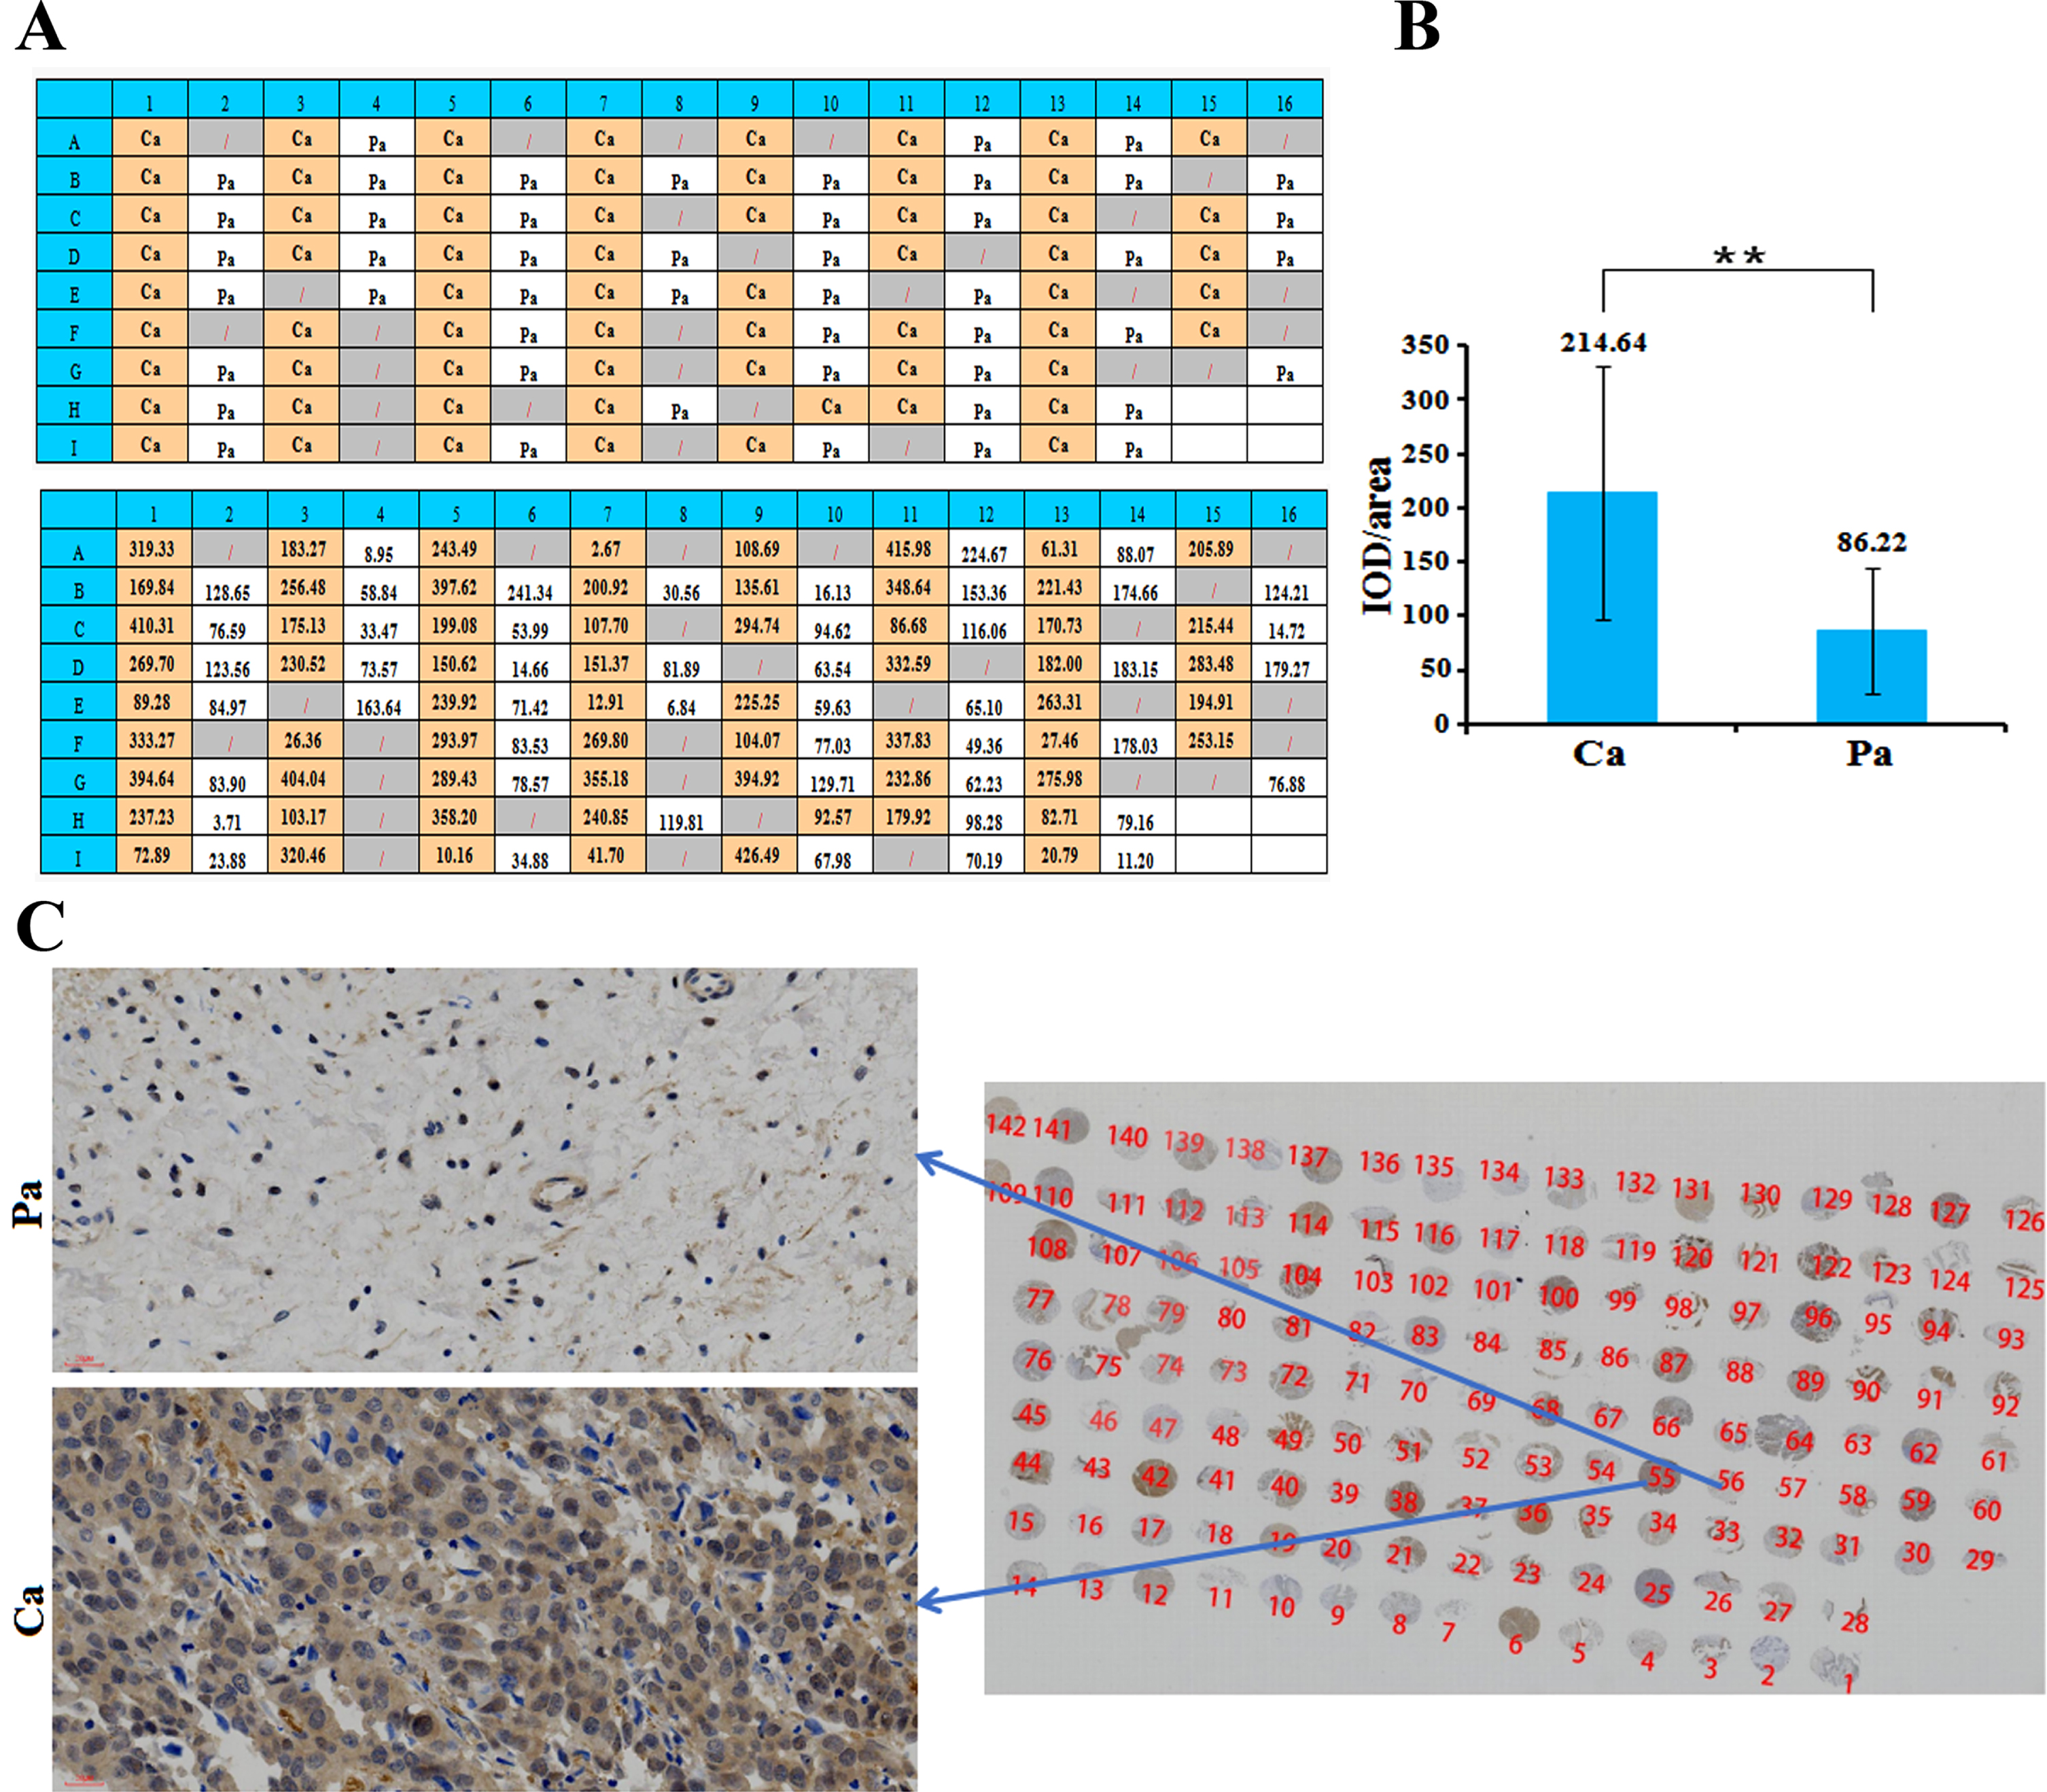
Immunohistochemistry was used to detect the expression of ZNF485 protein in human bladder cancer and adjacent tissue microarrays. In the section, the nucleus was blue, and the positive expression site was brownish yellow. Among all 112 tissues, 64 were cancer tissues, and 48 were adjacent tissues (Fig. 7A). The immunohistochemical results were semiquantitatively analyzed by Image Proplus software. The average optical density value (IOD/area) =cumulative optical density value/area of the measured staining area. The average optical density value of cancer tissues is 214.64, more than twice the adjacent tissues (Fig. 7B). From the immunohistochemical results of clinical samples, it can be seen that the expression level of ZNF485 protein in cancer tissues is generally higher than that in adjacent tissues (Fig. 7C).
Fig. 7
The expression level of the target gene in clinical samples was detected by immunohistochemistry. (A) The distribution of 64 bladder cancer tissues (Ca) and 48 paracancerous tissues (Pa) in the tissue microarray. (B) The average optical density value (IOD/area) = cumulative optical density value/area of the measured staining area. (C) The expression level of the target gene in clinical samples was detected by immunohistochemistry, and the expression level of ZNF485 protein in cancer tissues was generally higher than that in adjacent tissues.
DISCUSSION
ZNF485 is named zinc-finger protein 485, which belongs to the C2H2-type zinc-finger protein family. Sequence analysis showed that ZNF485 consists of eleven tandem repeats of C2H2 motifs. ZNF485 was predicted to be an RNA polymerase II-specific transcription factor that might act as a global regulator to control various signaling pathways. However, the target genes and the physiological function of ZNF48 remain unknown. In addition, the precise mechanism of ZNF485 in cancer development is still unclear. Here, we found that ZNF485 promotes the proliferation of bladder cancer cells in vitro, and siZNF485-treated nude mice exhibited restrained tumor growth in vivo. Bioinformatics prediction, qPCR and western assays found that APC2, CDK4, JUN, mTOR and MYC may be possible downstream target genes of ZNF485. Further immunohistochemical results of clinical samples showed that the expression level of ZNF485 protein in cancer tissues was higher than that in adjacent tissues. Thus, ZNF485 might be a master regulator that participates in the tumorigenesis of bladder cancer.
Our results provide the basis for further investigation of the molecular functions of ZNF485 and the detailed mechanism of ZNF485-regulated tumorigenesis of bladder cancer. As transcription factors are upstream factors controlling related signaling pathways, ZNF485 is a promising therapeutic target for bladder cancer. More investigations are needed to elucidate the molecular mechanism by which the transcription factor ZNF485 regulates the development of bladder cancer. The results provide evidence that ZNF485 is involved in the tumorigenesis of bladder cancer and might be a potential therapeutic biomarker for the treatment of this disease.
ACKNOWLEDGMENTS
We thank Prof. YongLiang Jiang for proofreading the manuscript and the staff who participated in this study.
FUNDING
This work was supported by the Fundamental Research Funds for the Central Universities granted to FFZ (WK9110000008), LSK (WK9110000090) and CBZ (WK9110000132). The Youth Fund of Anhui Cancer Hospital granted FFZ and LSK, respectively. The Youth Technical Backbone Fund of the West Branch of the First Affiliated Hospital of USTC granted CBZ and LSK, respectively. The Anhui Provincial Natural Science Foundation of China (No. 2008085MH299) and fundamental Research Funds for the Central Universities (No. WK9110000086) and the Postdoctoral Research Funding of Anhui Province in 2019 (No.2019B371) granted to DBH.
AUTHOR’S CONTRIBUTIONS
Conception and design: YGP and YAT; acquisition of data: YAT, DBH and FFZ; analysis and interpretation of data: LSH, HT, DS, LSK, FFG and FFZ; drafting of the manuscript: YGP and DBH. All authors read and approved the final manuscript.
ETHICAL CONSIDERATIONS
The animal study proposal was approved by the Institutional Animal Care and Use Committee (IACUC) of the University of Science and Technology of China (2021-N(A)-139). All of the mouse experimental procedures were performed in accordance with the Regulations for the Administration of Affairs Concerning Experimental Animals approved by the State Council of People’s Republic of China. Consent for publication is not applicable.
CONFLICT OF INTEREST
YAT, FFZ, CBZ, LSH, HT, DS, LSK, FFG, DBH and YGP have no conflicts of interest to report.
REFERENCES
[1] | Share JB . Review of drug treatment for Down’s syndrome persons. American Journal of Mental Deficiency. (1976) ;80: (4):388–93. |
[2] | Ehrhart IC , Parker PE , Weidner WJ , Dabney JM , Scott JB , Haddy FJ . Coronary vascular and myocardial responses to carotid body stimulation in the dog. The American Journal of Physiology. (1975) ;229: (3):754–60. |
[3] | Stamm O , Latscha U , Janecek P , Campana A . Development of a special electrode for continuous subcutaneous pH measurement in the infant scalp. American Journal of Obstetrics and Gynecology. (1976) ;124: (2):193–5. |
[4] | Bland RD , Clarke TL , Harden LB . Rapid infusion of sodium bicarbonate and albumin into high-risk premature infants soon after birth: a controlled, prospective trial. American Journal of Obstetrics and Gynecology. (1976) ;124: (3):263–7. |
[5] | Lv L , Deng H , Li Y , Zhang C , Liu X , Liu Q , Zhang D , Wang L , Pu Y , Zhang H . The DNA methylation-regulated miR-193a-3p dictates the multi-chemoresistance of bladder cancer via repression of SRSF2/PLAU/HIC2 expression. Cell Death & Disease. (2014) ;5: :e1402. |
[6] | Poole-Wilson PA , Langer GA : Effect of pH on ionic exchange and function in rat and rabbit myocardium. The American Journal of Physiology. (1975) ;229: (3):570–81. |
[7] | Ma K , He Y , Zhang H , Fei Q , Niu D , Wang D , Ding X , Xu H , Chen X , Zhu J : DNA methylation-regulated miR-193a-3p dictates resistance of hepatocellular carcinoma to 5-fluorouracil via repression of SRSF2 expression. The Journal of Biological Chemistry. (2012) ;287: (8):5639–49. |
[8] | Moroi K , Sato T . Comparison between procaine and isocarboxazid metabolism in vitro by a liver microsomal amidase-esterase. Biochemical Pharmacology. (1975) ;24: (16):1517–21. |
[9] | Lv L , Li Y , Deng H , Zhang C , Pu Y , Qian L , Xiao J , Zhao W , Liu Q , Zhang D , et al. MiR-193a-3p promotes the multi-chemoresistance of bladder cancer by targeting the HOXC9 gene. Cancer Letters. (2015) ;357: (1):105–13. |
[10] | Deng H , Lv L , Li Y , Zhang C , Meng F , Pu Y , Xiao J , Qian L , Zhao W , Liu Q ,et al. The miR-193a-3p regulated PSEN1 gene suppresses the multi-chemoresistance of bladder cancer. Biochimica et Biophysica Acta. (2015) ;1852: (3):520–8. |
[11] | Tang Z . Effects of human enhancer of filamentation 1 (HEF1) gene on the proliferation, invasion and metastasis of bladder cancer cells. Journal of BUON: Official Journal of the Balkan Union of Oncology. (2018) ;23: (3):782–6. |
[12] | Garcia-Perdomo HA , Usubillaga-Velasquez JP , Zapata-Copete JA , Reis LO . Mutations in CDKN2A and the FGFR3 genes on bladder cancer diagnosis: a systematic review and meta-analysis. World Journal of Urology. (2019) ;37: (10):2001–7. |
[13] | Pu Y , Zhao F , Wang H , Cai W , Gao J , Li Y , Cai S . MiR-34a5p promotes the multi-drug resistance of osteosarcoma by targeting the CD117 gene. Oncotarget 2016. |
[14] | Pu Y , Zhao F , Li Y , Cui M , Wang H , Meng X , Cai S . The miR-34a-5p promotes the multi-chemoresistance of osteosarcoma via repression of the AGTR1 gene. BMC Cancer. (2017) ;17: (1):45. |
[15] | Pu Y , Zhao F , Wang H , Cai S . MiR-34a-5p promotes multi-chemoresistance of osteosarcoma through down-regulation of the DLL1 gene. Scientific Reports. (2017) ;7: :44218. |

