
Quality of Life and Health State Utilities in Bladder Cancer
Abstract
BACKGROUND:
Bladder cancer treatments may variably impact health-related quality of life (QOL).
OBJECTIVE:
To characterize the quality of life of patients with bladder cancer at various time points across the continuum of bladder cancer care from non-muscle-invasive disease to metastatic bladder cancer and develop utility scores to inform cost-effective analyses.
METHODS:
We performed a cross-sectional survey of bladder cancer patients in the Bladder Cancer Advocacy Network Patient Survey Network. Participants were classified into mutually exclusive health states based upon non-muscle invasive (NMIBC), muscle-invasive (MIBC), or metastatic bladder cancer and completed surveys of generic cancer and bladder cancer-specific quality of life, financial toxicity, and work impairment. We constructed generalized linear mixed models to identify patient, clinical, and treatment factors associated with quality of life over time and derived health state utilities.
RESULTS:
Among 911 self-identified patients with bladder cancer, overall QOL scores and function domains were worse among those with advanced cancer. Financial toxicity was similar among non-metastatic disease states. Work and activity impairment increased with advancing disease (13%and 12%among non-recurrent NMIBC to 63%and 31%for metastatic disease respectively; p < 0.01). On multivariable analysis, bowel-related QOL was diminished among patients with MIBC, with urinary symptoms and physical function most diminished among patients with metastatic disease. Patients with metastatic and MIBC experienced worse emotional functioning (p = 0.04; p = 0.048). Health state utilities were calculated, highest among those with non-recurrent NMIBC and lowest among those with metastatic disease.
CONCLUSION:
Generic and bladder cancer-specific QOL diminishes with advancing disease. Health state utility estimates derived from this study can inform shared decision making with patients and may be used to inform future cost-effective analyses.
INTRODUCTION
Bladder cancer ranges from low-risk non-muscle-invasive bladder cancer (NMIBC) which behaves like a chronic disease but requires frequent invasive monitoring, to metastatic bladder cancer which is largely incurable, with 5-year survival rates of 5%[1]. Approximately 75%of patients present with NMIBC; 20%of patients present with muscle-invasive bladder cancer (MIBC); and 5%present with metastatic disease. Patients with bladder cancer experience an array of potential cancer trajectories including some who never had a recurrence and those who progress to MIBC and metastatic bladder cancer. Various bladder cancer treatments include intravesical therapies like Bacillus Calmette-Guerin (BCG) for NMIBC, radical cystectomy or chemoradiation for MIBC, and systemic chemotherapy or immunotherapy for metastatic bladder cancer. These treatments may variably impact health-related quality of life (QOL). Beyond treatment, the surveillance of patients with NMIBC or some patients with MIBC who undergo chemoradiation requires periodic invasive monitoring with office cystoscopy which may further impact QOL.
Understanding the expected QOL outcomes for patients of various stages of bladder cancer can inform the clinical care of patients by enunciating expected outcomes at various time points in the trajectory of a patient’s bladder cancer. Understanding the impact of bladder cancer treatments on patient-centered outcomes beyond cancer recurrence and survival would inform treatment decision-making, could be used to populate health economic models that evaluate the cost utility of different bladder cancer treatment and surveillance strategies, and could inform clinical trial design. Finally, by assessing QOL across the spectrum of bladder cancer care, these results may elucidate gaps in our knowledge of bladder cancer care. This might inform novel patient-centered outcomes research to improve the care and outcomes of men and women with bladder cancer.
Therefore, our primary objective was to obtain estimates for bladder cancer-specific QOL for patients with NMIBC, MIBC, and metastatic bladder cancer. Secondary objectives for this study were to evaluate the impact of stage of bladder cancer on financial burden and work disability of patients and to characterize patient-reported health state utilities for various bladder cancer health states. We hypothesized that QOL and health state utilities would decrease among patients with more advanced bladder cancer.
METHODS
Study design and participants
A cross-sectional online survey was administered among self-identified patients with bladder cancer recruited from the Bladder Cancer Advocacy Network (BCAN) Patient Survey Network (PSN) (n = 980). Inclusion criteria were self-identified patients with bladder cancer who were able to read and write in English and consent to an online survey. The PSN was established using a combination of email, online, print, and word-of-mouth advertisement through BCAN, with the purpose of incorporating patients into the research process through prioritization of important patient-centered research questions [2].
For recruitment, we sent an email to PSN participants in May 2019. We also posted the survey on the Inspire bladder cancer forum, the largest online support forum for patients and caregivers with bladder cancer [3]. Two reminders were sent, and the survey was closed on June 7, 2019. Participants were asked to provide online consent prior to answering questions. Two subsequent reminders were sent. The study was exempt from the Institutional Review Board at the University of North Carolina at Chapel Hill.
Survey measures
Patients were queried regarding demographics (e.g. age, sex, race, marital status, household income, education), bladder cancer characteristics (highest stage diagnosed, treatments received, cancer recurrence, time since diagnosis and treatment), validated QOL measures, financial toxicity, and work productivity and activity impairment.
Generic cancer-related QOL was measured using the EORTC QLQ-C30 [4], which assesses health-related QOL of cancer patients through five functional scales (physical, role, cognitive, emotional and social), three symptom scales (fatigue, pain, nausea and vomiting), a global health status/QOL scale, and six single items assessing additional symptoms. Responses are scored from 0 to 100, with a higher score for global health status or functional scale representing a higher level of functioning or QOL, and a higher symptom score indicating a higher level of symptomatology or problems. Score differences of 10 points or more between patient subgroups are considered to be clinically relevant [5].
We measured bladder cancer-specific QOL with the Bladder Cancer Index (BCI), which consists of 57 questions grouped into urinary, sexual and bowel domains [6]. Each domain consists of a summary score which is further stratified into function and bother subdomains. Responses for each domain are standardized to a 0 to 100 scale, with higher scores indicating better function and less bother.
Financial toxicity was measured using the 11-item Comprehensive Score for financial Toxicity (COST) questionnaire [7]. COST scores range from 0 to 44, with lower scores representing worse financial toxicity.
Work Productivity and Activity Impairment (WPAI) was measured using the WPAI Questionnaire: General Health v2.0 (WPAI:GH) in which responses are expressed as impairment percentages, with higher numbers indicating greater impairment and less productivity (i.e., worse outcomes) [8].
Health states and utilities
Four mutually exclusive health states were identified based on respondents’ self-reported highest stage and subsequent treatments. Non-recurrent NMIBC included patients for whom NMIBC had never recurred. Recurrent NMIBC included patients for whom the cancer recurred but did not progress. MIBC, and metastatic bladder cancer included pa-tients in whom bladder cancer had spread outside of the bladder. Health state utilities were derived using a validated algorithm to derive cancer-specific utilities using the EORTC QLQ-C30, using the recommended Model 2 which provides specified coefficients to perform the conversion [9]. We stratified analyses of utilities by a priori selected clinically-important subgroups beyond the above-stated health states.
Statistical analysis
Descriptive statistics were used to summarize the demographic and clinical characteristics of our study sample. To evaluate cancer and disease-specific health-related quality of life measured with the EORTC QLQ-C30 and BCI, we used generalized linear mixed models, accounting for differential time since treatment and treatment type.
We identified important covariate categories a priori. Covariates included age (< 70 vs. ≥70 years), gender (male vs. female), time since treatment (< 1 year, 1–5 years, >5 years), race (white vs. non-white), education (college graduate vs. less than college), income (< $40K, $40–100K, > $100K), marital status (partner vs. no partner), insurance (private, government [e.g., Medicare, VA], none), and comorbidities (0–1 vs. 2+).
We used descriptive statistics and generalized linear mixed models to calculate unadjusted and adjusted patient-reported generic and bladder cancer-specific QOL, financial toxicity, and work and activity impairment over time. Utilities were calculated according to the algorithm noted above. P-values < 0.05 were considered statistically significant. All statistical analyses were conducted using SAS v.9.4 (Cary, NC).
RESULTS
Sample characteristics
Across the US, 972 self-identified bladder cancer patients completed the survey, 911 of whom indicated their bladder cancer health state. Among respondents, 243 responded from the PSN and 903 responded from Inspire. Survey respondents were more likely to be male, white, non-Hispanic, well educated, privately insured and married (Appendix Table 1). No clinically significant differences in sociodemographic characteristics were noted across bladder cancer health states with the exception of education, for which patients with advanced disease were more likely to report lower education levels (p = 0.03). Among patients with MIBC and metastatic cancer, 19%and 27%, respectively, presented with NMIBC and subsequently progressed to more advanced bladder cancer. Patients across disease states underwent a variety of treatments ranging from intravesical treatments to radical cystectomy (of whom 12%underwent neobladder) and chemotherapy, all of which varied by time since treatment and recurrence (Appendix Table 2).
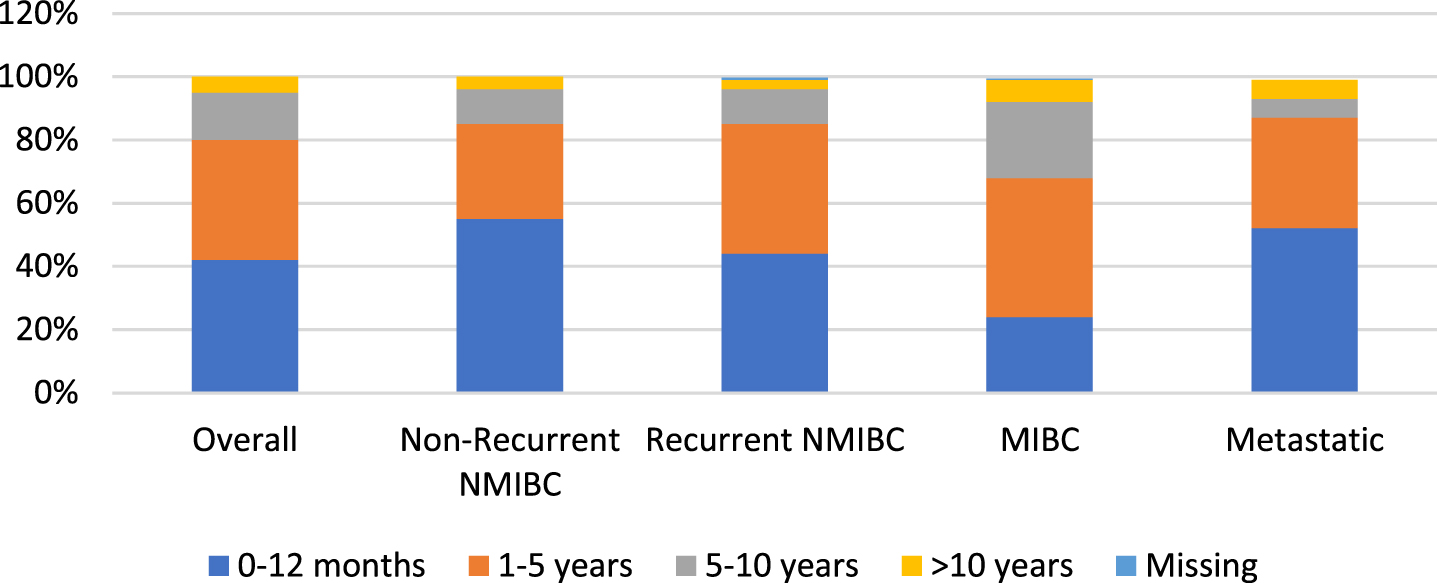
To gain a better understanding of disease and treatment patterns, we evaluated time since first diagnosis (Figure 1) and time since last treatment (Fig. 2). For most respondents across each disease state, time since first diagnosis was within the first 5 years. A higher proportion of patients with recurrent NMIBC and MIBC reported a time since first diagnosis between 1–5 years (rather than 0–12 months) when compared to patients with non-recurrent NMIBC and metastatic disease.
Fig. 1
Time since first diagnosis by bladder cancer health state.
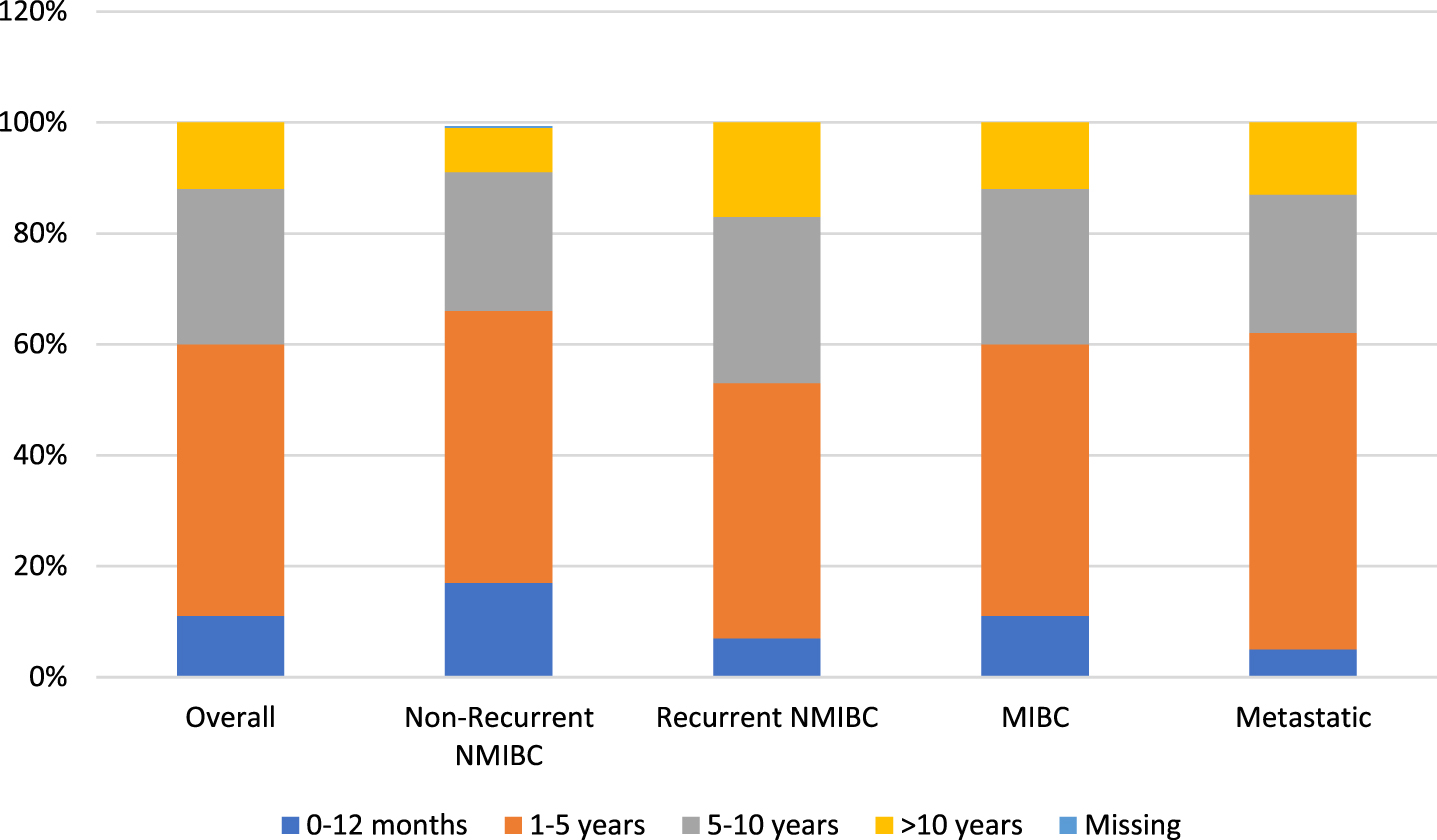
Fig. 2
Time since last treatment by bladder cancer health state.
Patient-reported outcomes by health state
Patients with missing EORTC QLQ-C30 data were more likely to have lower levels of education (p = 0.03), lower annual household income (p < 0.01), live in the South or Midwest, and they were older (p = 0.01) (Appendix Table 3). Patients with missing BCI data were more likely to be located in the South and West (p < 0.01) (Appendix Table 4).
Mean EORTC-QLQ-C30 scores are displayed in Table 2. Overall QOL scores and functioning domains worsened as patient cancer health states advanced from NMIBC to MIBC to metastatic bladder cancer. Likewise, the majority of cancer-related symptoms such as fatigue and nausea/vomiting were worse among patients with more advanced bladder cancers. Pain scores were lowest among patients with non-recurrent NMIBC, with similar pain scores among those with recurrent NMIBC and MIBC. Patients with metastatic bladder cancer had the highest pain scores.
To assess differences in bladder cancer-specific QOL, mean BCI scores were evaluated in the overall cohort and within different health states (Table 1). Urinary, bowel and sexual summary scores, based on both function and bother subdomains, all significantly decreased with advancing disease, consistent with worse bladder cancer-specific QOL.
Table 1
Patient Reported Outcomes by Health State
| Overall (n = 911) | Non-Recurrent NMIBC (n = 306) | Recurrent NMIBC (n = 272) | MIBC (n = 270) | Metastatic Bladder Cancer (n = 63) | p-value | |
| EORTC QLQC30 (n = 871), mean (SD) [median] | 85.0 (12.1) [87.8] | 87.2 (11.3) [89.7] | 85.7 (11.1) [88.0] | 83.3 (12.9) [85.0] | 78.4 (13.4) [79.3] | < 0.0001 |
| Global health status/QOL | 73.0 (19.7) [75] | 75.1 (18.5) [83.3] | 72.8 (20.0) [75.0] | 72.8 (19.4) [75.0] | 64.3 (23.7) [66.7] | 0.01 |
| Physical functioning | 82.2 (21.8) [100] | 84.2 (20.9) [100.0] | 83.7 (21.7) [100.0] | 80.5 (21.0) [80.0] | 72.8 (65.6) [80.0] | 0.003 |
| Role functioning | 85.6 (22.6) [100] | 88.5 (21.2) [100.0] | 85.5 (24.1) [100.0] | 85.2 (20.3) [100.0] | 74.4 (67.4) [83.3] | < 0.0001 |
| Emotional functioning | 78.5 (21.1) [83.3] | 85.3 (16.4) [83.3] | 83.3 (19.2) [83.3] | 82.6 (17.3) [83.3] | 81.7 (19.3) [83.3] | 0.12 |
| Cognitive functioning | 83.6 (17.8) [83.3] | 85.3 (16.4) [83.3] | 83.3 (19.2) [83.3] | 82.6 (17.3) [83.3] | 81.7 (76.7) [83.3] | 0.26 |
| Social functioning | 78.5 (24.1) [83.3] | 84.4 (20.3) [100.0] | 78.6 (24.0) [83.3] | 76.1 (23.6) [83.3] | 60.6 (32.0) [66.7] | < 0.0001 |
| Fatigue | 24.3 (21.6) [22.2] | 20.3 (19.9) [11.1] | 23.9 (21.6) [22.2] | 26.8 (20.9) [22.2] | 34.8 (27.2) [33.3] | < 0.0001 |
| Nausea and vomiting | 4.5 (11.8) [0] | 2.8 (7.9) [0.0] | 3.5 (9.8) [0.0] | 5.9 (14.2) [0.0] | 10.3 (19.2) [0.0] | < 0.0001 |
| Pain | 17.0 (23.2) [0] | 14.0 (21.2) [0] | 18.4 (24.1) [0.0] | 16.3 (22.4) [0] | 28.3 (28.2) [16.7] | 0.0003 |
| Dyspnea | 12.5 (22.4) [0] | 12.5 (23.0) [0] | 9.9 (20.5) [0] | 14.0 (22.6) [0] | 17.2 (25.2) [0] | 0.02 |
| Insomnia | 28.3 (28.9) [33.3] | 24.7 (27.5) [33.3] | 30.3 (29.0) [33.3] | 29.5 (30.1) [33.3] | 31.7 (29.1) [33.3] | 0.07 |
| Appetite loss | 8.4 (18.9) [0] | 6.4 (16.6) [0] | 6.2 (16.7) [0] | 11.3 (20.7) [0] | 14.4 (26.3) [0] | 0.0002 |
| Constipation | 15.0 (24.0) [0] | 12.2 (21.9) [0] | 14.3 (24.1) [0] | 17.4 (25.1) [0] | 20.6 (26.8) [0] | 0.02 |
| Diarrhea | 9.4 (19.6) [0] | 7.3 (17.3) [0] | 9.4 (20.1) [0] | 11.6 (21.0) [0] | 10.7 (20.0) [0] | 0.06 |
| Financial difficulties | 15.4 (25.8) [0] | 11.4 (22.9) [0] | 16.0 (27.4) [0] | 17.7 (25.6) [0] | 21.2 (29.3) [0] | 0.001 |
| BCI, mean (SD) [median] | ||||||
| Urinary Summary Score (n = 823): | 85.4 (15.9) [90.3] | 89.0 (13.8) [93.8] | 86.7 (14.8) [91.7] | 81.9 (17.3) [87.5] | 78.8 (17.9) [82.7] | < 0.0001 |
| Function | 80.7 (24.8) [91.8] | 84.1 (22.3) [100.0] | 82.2 (24.0) [95.9] | 76.1 (27.5) [83.5] | 76.5 (24.5) [83.5] | 0.005 |
| Bother | 87.8 (14.7) [93.8] | 91.4 (12.7) [96.9] | 88.8 (13.8) [93.7] | 84.9 (15.4) [90.6] | 79.3 (18.3) [84.4] | < 0.0001 |
| Bowel Summary Score (n = 833) | 59.7 (11.5) [63] | 61.8 (10.5) [65.5] | 59.7 (11.4) [63] | 58 (12.3) [60.6] | 57.2 (11.5) [58.6] | 0.0006 |
| Function | 43.1 (10.9) [50.5] | 44.7 (9.3) [50.5] | 43.1 (11.4) [50.5] | 41.8 (11.6) [44.7] | 41.8 (11.6) [44.7] | 0.06 |
| Bother | 70.9 (14.0) [75.2] | 73.4 (12.8) [79.3] | 70.8 (13.8) [75.2] | 68.8 (14.8) [71.2] | 68.0 (14.5) [71] | 0.001 |
| Sexual Summary Score (n = 756) | 47.3 (25.4) [46.5] | 53.3 (24.8) [54.5] | 49.9 (26.3) [48.6] | 41.3 (23.8) [40] | 34.3 (20.4) [35.8] | < 0.0001 |
| Function | 37.2 (27.6) [35.7] | 41.8 (28.0) [42.3] | 41.0 (28.0) [40.4] | 31.6 (25.8) [26.1] | 22.2 (23.0) [16.1] | < 0.0001 |
| Bother | 61.6 (29.3) [60.0] | 69.3 (27.7) [75] | 62.4 (29.7) [65] | 54.9 (28.7) [50] | 51.2 (28.5) [50] | < 0.0001 |
| COST, mean (SD) [median] (n = 812) | 13.8 (10.1) [12] | 13.1 (9.7) [12] | 13.6 (10.5) [12] | 14.0 (9.9) [12] | 16.6 (10.8) [14] | 0.18 |
| Work Productivity and Activity Impairment (WPAI), %, mean (SD) [median] (n =) | ||||||
| Absenteeism, % | 7.3 (19.0) [0] | 3.1 (8.3) [0] | 5.1 (14.4) [0] | 11.1 (25.5) [0] | 35.0 (31.1) [36.2] | 0.02 |
| Presenteesism, % | 14.0 (20.2) [0] | 10.8 (17.2) [0] | 11.5 (18.0) [0] | 16.4 (21.6) [10] | 51.7 (21.4) [50] | 0.0009 |
| Total work impairment (TWI), % | 17.5 (24.4) [10] | 13.4 (19.4) [8.75] | 15.7 (23.0) [0] | 19.6 (26.2) [10] | 63.2 (28.4) [67.8] | 0.0035 |
| Total activity impairment (TAI), % | 16.9 (25.0) [0] | 11.6 (20.7) [0] | 16.4 (24.2) [0] | 20.1 (26.5) [10] | 31.3 (32.2) [20] | < 0.0001 |
With respect to financial toxicity, mean COST was similar among non-metastatic disease states with higher values representing less financial toxicity reported by patients with metastatic disease, but these differences were not statistically significant. Work and activity impairment increased with advancing disease, although notably only 31%of respondents reported working full time. Work impairment increased from 13%for non-recurrent NMIBC to 63%for metastatic bladder cancer (p = 0.003). Likewise, activity impairment increased from 12%for non-recurrent NMIBC to 31%for metastatic bladder cancer (p < 0.001).
Multivariable analysis was performed to evaluate the independent impact of health state on QOL (Table 2). Health state was associated with QOL. For example, bowel-related QOL was diminished among patients with MIBC (p = 0.01) compared with other health states; urinary symptoms and physical function were most diminished among patients with metastatic disease (p = 0.047) compared with other health states. Patients with metastatic and MIBC experienced worse emotional functioning compared with patients with NMIBC (p = 0.04, p = 0.048, respectively).
Table 2
Multivariable Models for QOL by Health State
| Model | Outcome | Variable | Estimate | p-value | |
| 1 | EORTC Summary Score | Health State (Ref: Non-recurrent NMIBC) | Recurrent NMIBC | –1.3 | 0.25 |
| MIBC | –4.1 | 0.002 | |||
| Metastatic | –6.5 | 0.002 | |||
| Treatment (Ref: Conservative) | Cystectomy | 0.29 | 0.8825 | ||
| Time Since Treatment (Ref: < 1 year) | > 1 year | 3 | 0.0016 | ||
| 2 | EORTC Emotional Functioning | Health State (Ref: Non-recurrent NMIBC) | Recurrent NMIBC | –1.9 | 0.31 |
| MIBC | –4.7 | 0.04 | |||
| Metastatic | –6.8 | 0.048 | |||
| Treatment (Ref: Conservative) | Cystectomy | 4.3 | 0.03 | ||
| Time Since Treatment (Ref: < 1 year) | > 1 year | 4.1 | 0.01 | ||
| 3 | EORTC Physical Functioning | Health State (Ref: Non-recurrent NMIBC) | Recurrent NMIBC | –1.5 | 0.48 |
| MIBC | –4.1 | 0.11 | |||
| Metastatic | –8.1 | 0.03 | |||
| Treatment (Ref: Conservative) | Cystectomy | –1.5 | 0.49 | ||
| Time Since Treatment (Ref: < 1 year) | > 1 year | 4.6 | 0.009 | ||
| 4 | BCI Urinary Summary Score | Health State (Ref: Non-recurrent NMIBC) | Recurrent NMIBC | –0.9 | 0.55 |
| MIBC | –3.2 | 0.07 | |||
| Metastatic | –5.3 | 0.047 | |||
| Treatment (Ref: Conservative) | Cystectomy | –5.1 | 0.008 | ||
| Time Since Treatment (Ref: < 1 year) | > 1 year | 2.9 | 0.01 | ||
| 5 | BCI Sexual Summary Score | Health State (Ref: Non-recurrent NMIBC) | Recurrent NMIBC | –0.6 | 0.79 |
| MIBC | –2.8 | 0.33 | |||
| Metastatic | –10.9 | 0.01 | |||
| Treatment (Ref: Conservative) | Cystectomy | –11.7 | < 0.001 | ||
| Time Since Treatment (Ref: < 1 year) | > 1 year | 4 | 0.047 | ||
| 6 | BCI Bowel Summary Score | Health State (Ref: Non-recurrent NMIBC) | Recurrent NMIBC | –1.5 | 0.16 |
| MIBC | –3.3 | 0.01 | |||
| Metastatic | –2.5 | 0.19 | |||
| Treatment (Ref: Conservative) | Cystectomy | –0.4 | 0.7 | ||
| Time Since Treatment (Ref: < 1 year) | > 1 year | 1 | 0.29 |
*Model adjusted for additional covariates: age, gender, partner status, insurance, income, education, and time since treatment.
Finally, health state utilities were calculated for each health state (Table 3). Cancer-specific utilities were highest among those with non-recurrent NMIBC and lowest among those with metastatic bladder cancer.
Table 3
Utility Scores by Bladder Cancer Health State
| EORTC QLQ-C30 | ||||
| Health States | No. obs | Patient Count | Mean | (SD) |
| All health states | ||||
| Non-recurrent non-muscle-invasive bladder cancer (NMIBC) | 306 | 202 | 0.85 | 0.18 |
| Recurrent NMIBC | 272 | 198 | 0.8 | 0.21 |
| Muscle invasive bladder cancer (MIBC) | 270 | 180 | 0.78 | 0.2 |
| Metastatic Bladder Cancer | 63 | 40 | 0.68 | 0.29 |
DISCUSSION
We characterized QOL and health state utilities across bladder cancer health states ranging from non-recurrent NMIBC to metastatic bladder cancer. We found that cancer- and disease-specific QOL, including urinary, bowel and sexual function worsened among patients with more advanced stages of bladder cancer, such as MIBC and metastatic bladder cancer. To some extent, this varied by QOL domain. Similarly, work and activity impairment worsened as we examined patients with later stages of bladder cancer. Health state utilities were also worst among metastatic bladder cancer patients.
Our study is unique by measuring disease states across the bladder cancer spectrum, while also including multiple instruments to compare and contrast the impact of disease on various aspects of QOL (e.g. general cancer, bladder cancer-specific, financial toxicity, and work/activity impairment). Most studies have narrowly focused on specific bladder cancer states and QOL domains, such as the impact of intravesical therapy on urinary QOL [10], or bladder cancer-specific QOL differences between men and women undergoing radical cystectomy [11]. Nonetheless, a few large studies have evaluated QOL across the spectrum of bladder cancer. In a sample of approximately 800 bladder cancer patients undergoing inpatient rehabilitation, EORTC QLQ-C30 was measured and compared with a representative community sample [12]. Patients with both NMIBC and MIBC had similar QOL, but were found to have significantly more problems and worse functioning than the general population. Another cross-sectional study of 1,796 patients with bladder cancer in the UK was recently published, demonstrating worse function and symptom scores with age [13].
Furthermore, differences in QOL across health states appeared to be related to the burdens of the treatments received and time since treatment more than bladder cancer health state, with patients undergoing radical cystectomy reporting more fatigue, appetite loss and decreased role functioning, detriments in QOL that appeared to improve with time.
On multivariable analysis, differences in QOL were not demonstrated between non-recurrent and recurrent NMIBC. A prior study evaluating QOL among patients with NMIBC characterized pain levels among NMIBC patients but did not differentiate by recurrence status. Our study suggests that pain levels may differ between these different and important subgroups and are important to better understand when patients and providers engage in shared decision-making for treatment choices, particularly those who are choosing between radical cystectomy and bladder-conserving therapy for BCG-refractory NMIBC, for which treatment may also be driven by symptomatology.
Interestingly, treatment type had a less substantial impact on cancer-specific QOL. The lone exception was our finding that patients who have undergone radical cystectomy experienced improved emotional functioning compared with those who underwent bladder-conserving therapy. These findings differ from prior studies, wherein radical cystectomy appears to drive worse emotional functioning. Differences in our study conclusions may stem from differences in study populations, including prior studies that evaluated patients in rehabilitation centers which may be related to recovery from surgical complications [12]. Worse emotional functioning among patients undergoing bladder-conserving therapy may relate to fear and/or anxiety regarding disease recurrence and frequent surveillance for patients with NMIBC.
Although cancer-specific QOL did not appear to be largely influenced by bladder cancer health state, our study did demonstrate that patients with metastatic disease were more likely to have significantly diminished urinary and sexual function scores. Treatment was associated with urinary and sexual (but not bowel) function, both diminished among patients who underwent radical cystectomy. These findings align with prior studies, including the original study describing the BCI in which disease-specific HRQOL decrements were noted among those undergoing radical cystectomy compared with those who retained their bladders [14]. That study acknowledged the limitation that they did not assess the impact of time since treatment, which we found impacted cancer-specific QOL. Those who were more than a year out from treatment experienced improved urinary and sexual summary scores, representing an improvement in either function, bother, or both. Interestingly, a sub-analysis of multivariable analyses separately evaluating urinary function and bother domains revealed that these findings are largely driven by improvements in urinary bother and sexual function.
In addition to QOL, we also investigated financial toxicity and work/activity impairment. We found that health state did not significantly impact COST scores. Unfortunately, financial toxicity has not yet been widely studied among bladder cancer patients. A small single institution study of 138 patients found that patients with NMIBC were more likely to report financial toxicity, but this was not significant on multivariable analysis, aligning with the conclusions of our study [15]. In a large cross-sectional cohort, Catto et al did not a higher rate of financial toxicity among younger patients [13]. Work and activity impairments have been even less studied. The only known study evaluating WPAI among urological patients assessed the work impairment of overactive bladder and included a small sample of those with bladder cancer [16]. In this study, more severe lower urinary tract symptoms were associated with significant worsening of work impairment due to health. We found that patients with metastatic disease reported significantly worse work and activity impairment than those with localized bladder cancer. However, these results are limited by a disproportionate number of respondents (30%) reporting full time work. Regardless, a better understanding of these productive impacts can be useful for expectation setting by providers during counseling sessions.
Finally, our study was designed to derive health-state utilities that could be used for future cost-utility analyses. Utilities can be used to estimate quality-adjusted life expectancy, with a utility of 1 representing perfect health and death assigned a value of 0. Prior decision analytic studies in bladder cancer have extrapolated utilities from other disease states such as breast cancer [17]. The utilities calculated from our study derived from the EORTC QLQ-C30 [9]. As hypothesized, cancer-specific utilities were lower among patients with more advanced stages of bladder cancer.
The findings of our study should be interpreted within the context of several limitations. First, the cross-sectional study design does not allow assessment of longitudinal changes in QOL among bladder cancer patients. Second, the survey was conducted using the BCAN Patient Survey Network and Inspire, a selective group of engaged patients with bladder cancer with higher levels of education and income, and which lacks racial and ethnic diversity. The selective sample population may limit the generalizability of our findings. Third, our study survey had missing data that did vary by patient characteristics and which may influence analytic findings. However, the degree of missingness was small and the impact of these missing data on our overall study findings is likely small.
Despite these limitations, our study provides a cross-sectional view of bladder cancer patients with varying health states and contributes informative health state utilities. Generic cancer and bladder cancer-specific QOL diminishes as we assess patients with NMIBC, MIBC, and metastatic bladder cancer. Time is an important modifier, as these QOL detriments diminish with time. These QOL and health state utility estimates can inform shared decision-making with patients and may be used to populate future cost-utility analyses. Novel data on financial toxicity and work impairment can inform discussions that potentially focus on more patient-centered considerations.
ACKNOWLEDGMENTS
The authors thank the research participants of the BCAN PSN for participating in the online survey and for their important contributions that have made the study possible. The authors also thank the research patient advocates who participated in the conception and design of the BCAN quality of life and utility survey.
FUNDING
This project was funded by a Bladder Cancer Advocacy Network Patient Survey Network Grant.
AUTHOR CONTRIBUTIONS
Smith, Gore contributed to the conceptualization, writing, review/editing, visualization, and super-vision of the project. Smith, McCabe, Deal contributed to the software, validation, formal analysis, investigation, resources, data curation, and project administration. Gessner, Lipman contributed to conceptualization, review-editing, supervision of the project. Smith, Chisolm, Guo, Gore contributed to funding acquisition.
CONFLICT OF INTEREST
Angela Smith has funding from PCORI and BCAN and is a consultant for Merck, Fergene, Ambu, and Urogen. Amy Guo is a Senior Director at Fergene. Sean McCabe, Allison Deal, Stephanie Chisolm, Lauren Ahlschlager, Kathryn Gessner, John Gore, Robert Lipman have nothing to disclose.
Angela Smith is an Associate Editor and John Gore is an Editorial Board member of this journal, but they were not involved in the peer-review process nor had access to any information regarding its peer-review.
REFERENCES
[1] | American Cancer Society. Survival Rates for Bladder Cancer. https://www-cancer-org/cancer/bladder-cancer/detection-diagnosis-staging/survival-rates.html. Accessed June 2, 2020. |
[2] | Smith AB , Chisolm S , Deal A , et al. Patient-centered prioritization of bladder cancer research. Cancer. (2018) ;124: (15):3136–3144. doi: 10.1002/cncr.31530 |
[3] | Bladder Cancer Advocacy Network Support Group & Forum - Inspire. https://www.inspire.com/groups/bladder-cancer-advocacy-network/. Accessed June 2, 2020. |
[4] | Aaronson NK , Ahmedzai S , Bergman B , et al. The European Organization for Research and Treatment of Cancer QLQ-C a quality-of-life instrument for use in international clinical trials in oncology. J Natl Cancer Inst. (1993) ;85: (5):365–376. doi: 10.1093/jnci/85.5.365 |
[5] | King MT . The interpretation of scores from the EORTC quality of life questionnaire QLQ-C30. Qual Life Res. (1996) ;5: (6):555–567. doi: 10.1007/BF00439229 |
[6] | Gilbert SM , Dunn RL , Hollenbeck BK , et al. Development and validation of the Bladder Cancer Index: a comprehensive, disease specific measure of health related quality of life in patients with localized bladder cancer. J Urol. (2010) ;183: (5):1764–1769. doi: 10.1016/j.juro.2010.01.013 |
[7] | de Souza JA , Yap BJ , Wroblewski K , et al. Measuring financial toxicity as a clinically relevant patient-reported outcome: The validation of the COmprehensive Score for financial Toxicity (COST). Cancer. (2017) ;123: (3):476–484. doi: 10.1002/cncr.30369 |
[8] | Reilly MC , Zbrozek AS , Dukes EM . The validity and reproducibility of a work productivity and activity impairment instrument. Pharmacoeconomics. (1993) ;4: (5):353–365. doi: 10.2165/00019053-199304050-00006 |
[9] | McTaggart-Cowan H , King MT , Norman R , et al. The EORTC QLU-C10D: The Canadian Valuation Study and Algorithm to Derive Cancer-Specific Utilities From the EORTC QLQ-C30. MDM Policy Pract. (2019) ;4: :2381468319842532. |
[10] | Siracusano S , Silvestri T , Bassi S , et al. Health-related quality of life after BCG or MMC induction for non-muscle invasive bladder cancer. Can J Urol. (2018) ;25: (5):9480–9485. |
[11] | Siracusano S , D’Elia C , Cerruto MA , et al. Quality of Life in Patients with Bladder Cancer Undergoing Ileal Conduit: A Comparison of Women Versus Men. In Vivo. (2018) ;32: (1):139–143. doi: 10.21873/invivo.11216 |
[12] | Singer S , Ziegler C , Schwalenberg T , Hinz A , Götze H , Schulte T . Quality of life in patients with muscle invasive and non-muscle invasive bladder cancer. Support Care Cancer. (2013) ;21: (5):1383–1393. doi: 10.1007/s00520-012-1680-8 |
[13] | Catto JWF , Downing A , Mason S , et al. Quality of Life After Bladder Cancer: A Cross-sectional Survey of Patient-reported Outcomes. Eur Urol. (2021) ;79: :621–32. |
[14] | Gilbert SM , Wood DP , Dunn RL , et al. Measuring health-related quality of life outcomes in bladder cancer patients using the Bladder Cancer Index (BCI). Cancer. (2007) ;109: (9):1756–1762. doi: 10.1002/cncr.22556 |
[15] | Casilla-Lennon MM , Choi SK , Deal AM , et al. Financial Toxicity among Patients with Bladder Cancer: Reasons for Delay in Care and Effect on Quality of Life. J Urol. (2018) ;199: (5):1166–1173. doi: 10.1016/j.juro.2017.10.049 |
[16] | Coyne KS , Sexton CC , Irwin DE , Kopp ZS , Kelleher CJ , Milsom I . The impact of overactive bladder, incontinence and other lower urinary tract symptoms on quality of life, work productivity, sexuality and emotional well-being in men and women: results from the EPIC study. BJU Int. (2008) ;101: (11):1388–1395. doi: 10.1111/j.1464-410X.2008.07601.x |
[17] | Kulkarni GS , Finelli A , Fleshner NE , Jewett MAS , Lopushinsky SR , Alibhai SMH . Optimal management of high-risk T1G3 bladder cancer: a decision analysis. PLoS Med. (2007) ;4: (9):e284. doi: 10.1371/journal.pmed.0040284 |
Appendices
Appendix
Table 1A
Summary of Patient Characteristics
| Overall (N = 911) | Non-recurrent NMIBC (N = 306) | Recurrent NMIBC (N = 272) | MIBC (N = 270) | Metastatic bladder cancer (n = 63) | p-value | |
| Age | 67.6 (8.7) [68] | 68.3 (9.0) [69] | 66.7 (8.4) [68] | 67.4 (8.8) [67] | 68.5 (7.9) [68.5] | 0.09 |
| Gender, N (%) | ||||||
| Male | 468 (51%) | 166 (54%) | 127 (47%) | 146 (54%) | 29 (46%) | 0.16 |
| Female | 320 (35%) | 93 (30%) | 112 (41%) | 91 (34%) | 24 (38%) | 0.06 |
| Missing | 123 (14%) | 47 (15%) | 33 (12%) | 33 (12%) | 10 (16%) | |
| Race, N (%) | 0.8 | |||||
| White/Caucasian | 772 (79%) | 244 (80%) | 229 (84%) | 226 (84%) | 53 (84%) | |
| Black or African American | 12 (1%) | 6 (2%) | 2 (0.7%) | 3 (1%) | 0 | |
| American Indian or Alaska Native | 3 (0.3%) | 2 (0.6%) | 1 (0.4%) | 0 | 0 | |
| Asian | 9 (0.9%) | 2 (0.6%) | 2 (0.7%) | 4 (1.5%) | 0 | |
| Native Hawaiian or Pacific Islander | 0 (0%) | 1 (0.3%) | 0 | 0 | 0 | |
| Missing | 175 (18%) | 51 (17%) | 38 (14%) | 37 (14%) | 10 (16%) | |
| Ethnicity, N (%) | ||||||
| Hispanic | 16 (2%) | 5 (1.6%) | 5 (2%) | 6 (2%) | 0 | 0.57 |
| Non-Hispanic | 748 (82%) | 247 (81%) | 225 (83%) | 227 (84%) | 49 (78%) | |
| Missing | 147 (16%) | 54 (18%) | 42 (15%) | 37 (14%) | 14 (22%) | |
| Region of current residence, N (%) | 0.21 | |||||
| Northeast | 159 (17%) | 44 (14%) | 59 (22%) | 47 (17%) | 9 (14%) | |
| Midwest | 160 (18%) | 52 (17%) | 42 (15%) | 56 (21%) | 10 (16%) | |
| South | 233 (26%) | 86 (28%) | 76 (28%) | 58 (21%) | 13 (21%) | |
| West | 173 (19%) | 60 (20%) | 43 (16%) | 57 (21%) | 13 (21%) | |
| Missing | 186 (20%) | 64 (21%) | 52 (19%) | 52 (19%) | 18 (29%) | |
| Highest level of formal education, N (%) | ||||||
| 8th grade or less | 1 (0%) | 0 | 0 | 0 | 1 (2%) | 0.03 |
| Some high school | 2 (0%) | 1 (0.3%) | 0 | 0 | 1 (2%) | |
| High school graduate | 55 (6%) | 16 (5%) | 16 (6%) | 17 (6%) | 6 (9%) | |
| Some college (did not complete) | 199 (22%) | 61 (20%) | 63 (23%) | 62 (23%) | 13 (21%) | |
| College graduate | 253 (28%) | 86 (28%) | 67 (25%) | 87 (32%) | 13 (21%) | |
| Post-college degree | 277 (30%) | 95 (31%) | 92 (34%) | 72 (27%) | 18 (29%) | |
| Missing | 124 (14%) | 47 (15%) | 34 (12%) | 32 (12%) | 11 (17%) | |
| Annual household income, N (%) | ||||||
| Less than $20,000 | 29 (3%) | 12 (4%) | 3 (1%) | 12 (4%) | 2 (3%) | 0.33 |
| Between $20,001 and $40,000 | 82 (9%) | 29 (9%) | 26 (10%) | 22 (8%) | 5 (8%) | |
| Between $40,001 and $60,000 | 106 (12%) | 29 (9%) | 35 (13% | 37 (14%) | 6 (9%) | |
| Between $60,001 and $80,000 | 120 (13%) | 40 (13%) | 34 (12%) | 36 (13%) | 10 (16%) | |
| Between $80,001 and $100,000 | 106 (12%) | 34 (11%) | 24 (9%) | 38 (14%) | 10 (16%) | |
| More than $100,001 | 281 (31%) | 101 (33%) | 95 (35%) | 71 (26%) | 14 (22%) | |
| Missing | 187 (21%) | 62 (20%) | 55 (20%) | 54 (20%) | 16 (25%) | |
| Marital status, N (%) | ||||||
| Married | 594 (65%) | 188 (61%) | 185 (68%) | 186 (69%) | 35 (56%) | 0.2 |
| Unmarried, living with partner | 17 (2%) | 7 (2%) | 6 (2%) | 4 (1%) | 0 | |
| Divorced | 76 (8%) | 26 (8%) | 23 (8%) | 21 (8%) | 6 (10%) | |
| Widowed | 52 (6%) | 17 (6%) | 15 (6%) | 15 (6%) | 5 (8%) | |
| Separated | 6 (1%) | 3 (1%) | 0 | 3 (1%) | 0 | |
| Single, never married | 38 (4%) | 16 (5%) | 5 (2%) | 10 (4%) | 7 (11%) | |
| Missing | 128 (14%) | 49 (16%) | 38 (14%) | 31 (11%) | 10 (16%) | |
| Insurance coverage, N (%) | ||||||
| Commercial insurance | 424 (47%) | 140 (46%) | 130 (48%) | 127 (47%) | 27 (43%) | 0.29 |
| Medicare | 170 (19%) | 69 (22%) | 45 (17%) | 46 (17%) | 10 (16%) | |
| Government | 48 (5%) | 12 (4%) | 12 (4%) | 18 (7%) | 6 (10%) | |
| No insurance | 15 (2%) | 2 (1%) | 4 (1%) | 8 (3%) | 1 (2%) | |
| I don’t know/missing | 254 (28%) | 83 (27%) | 81 (30%) | 71 (26%) | 19 (30%) | |
| Physician specialty, N (%) | ||||||
| General urologist | 316 (35%) | 152 (50%) | 121 (44%) | 39 (14%) | 4 (6%) | < 0.0001 |
| Urologic oncologist | 278 (31%) | 99 (32%) | 94 (35%) | 73 (27%) | 12 (19%) | |
| Multidisciplinary | 165 (18%) | 11 (4%) | 13 (5%) | 111 (41%) | 30 (48%) | |
| Missing | 152 (17%) | 44 (14%) | 44 (16%) | 47 (17%) | 17 (27%) | |
| Number of comorbidities, N (%) | ||||||
| None | 282 (31%) | 85 (28%) | 88 (32%) | 90 (33%) | 19 (30%) | 0.01 |
| 1 | 223 (24%) | 85 (28%) | 54 (20%) | 68 (25%) | 16 (25%) | |
| 2 | 192 (21%) | 54 (20%) | 14 (22%) | |||
| 3 or more | 196 (22%) | 63 (21%) | 65 (24%) | 55 (20%) | 13 (21%) | |
| Missing | 18 (2%) | 14 (5%) | 0 | 3 (1%) | 1 (2%) | |
| First stage of bladder cancer diagnosed, N (%) | ||||||
| Non-invasive cancer | 643 (71%) | 304 (99%) | 270 (99%) | 52 (19%) | 17 (27%) | < 0.0001 |
| Invasive cancer | 234 (26%) | 1 (0.3%) | 2 (0.7%) | 213 (79%) | 18 (29%) | |
| Metastatic cancer | 31 (3%) | 0 | 0 | 3 (1%) | 28 (44%) | |
| I don’t know/missing | 3 (0%) | 1 (0.3%) | 0 | 2 (0.7%) | 0 | |
| Highest stage of bladder cancer diagnosed, N (%) | ||||||
| Non-invasive cancer | 578 (63%) | 306 (100%) | 272 (100%) | 0 | 0 | n/a |
| Invasive cancer | 270 (28%) | 0 | 0 | 270 (100%) | 0 | |
| Metastatic cancer | 63 (7%) | 0 | 0 | 0 | 63 (100%) | |
| I don’t know/missing | 0 | 0 | 0 | 0 | 0 | |
| Kinds of treatments received for bladder, N (%) | ||||||
| TURBT | 710 (78%) | 254 (83%) | 252 (93%) | 162 (60%) | 42 (67%) | n/a |
| Radical cystectomy | 394 (43%) | 36 (12%) | 87 (32%) | 220 (81%) | 51 (81%) | |
| Partial cystectomy | 15 (2%) | 4 (1%) | 2 (0.7%) | 6 (2%) | 3 (5%) | |
| Chemotherapy IV | 227 (25%) | 11 (4%) | 13 (5%) | 156 (58%) | 47 (75%) | |
| Immunotherapy IV | 55 (6%) | 6 (2%) | 10 (4%) | 13 (5%) | 26 (41%) | |
| Radiation therapy | 36 (4%) | 1 (0.3%) | 2 (0.7%) | 24 (9%) | 9 (14%) | |
| Intravesical therapy | 544 (60%) | 224 (73%) | 229 (84%) | 71 (26%) | 20 (32%) | |
| Ureteroscopy w/ biopsy or fulguration | 46 (5%) | 16 (5%) | 20 (7%) | 7 (3%) | 3 (5%) | |
| Nephroureterectomy | 42 (5%) | 8 (3%) | 13 (5%) | 9 (3%) | 12 (19%) | |
| Other | 64 (7%) | 17 (6%) | 12 (19%) |
Table 2A
Treatment Time and Recurrence by Bladder Cancer Health State
| Overall (n =) | Non-Recurrent NMIBC (N =) | Recurrent NMIBC (N =) | MIBC (N =) | Metastatic Bladder Cancer (n =) | |
| Among patients with TURBT, time from TURBT until survey completion, N (%) | |||||
| < 6 months | 113 (16%) | 38 (15%) | 51 (20%) | 19 (12%) | 4 (9%) |
| 6–12 months | 97 (13%) | 35 (14%) | 36 (14%) | 20 (12%) | 6 (14%) |
| 12–18 months | 79 (11%) | 28 (11%) | 28 (11%) | 16 (10%) | 6 (14%) |
| 18–24 months | 54 (7%) | 20 (8%) | 18 (7%) | 13 (8%) | 2 (5%) |
| > 2 years | 360 (50%) | 120 (47%) | 117 (46%) | 92 (57%) | 23 (55%) |
| Missing | 20 (3%) | 13 (5%) | 2 (0.8%) | 2 (1%) | 1 (2%) |
| Among patients with TURBT, cancer recurrence after TURBT treatment, N (%) | |||||
| Yes | 367 (51%) | 91 (56%) | 31 (74%) | ||
| No | 328 (45%) | 241 (95%) | 8 (3%) | 65 (40%) | 7 (17%) |
| Missing | 28 (4%) | 13 (5%) | 3 (1%) | 6 (4%) | 4 (9%) |
| Among patients with radical cystectomy, time from radical cystectomy until survey completion, N (%) | |||||
| < 6 months | 4 (11%) | 4 (11%) | 9 (10%) | 16 (7%) | 3 (6%) |
| 6–12 months | 1 (3%) | 1 (3%) | 6 (7%) | 17 (8%) | 3 (6%) |
| 12–18 months | 3 (8%) | 3 (8%) | 3 (3%) | 17 (8%) | 7 (14%) |
| 18–24 months | 2 (6%) | 2 (6%) | 8 (9%) | 9 (4%) | 6 (12%) |
| > 2 years | 23 (64%) | 23 (64%) | 61 (70%) | 156 (71%) | 31 (61%) |
| Missing | 13 (3%) | 3 (8%) | 0 | 5 (2%) | 1 (2%) |
| Among patients with radical cystectomy, cancer recurrence after radical cystectomy treatment, N (%) | |||||
| Yes | 58 (14%) | 0 | 11 (13%) | 17 (8%) | 29 (57%) |
| No | 346 (83%) | 34 (94%) | 75 (86%) | 198 (90%) | 21 (41%) |
| Missing | 13 (3%) | 2 (6%) | 1 (1%) | 5 (2%) | 1 (2%) |
| Among patients with partial cystectomy, time from partial cystectomy until survey completion, N (%) | |||||
| < 6 months | 3 (17%) | 3 (75%) | 0 | 0 | 0 |
| 6–12 months | 0 | 0 | 0 | 0 | 0 |
| 12–18 months | 3 (17%) | 0 | 0 | 2 (33%) | 1 (33%) |
| 18–24 months | 1 (6%) | 0 | 1 (50%) | 0 | 0 |
| > 2 years | 8 (44%) | 1 (25%) | 1 (50%) | 4 (67%) | 1 (33%) |
| Missing | 3 (17%) | 0 | 0 | 0 | 1 (33%) |
| Among patients with partial cystectomy, cancer recurrence after partial cystectomy treatment, N (%) | |||||
| Yes | 6 (33%) | 0 | 2 (100%) | 2 (33%) | 1 (33%) |
| No | 9 (50%) | 4 (67%) | 1 (33%) | ||
| Missing | 3 (17%) | 0 | 0 | 0 | 1 (33%) |
| Among patients with IV chemotherapy, time from IV chemotherapy until survey completion, N (%) | |||||
| < 6 months | 30 (13%) | 2 (18%) | 3 (23% | 14 (9%) | 11 (23%) |
| 6–12 months | 21 (9%) | 16 (10%) | 5 (11%) | ||
| 12–18 months | 28 (12%) | 1 (9%) | 1 (8%) | 18 (12%) | 6 (13%) |
| 18–24 months | 11 (5% | 1 (9%) | 0 | 7 (4%) | 3 (6%) |
| > 2 years | 142 (60%) | 7 (64%) | 9 (69%) | 99 (63%) | 21 (45%) |
| Missing | 5 (2%) | 0 | 0 | 2 (1%) | 1 (2%) |
| Among patients with IV chemotherapy, cancer recurrence after IV chemotherapy treatment, N (%) | |||||
| Yes | 67 (28%) | 0 | 3 (23% | 35 (22%) | 27 (57%) |
| No | 161 (68%) | 11 (100%) | 10 (77%) | 115 (74%) | 18 (38%) |
| Missing | 9 (4%) | 0 | 0 | 6 (4%) | 2 (4%) |
| Among patients with IV immunotherapy, time from IV immunotherapy until survey completion, N (%) | |||||
| < 6 months | 28 (50%) | 3 (50%) | 5 (50%) | 5 (38%) | 14 (54%) |
| 6–12 months | 7 (12%) | 1 (17%) | 0 | 2 (15%) | 4 (15%) |
| 12–18 months | 6 (11%) | 0 | 1 (10%) | 1 (8%) | 4 (15%) |
| 18–24 months | 2 (4%) | 0 | 1 (10%) | 1 (8%) | 0 |
| > 2 years | 10 (18%) | 2 (33%) | 2 (20%) | 3 (23%) | 3 (12%) |
| Missing | 3 (5%) | 0 | 1 (10%) | 1 (8%) | 1 (4%) |
| Among patients with IV immunotherapy, cancer recurrence after IV immunotherapy treatment, N (%) | |||||
| Yes | 21 (37%) | 0 | 5 (50%) | 5 (38%) | 11 (42%) |
| No | 27 (48%) | 6 (100%) | 3 (30%) | 6 (46%) | 11 (42%) |
| Missing | 8 (14%) | 0 | 2 (20%) | 2 (15%) | 4 (15%) |
| Among patients with radiation therapy, time from radiation therapy until survey completion, N (%) | |||||
| < 6 months | 9 (22%) | 0 | 0 | 7 (29%) | 2 (22%) |
| 6–12 months | 3 (7%) | 0 | 0 | 2 (8%) | 1 (11%) |
| 12–18 months | 8 (20%) | 0 | 0 | 6 (25%) | 2 (22%) |
| 18–24 months | 0 | 0 | 0 | 0 | 0 |
| > 2 years | 18 (44%) | 1 (100%) | 2 (100%) | 9 (37%) | 4 (44%) |
| Missing | 3 (7%) | 0 | 0 | 0 | 0 |
| Among patients with radiation therapy, cancer recurrence after radiation therapy treatment, N (%) | |||||
| Yes | 14 (34%) | 0 | 0 | 9 (37%) | 4 (44%) |
| No | 23 (56%) | 1 (100%) | 2 (100%) | 14 (58%) | 5 (56%) |
| Missing | 4 (10%) | 0 | 0 | 1 (4%) | 0 |
| Among patients with intravesical therapy, time from intravesical therapy until survey completion, N (%) | |||||
| < 6 months | 157 (28%) | 82 (37%) | 61 (27%) | 10 (14%) | 3 (15%) |
| 6–12 months | 86 (15%) | 37 (17%) | 38 (17%) | 9 (13%) | 2 (10%) |
| 12–18 months | 39 (7%) | 17 (8%) | 18 (8%) | 4 (6%) | 0 |
| 18–24 months | 35 (6%) | 14 (6%) | 14 (6%) | 6 (8%) | 0 |
| > 2 years | 215 (39%) | 59 (26%) | 97 (42%) | 38 (54%) | 14 (70%) |
| Missing | 24 (4%) | 15 (7%) | 1 (0.4%) | 4 (6%) | 1 (5%) |
| Among patients with intravesical therapy, cancer recurrence after intravesical therapy treatment, N (%) | |||||
| Yes | 243 (44%) | 0 | 185 (81%) | 43 (61%) | 12 (60%) |
| No | 284 (51%) | 208 (93%) | 42 (18%) | 23 (32%) | 6 (30%) |
| Missing | 29 (5%) | 16 (7%) | 2 (0.9%) | 5 (7%) | 2 (10%) |
| Among patients with intravesical therapy, which type of intravesical therapy received, N (%) | |||||
| BCG | 328 (34%) | 141 (46%) | 129 (47%) | 42 (16%) | 10 (16%) |
| BCG with chemo | 132 (14%) | 41 (13%) | 66 (24%) | 17 (6%) | 6 (10%) |
| Chemotherapy | 67 (7%) | 25 (8%) | 29 (11%) | 9 (3%) | 3 (5%) |
| Other | 2 (0.2%) | 0 | 2 (0.7%) | 0 | 0 |
| Among patients with ureteroscopy, time from ureteroscopy until survey completion, N (%) | |||||
| < 6 months | 10 (21%) | 4 (25%) | 5 (25%) | 1 (14%) | 1 (33%) |
| 6–12 months | 7 (15%) | 2 (12%) | 4 (20%) | 0 | 0 |
| 12–18 months | 2 (4%) | 0 | 1 (5%) | 1 (14%) | 0 |
| 18–24 months | 3 (6%) | 0 | 2 (10%) | 0 | 1 (33%) |
| > 2 years | 22 (47%) | 9 (56%) | 8 (40%) | 4 (57%) | 0 |
| Missing | 3 (6%) | 1 (6%) | 0 | 1 (14%) | 1 (33%) |
| Among patients with ureteroscopy, cancer recurrence after ureteroscopy treatment, N (%) | |||||
| Yes | 21 (45%) | 0 | 16 (80%) | 3 (43%) | 2 (67%) |
| No | 20 (42%) | 14 (87%) | 4 (20%) | 2 (29%) | 0 |
| Missing | 6 (13%) | 2 (12%) | 0 | 2 (29%) | 1 (33%) |
| Among patients with nephroureterectomy, time from nephroureterectomy until survey completion, N (%) | |||||
| < 6 months | 6 (14%) | 3 (37%) | 1 (8%) | 1 (11%) | 1 (8%) |
| 6–12 months | 3 (7%) | 1 (12%) | 1 (8%) | 0 | 1 (8%) |
| 12–18 months | 4 (9%) | 0 | 0 | 2 (22%) | 2 (17%) |
| 18–24 months | 2 (5%) | 0 | 1 (8%) | 0 | 1 (8%) |
| > 2 years | 24 (55%) | 3 (37%) | 8 (62%) | 5 (56%) | 6 (50%) |
| Missing | 5 (11%) | 1 (12%) | 2 (15%) | 1 (11%) | 1 (8%) |
| Among patients with nephroureterectomy, cancer recurrence after nephroureterectomy treatment, N (%) | |||||
| Yes | 11 (25%) | 0 | 4 (31%) | 1 (11%) | 6 (50%) |
| No | 27 (61%) | 7 (87%) | 7 (54%) | 7 (78%) | 4 (33%) |
| Missing | 6 (14%) | 1 (12%) | 2 (15%) | 1 (11%) | 2 (17%) |
| Among patients with other treatment, time from other treatment until survey completion, N (%) | |||||
| < 6 months | 10 (15%) | 3 (20%) | 1 (5%) | 2 (12%) | 4 (33%) |
| 6–12 months | 7 (11%) | 2 (13%) | 3 (15%) | 2 (12%) | 0 |
| 12–18 months | 1 (2%) | 1 (7%) | 0 | 0 | 0 |
| 18–24 months | 3 (5%) | 0 | 3 (15%) | 0 | 0 |
| > 2 years | 25 (38%) | 7 (47%) | 7 (35%) | 8 (47%) | 2 (17%) |
| Missing | 19 (29%) | 2 (13%) | 6 (30%) | 5 (29%) | 6 (50%) |
| Among patients withother treatment, cancer recurrence after other treatment, N (%) | |||||
| Yes | 13 (20%) | 0 | 11 (55%) | 0 | 2 (17%) |
| No | 36 (55%) | 13 (87%) | 4 (20%) | 14 (82%) | 4 (33%) |
| Missing | 16 (25%) | 2 (13% | 5 (25% | 3 (18%) | 6 (50%) |
Table 3A
Differences in Missing/Non-Missing Patient Characteristics for EORTC QLQ-C30
| Missing (N = 136) | Non-Missing (N = 836) | p-value | |
| Age (years), mean (SD) [median] | 70 (8.4) | 67 (8.8) | 0.01 |
| Gender, N (%) | 0.15 | ||
| Female | 28 (50%) | 303 (40%) | |
| Male | 28 (50%) | 451 (60%) | |
| Missing | |||
| Race, N (%) | 0.41 | ||
| White/Caucasian | 54 (96%) | 718 (97%) | |
| Black or African American | 1 (1.8%) | 11 (1.5%) | |
| American Indian or Alaska Native | 1 (1.8%) | 2 (0.3%) | |
| Asian | 0 | 9 (1.2%) | |
| Native Hawaiian or Pacific Islander | 0 | 1 (0.1%) | |
| Other | 0 | 0 | |
| Missing | 80 | 95 | |
| Ethnicity, N (%) | 0.35 | ||
| Hispanic | 2 (4%) | 14 (2%) | |
| Non-Hispanic | 51 (96%) | 717 (98%) | |
| Missing | 83 | 105 | |
| Region of current residence, N (%) | |||
| Northeast | 9 (7%) | 157 (19%) | < 0.0001 |
| Midwest | 15 (11%) | 148 (18%) | |
| South | 22 (16%) | 218 (26%) | |
| West | 7 (5%) | 171 (20%) | |
| Missing | 83 (61%) | 142 (17%) | |
| Highest level of formal education, N (%) | 0.03 | ||
| 8th grade or less | 1 (0.1%) | 0 | |
| Some high school | 2 (0.3%) | 0 | |
| High school graduate | 47 (6%) | 10 (17%) | |
| Some college (did not complete college) | 190 (25%) | 13 (23%) | |
| College graduate | 241 (32%) | 20 (35%) | |
| Post-college degree | 271 (36%) | 14 (25%) | |
| Missing | 84 | 79 | |
| Annual household income, N (%) | 0.0005 | ||
| Less than $20,000 | 8 (15%) | 23 (3%) | |
| Between $20,001 and $40,000 | 9 (17%) | 74 (11%) | |
| Between $40,001 and $60,000 | 7 (13%) | 100 (14%) | |
| Between $60,001 and $80,000 | 4 (8%) | 119 (17%) | |
| Between $80,001 and $100,000 | 7 (13%) | 103 (15%) | |
| More than $100,001 | 7 (33%) | 272 (39%) | |
| Missing | 84 | 145 | |
| Marital status, N (%) | |||
| Married | 38 (67%) | 574 (77%) | 0.21 |
| Unmarried, living with partner | 1 (2%) | 17 (2%) | |
| Divorced | 10 (17%) | 66 (9%) | |
| Widowed | 6 (10%) | 48 (6%) | |
| Separated | 0 | 7 (0.9%) | |
| Single, never married | 2 (3%) | 36 (5%) | |
| Missing | 79 | 88 | |
| Insurance coverage, N (%) | 0.28 | ||
| Commercial insurance | 24 (60%) | 408 (64%) | |
| Medicare | 9 (22%) | 169 (27%) | |
| Government | 6 (15%) | 43 (7%) | |
| No Insurance | 1 (2%) | 14 (2%) | |
| I don’t know/missing | 96 | 202 |
Table 4A
Differences in Missing/Non-Missing Patient Characteristics for BCI
| Missing (N = 114) | Non-Missing (N = 858) | p-value | |
| Age (years), mean (SD) [median] | 62.0 (15.8) | 67.7 (8.7) | 0.20 |
| Gender, N (%) | |||
| Female | 2 (50%) | 329 (41%) | 0.71 |
| Male | 2 (50%) | 477 (59%) | |
| Missing | 110 | 52 | |
| Race, N (%) | 1.00 | ||
| White/Caucasian | 4 (100%) | 768 (97%) | |
| Black or African American | 0 | 12 (1.5%) | |
| American Indian or Alaska Native | 0 | 3 (0.4%) | |
| Asian | 0 | 9 (1%) | |
| Native Hawaiian or Pacific Islander | 0 | 1 (0.1%) | |
| Other | 0 | 0 | |
| Missing | 65 | 110 | |
| Ethnicity, N (%) | 0.77 | ||
| Hispanic | 0 | 16 (2%) | |
| Non-Hispanic | 4 (100%) | 764 (98%) | |
| Missing | 110 | 78 | |
| Region of current residence, N (%) | |||
| Northeast | 0 | 166 (19%) | < 0.0001 |
| Midwest | 0 | 163 (19%) | |
| South | 3 (3%) | 237 (28%) | |
| West | 1 (1%) | 177 (21%) | |
| Missing | 110 (96%) | 115 (13%) | |
| Highest level of formal education, N (%) | 0.60 | ||
| 8th grade or less | 0 | 1 (0.1%) | |
| Some high school | 0 | 2 (0.2%) | |
| High school graduate | 1 (25%) | 56 (7%) | |
| Some college (did not complete college) | 1 (25% | 202 (25%) | |
| College graduate | 2 (50%) | 259 (32%) | |
| Post-college degree | 0 | 285 (35%) | |
| Missing | 110 | 53 | |
| Annual household income, N (%) | 0.27 | ||
| Less than $20,000 | 1 (25% | 30 (4%) | |
| Between $20,001 and $40,000 | 1 (25%) | 82 (11%) | |
| Between $40,001 and $60,000 | 0 | 107 (14%) | |
| Between $60,001 and $80,000 | 1 (25%) | 122 (16%) | |
| Between $80,001 and $100,000 | 0 | 110 (15%) | |
| More than $100,001 | 1 (25%) | 288 (39%) | |
| Missing | 110 | 119 | |
| Marital status, N (%) | 0.90 | ||
| Married | 3 (75%) | 609 (76%) | |
| Unmarried, living with partner | 0 | 18 (2%) | |
| Divorced | 1 (25%) | 75 (9%) | |
| Widowed | 0 | 54 (7%) | |
| Separated | 0 | 7 (0.9%) | |
| Single, never married | 0 | 38 (5%) | |
| Missing | 110 | 57 | |
| Insurance coverage, N (%) | 0.64 | ||
| Commercial insurance | 3 (100%) | 429 (64%) | |
| Medicare | 0 | 178 (26%) | |
| Government (Tricare) | 0 | 49 (7%) | |
| No insurance | 0 | 15 (2%) | |
| I don’t know/missing | 111 | 187 |


