
Effect of circulating tissue factor on hypercoagulability in type 2 diabetes mellitus studied by rheometry and dielectric blood coagulometry
Abstract
Background:
Hypercoagulability in type 2 diabetes mellitus (T2DM) patients increases their risk of cardiovascular diseases.
Objective:
The aim of this work was to investigate the hypercoagulation mechanism in T2DM patients in terms of circulating tissue factor (TF).
Methods:
Whole blood coagulation tests by damped oscillation rheometry and dielectric blood coagulometry (DBCM) were performed.
Results:
The average coagulation time was significantly shorter for T2DM patients than for healthy controls. In vitro addition of either anti-TF or anti-activated factor VII (FVIIa) antibody to hypercoagulable blood samples prolonged coagulation times for one group of patients, while coagulation times remained short for another group. The levels of circulating TF were estimated in the former group by measuring the coagulation times for blood samples from healthy subjects with addition of various concentrations of TF and comparing them with the coagulation times for the group. The results indicated that the levels of circulating TF were on the order of subpicomolar at most.
Conclusions:
Circulating TF is at least partially responsible for a hypercoagulable group of T2DM patients, while an abnormality in the intrinsic coagulation pathway probably occurs in the other group.
1.Introduction
Type 2 diabetes mellitus (T2DM) is associated with an increased risk of thrombosis and cardiovascular diseases [1,2]. In T2DM patients, there is a high rate of abnormal modulation of plasma proteins involved in coagulation [3]. Such abnormalities may induce a hypercoagulable state and increase the risk of fatal thrombotic events. Notably, previous studies reported that the level of tissue factor (TF) is increased in circulating blood in patients with T2DM [4–6]. Because TF is normally not expressed in endocapillary cells, it has been thought that TF is not exposed to circulating blood unless there is vascular damage. However, both flow cytometry studies [7,8] and TF activity measurements using activated factor X (FXa) assay [9,10] demonstrated the expression of TF on the surface of monocytes. It is known that circulating TF exists in three forms: monocyte TF, microparticle TF shed from monocytes or other leukocytes [6,11], and soluble TF [12]. The mechanism underlying the increased circulating TF observed in T2DM has been discussed in terms of the inhibitory effect of insulin on TF synthesis in monocytes, which is decreased by insulin resistance in T2DM [9,10]. On the other hand, Butenas et al. called attention to the significant overestimation of circulating TF that may result from either binding of antibodies to the inactive forms of TF in immunoassays or use of non-physiologically excess concentrations of activated factor VII (FVIIa) in FXa assays [13].
Even though there is still controversy about accurate quantification, the observation of increased circulating TF in T2DM patients compared to healthy subjects appears to be valid at least qualitatively. Furthermore, circulating TF pathway inhibitor (TFPI) is also increased in T2DM, probably owing to some homeostatic mechanism to prevent thrombosis, as mentioned by El-Hagracy et al. [14]. The net influence of circulating TF on blood coagulability might vary greatly among individual patients. Therefore, a blood coagulation test that is sufficiently sensitive to detect hypercoagulability would provide an easy method for individualized evaluation of thrombosis risk.
Standard blood coagulation screening tests such as the prothrombin time international normalized ratio (PT-INR) and activated partial thromboplastin time (aPTT) have limited sensitivity to hypercoagulation [15] because of the use of a large excess of coagulation initiators. Damped oscillation rheometry, in contrast, allows quantitative measurement of clotting time without artificial activation of blood coagulation, thereby providing a better estimate of hypercoagulability [16,17]. In addition, dielectric blood coagulometry (DBCM) was developed, and a good correlation with damped oscillation rheometry has been shown [18]. Recently, Chiba et al. [19] used DBCM to demonstrate hypercoagulation in respiratory diseases including interstitial pneumonitis, lung cancer, chronic obstructive pulmonary diseases, and sleep apnea syndrome. Hayashi et al. [20] summarized the principles of DBCM in a recent paper.
In the present work, blood coagulation measurements of T2DM patient samples were performed using both damped oscillation rheometry and DBCM to study the mechanism of hypercoagulation in T2DM, and the clinical utility of DBCM was also assessed. First, the rheological approach was employed with and without in vitro addition of anti-TF or anti-FVIIa antibodies to confirm that circulating TF plays an important role in the hypercoagulability in T2DM. Next, a feasibility study of DBCM was conducted to evaluate hypercoagulability in T2DM patients. Finally, DBCM was used for nonclinical model experiments carried out using blood from healthy volunteers. Extrinsic pathway inhibition by either anti-TF or anti-FVIIa antibody was confirmed for blood samples spiked with TF, and then the levels of circulating TF were estimated by measuring coagulation times as the TF concentration was varied, and they were compared with the coagulation times of T2DM patients.
2.Materials and methods
2.1.Blood sources and reagents
This study was approved by the Ethics Committee of Tokyo Medical and Dental University. Whole blood samples (1.8 mL) mixed with 0.2 mL of 3.13% trisodium citrate were obtained from healthy volunteers and T2DM patients who had been hospitalized in the Department of Endocrinology and Metabolism, Tokyo Medical and Dental University Hospital. Exclusion criteria included age younger than 20 years or hemoglobin A1c (HbA1c) lower than 6.5% at the examination. All patients involved agreed to participate in the study after they provided their informed consent and fulfilled the eligibility criteria for enrollment. The clinical study of T2MD was performed in Tokyo Medical and Dental University, and the nonclinical part of the study was carried out at the laboratory of Sony Corporation at the university.
Anti-TF monoclonal antibody and anti-FVIIa polyclonal antibody were obtained from Cosmo Bio, Ltd. (Tokyo, Japan) and Funakoshi Ltd. (Tokyo, Japan), respectively, and they were dissolved in distilled water to a concentration of 1.0 mg/mL. To restart the blood coagulation process, a 250 mM aqueous solution of calcium chloride (Wako Pure Chemical Industries, Ltd., Tokyo, Japan) was added to the blood samples at a final concentration of 85 μL/mL, which were mixed just before rheological or DBCM measurement was started. The reagent for the PT test, Dade Innovin, was obtained from Sysmex Corp. (Kobe, Japan) and dissolved in 4 mL of distilled water according to the manufacturer’s instructions. The TF concentration of this stock solution was approximately 6–7 nM, according to the literature [21–23]. In the present study, this solution was diluted 100 times in distilled water and further diluted in PBS for serial dilutions, which, together with the calcium chloride solution, were added to and mixed with blood samples just before DBCM measurement was started in the nonclinical part of the study.
2.2.Damped oscillation rheometry
Blood from each patient was dispensed into two polypropylene tubes. Anti-TF or anti-FVIIa antibody solutions (20.2 μL/mL) were added into one of the tubes (final antibody concentration of 20 μg/mL), and the same volume of HEPES buffer (pH 7.4) was added into the other tube (a control) to equalize the dilution rate of blood samples. The samples were gently mixed well and incubated at 37°C for 30 minutes.
Two damped oscillation rheometer apparatuses were used to simultaneously measure samples in the absence and presence of the antibodies. The details of the method were described in the previous papers [16,17]. Briefly, incubated blood samples were dispensed in a polypropylene sample tube just after recalcification. The sample tube was placed in the holder of the rheometer, which is connected via a torsion wire to a magnetic coil and maintained at 37°C. Direct current (DC) was introduced into the coil between magnetic poles, which generated an initial rotational displacement in the measuring system. When current was turned off, the system started a rotational damped oscillation, which produced an induced electromotive force in the coil. Thus, a damped oscillation curve was detected as an output voltage every 20 s, and a logarithmic damping factor (LDF) was obtained from the curve. In the present experiments, the frequency was 1 Hz, the initial rotational angle was 20 degrees, and the shear rate on the blood sample was estimated to be below 1 s−1 [24,25]. After the measurement, the coagulation time of the sample (
2.3.DBCM
Dielectric responses in blood samples during the coagulation process at 37°C were recorded for 60 minutes at intervals of one or two minutes and a frequency range covering at least 1 kHz to 10 MHz using DBCM prototype setups developed by Sony Corporation [18–20]. The effects of erythrocyte sedimentation were minimized by the prototypes’ design. Two kinds of methods were available. One was a rotating method, where the prototype system automatically rotated a sealed sample holder by 180 degrees every minute. The sample holder was a plate capacitor-type consisting of a polypropylene cylinder tube with two titanium electrodes (9 mm in diameter), squeezed into the top and bottom ends of the tube. The other one was a non-rotating method based on use of polypropylene disposable cartridge with titanium electrode inserts to be a plate capacitor-type. This cartridge was designed so that the sedimentation boundaries would not reach electrode height during measurements (see Supplemental Fig. S1 in the reference [20]). Note that the applied AC voltages for measurements were lower than 300 mV (effective voltage), where non-linear dielectric responses were negligible.
In the first phase of the DBCM study, the coagulation process of T2DM blood samples was monitored in the absence of anti-TF and anti-FVIIa antibodies. In the second phase, the inhibition effects of anti-TF and anti-FVIIa antibodies were tested, and the levels of circulating TF in T2MD samples were estimated by nonclinical studies on samples from healthy subjects. To test the effects of the antibodies, the diluted Dade Innovin solution was added to the sample blood at TF concentration of 0.6–0.7 pM, and the sample was incubated at 37°C for 30 min with and without anti-TF or anti-FVIIa antibody (20.2 μL/mL), where the rate of sample dilution was kept the same at 9% for all tested samples using physiological saline. The calcium chloride solution was added just before the start of DBCM measurement. For the estimation of the levels of circulating TF in T2MD samples, different concentrations of TF were added to the blood samples together with the calcium chloride solution just before a measurement was started. The dilution rate for all samples was kept equal at 12%.
2.4.Statistical analysis
Differences in the DBCM data sets were verified using Student’s t-test with the Bonferroni correction for multiple comparisons. Three data sets, obtained by the rotating and non-rotating methods for T2DM and by the rotating method for healthy controls were tested. Significance was defined as
3.Results and discussion
3.1.Patient characteristics
The characteristics, laboratory data, and meditations of the T2DM subjects in this study are presented in Table 1. The mean values of HbA1c indicate that the majority of the subjects had poorly controlled plasma glucose levels.
Table 1
Characteristics of patients
| Variable | T2DM, rotating ( | T2DM, non-rotating ( |
| Age, years | 61.8 (13.0)/53.3–71.5 | 64.5 (10.1)/59.0–71.0 |
| Sex, % male | 62% | 59% |
| HbA1c, % | 8.9 (1.7)/7.9–9.8 | 9.6 (1.6)/8.4–10.4 |
| LDL-C, mg/dL | 122 (35)/95–146 | 109 (33)/78–131 |
| Fibrinogen, mg/dL | 342 (69)/288–381 | 336 (81)/280–359 |
| sCr, mg/dL | 0.83 (0.31)/0.62–0.98 | 0.86 (0.49)/0.59–0.95 |
| Hct, % | 41.4 (4.2)/38.7–44.0 | 40.7 (4.8)/37.5–43.4 |
| Platelet count, | 22.3 (5.8)/18.2–26.1 | 24.1 (7.5)/20.7–27.1 |
| Antiplatelet therapy, n | 14 | 8 |
| (aspirin, n) | (10) | (7) |
| (cilostazol, n) | (2) | (1) |
| (sarpogrelate hydrochloride, n) | (2) | (0) |
| Warfarin, n | 2 | 2 |
| Insulin, n | 39 | 21 |
| OHA, n | 11 | 0 |
Data are shown as mean (SD)/interquartile range.
LDL-C: low-density lipoprotein cholesterol, sCr: serum creatinine concentration, OHA: oral hypoglycemic agent.
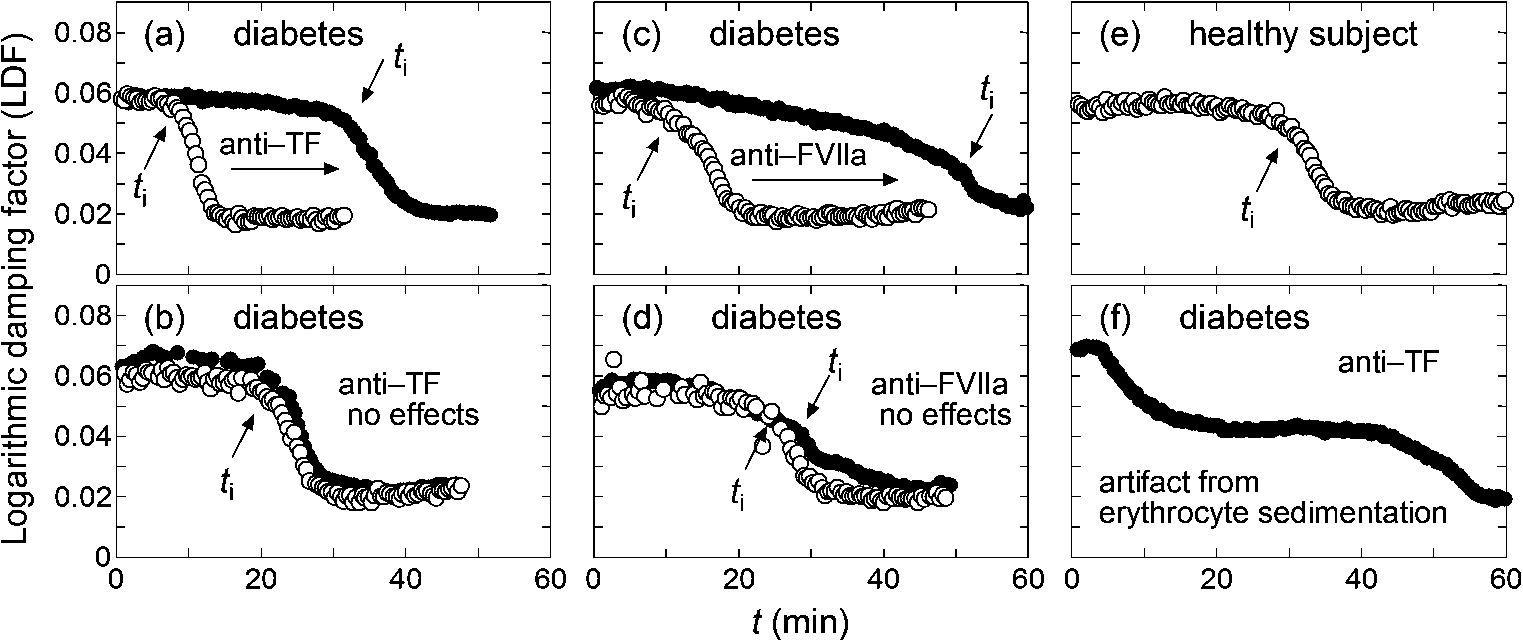
Fig. 1.
Typical LDF curves, where open and filled circles correspond to the data without and with added anti-TF or anti-FVIIa antibody, respectively, and positions of
3.2.The mechanism of hypercoagulability in T2DM
Figure 1 shows typical examples of rheological results for samples from T2DM and healthy subjects. The start of fibrin polymerization induces drastic changes of viscosity and viscoelasticity of blood samples, and it appears as a rapid decrease of LDF. Such a time point is reflected in the definition of
Figure 1(a) and (b) represent two groups of T2DM samples that showed different responsiveness to added anti-TF antibody. For approximately half of the T2DM samples tested, inhibition of TF induced a prolonged coagulation process suggested by increased
An abnormality in the intrinsic coagulation pathway is another potential cause of the hypercoagulability in T2DM. Feener et al. [26] recently reviewed the role of plasma kallikrein in diabetes. Kallikrein is a serine protease that converts factor XII (FXII) to activated FXII (FXIIa) upstream of the intrinsic coagulation cascade. Kedzierska et al. [27] reported higher plasma concentrations of prekallikrein (the precursor of kallikrein) in human type 1 diabetics than in non-diabetic subjects, while Clermont et al. [28] reported increased plasma prekallikrein in diabetic rats. Furthermore, Iwata and Kaibara [29] reported the presence of erythroelastase-IX, which converts factor IX (FIX) to an activated form (FIXa), on human erythrocyte membranes, and erythroelastase-IX activity was found to be higher in T2DM patients than in healthy controls [17]. In the intrinsic coagulation cascade, FIX is activated by activated factor XI (FXIa), and FXIa is produced by the catalytic activity of FXIIa, which is activated by kallikrein. Thus, increased activity of either kallikrein or erythroelastase-IX may induce a hypercoagulable state of the intrinsic coagulation cascade. From the arguments above, it is expected that
The examples in the pair of Fig. 1(a) and (c) and the pair of Fig. 1(b) and (d) are considered to correspond to the hypercoagulability related to the extrinsic and intrinsic coagulation pathways, respectively. The damped oscillation rheometer can clearly differentiate the two groups. However, during the study, it was found to have difficulty in performing measurements for blood samples with elevated sedimentation rates. Figure 1(f) shows a typical case where
3.3.Hypercoagulability in T2DM studied by DBCM
The main dielectric response of blood is known to be interfacial polarization on erythrocyte membranes that is usually observed over a frequency range of hundreds of kHz to tens of MHz, while a large parasitic contribution from electrode polarization is also observed at lower frequencies [31]. Figure 2(a) shows typical dielectric dispersion curves as a function of time for a T2DM sample, where the stepwise decreases in permittivity (
Fig. 2.
Typical DBCM response for a T2DM sample. Panel (a) shows the change in the dielectric dispersion curve during the progression of blood coagulation, and panel (b) is the same data normalized to the dielectric dispersion curve at the first time point. The frequency range for this measurement was 100 Hz to 110 MHz.
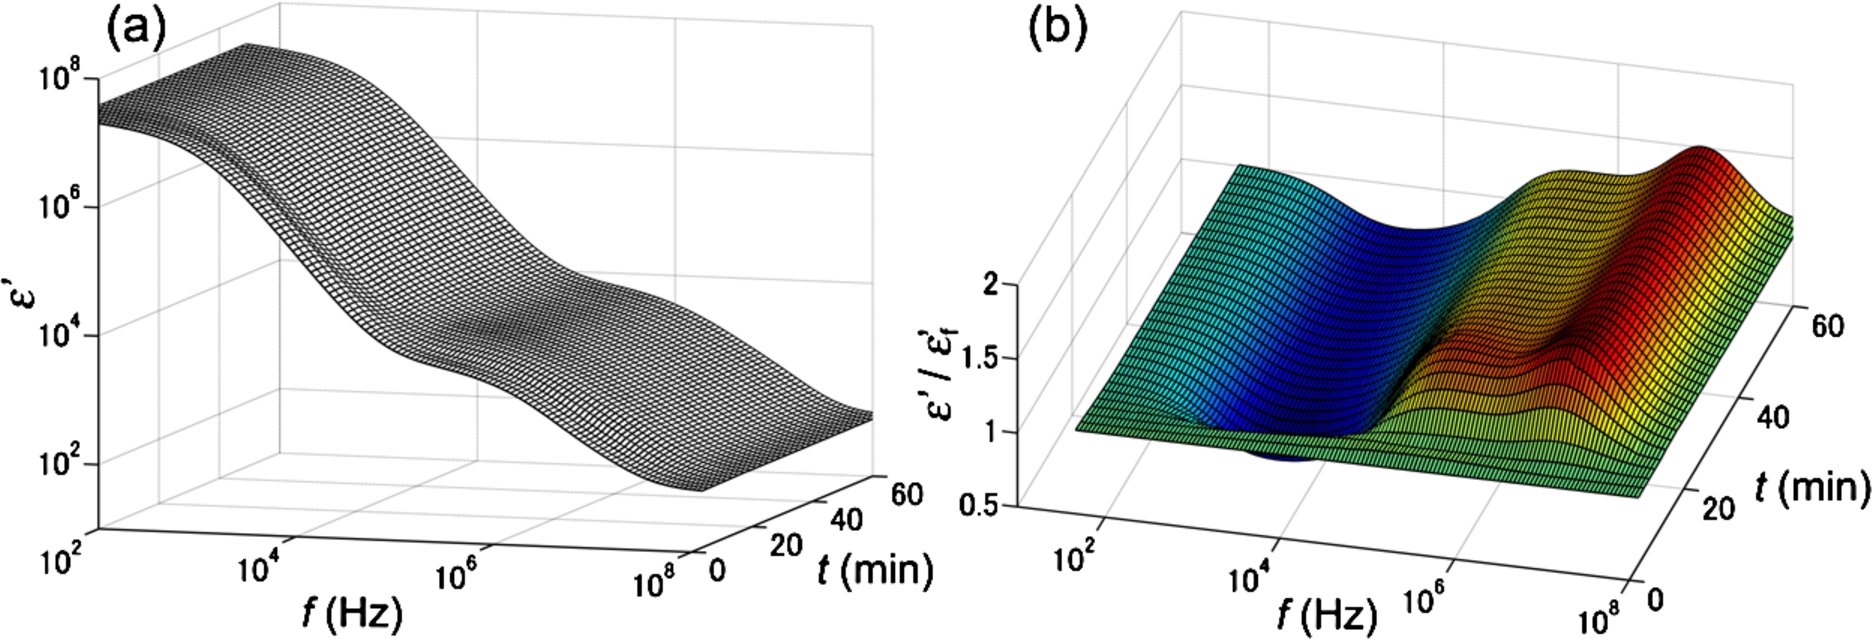
From this observation, it was found that the time-dependent curve of normalized
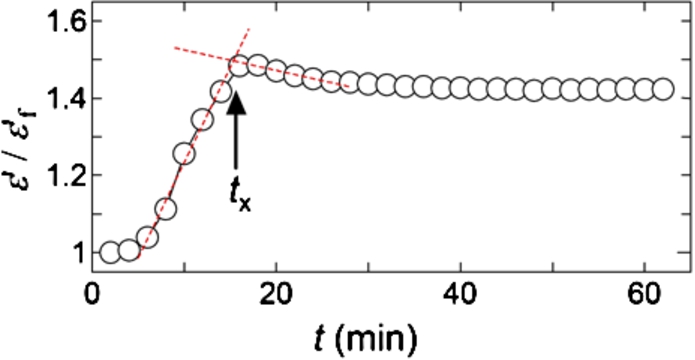
Fig. 4.
Comparison of
![Comparison of tx between T2DM and non-diabetic control samples. Open circles and open squares show data obtained by the prototype setups with the rotating and non-rotating methods, respectively (see the Section “2.3. DBCM”). Red bars show average values of tx±standard deviations for T2DM from the rotating (tx=28.9±9.6 min, n=82) and the non-rotating (tx=28.2±8.7 min, n=37) methods and controls (tx=37.9±8.4 min, n=28). The control data taken from the previous study [19] can also be used in the present study because the same DBCM prototype system was used and operated by the same person.](https://ip.ios.semcs.net:443/media/bir/2016/53-5-6/bir-53-5-6-bir16107/bir-53-bir16107-g004.jpg)
3.4.Confirmation of extrinsic pathway inhibition by anti-TF and anti-FVIIa antibodies
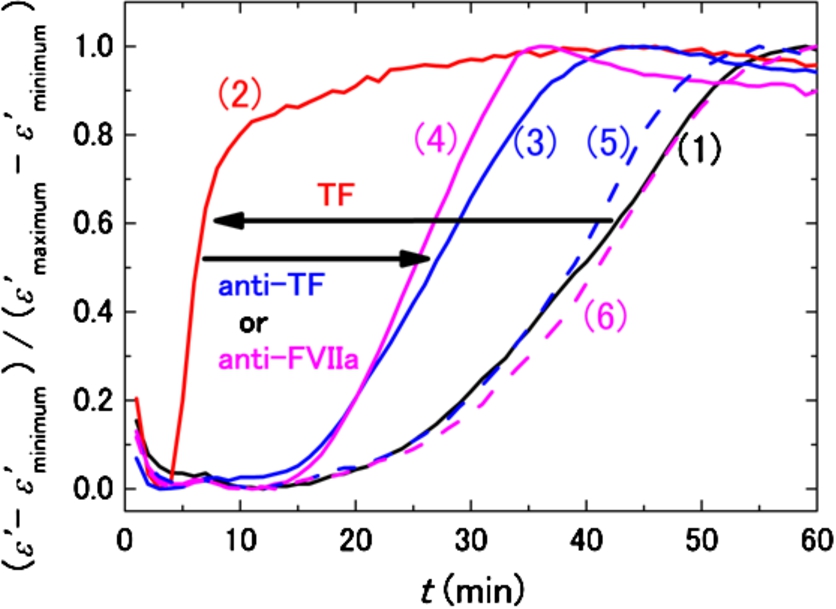
The effectiveness of anti-TF and anti-FVIIa antibodies for inhibition of TF was checked under a well-controlled condition using a model system to establish the basis of our discussion on the circulating TF in T2DM in Section 3.2. Figure 5 shows normalized DBCM responses for a healthy subject with and without in vitro addition of TF and/or the antibodies. With addition of 0.6–0.7 pM TF without the antibody, the DBCM response is shifted to the left direction in shorter times (from the curve (1) to (2) in Fig. 5). The sample corresponding to curve (2) is considered a simplified model of the hypercoagulation state of T2DM due to circulating TF. Addition of both anti-TF and anti-FVIIa antibodies to this model system partially compensated for the effects of TF and shifted the DBCM responses (curves (3) and (4)) in the right direction toward the control (curve (1)). Addition of either anti-TF or anti-FVIIa antibody without TF did not affect the DBCM response, because curves (5) and (6) in Fig. 5 were very close to the control curve (1). Therefore, it was confirmed that DBCM can monitor the inhibition of TF by the antibodies, and that circulating TF is a probable contributor to the hypercoagulability in the subset of T2DM corresponding to Fig. 1(a) and (c).
Fig. 5.
DBCM responses from a healthy subject at 10 MHz normalized by the minimum and maximum values of permittivity. The black curve (1) shows the control sample without TF and antibodies, and the red curve (2) demonstrates the acceleration of the DBCM response by addition of TF to the sample blood. Simultaneous addition of TF and anti-TF antibody (3) or TF and anti-FVIIa antibody (4) prolongs the DBCM response in comparison with (2). On the other hand, addition of anti-TF antibody (5) or anti-FVIIa antibody (6) without TF shows responses similar to the control (1).
3.5.Estimation of circulating TF levels in T2DM
Assuming that circulating TF is the main factor responsible for shortened
Fig. 6.
TF concentration dependence of
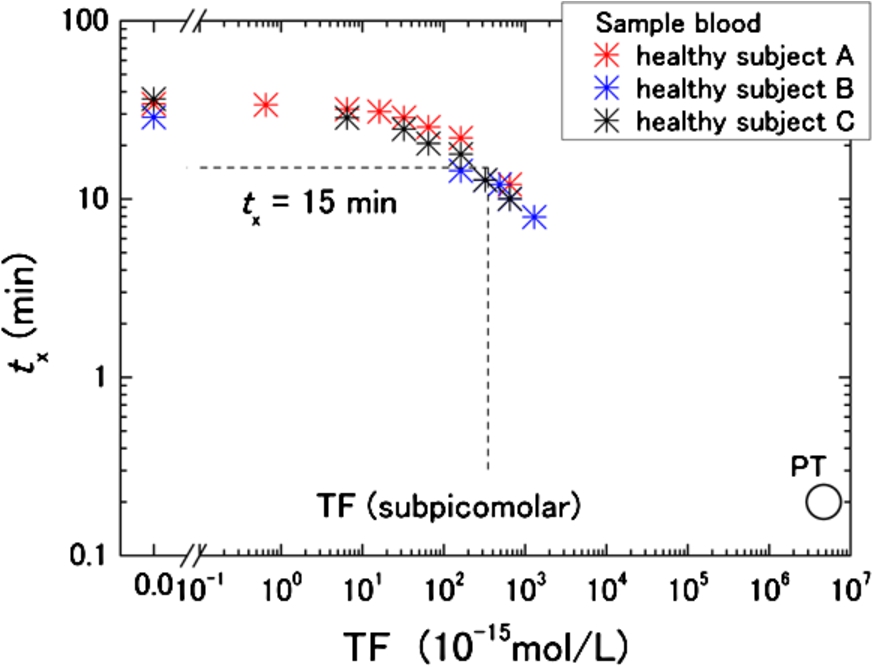
For the hypercoagulable T2DM group,
Based on our estimate, however, the baseline TF concentration in healthy subjects is unknown. To be precise, therefore, the discussed TF level in T2DM is only a relative value. Nevertheless, Butenas et al. concluded that physiologically active TF in blood from healthy subjects is less than 20 femtomolars [13]. If that is the baseline level of TF in healthy subjects, the present rough estimation of the TF level in T2DM is still valid as the plasma concentration. Another limitation of the present work is TFPI, because its effects were not taken into account. Because TFPI may be increased in T2DM [14,33], the present analysis can lead to underestimation due to differences in TFPI concentrations between T2DM and healthy subjects.
4.Conclusions
The present study indicated that there are at least two hypercoagulability mechanisms involved in T2DM. One mechanism is dependent on circulating TF levels, and the other is TF-independent. Although the clinical importance of circulating TF, including the risk of fatal thrombotic events, still remains an open question, the possibility of discriminating the types of hypercoagulability shown in this study is promising for the development of a personalized medicine tool in the future. Because DBCM is a sensitive tool for testing hypercoagulability, further development of DBCM-based assays will enable the evaluation of individual coagulation states. At the same time, clarifications of how comorbidities, medications, and physical characteristics affect hypercoagulability in T2DM are very important, but multivariate analyses of data from a much larger scale of study than the present work are needed for this.
References
[1] | Grundy SM, Howard B, Smith S Jr, Eckel R, Redberg R, Bonow RO. Prevention conference VI: Diabetes and cardiovascular disease: Executive summary: Conference proceeding for healthcare professionals from a special writing group of the American Heart Association. Circulation. (2002) ;105: :2231–2239. doi:10.1161/01.CIR.0000013952.86046.DD. |
[2] | Samad F, Ruf W. Inflammation, obesity, and thrombosis. Blood. (2013) ;122: :3415–3422. doi:10.1182/blood-2013-05-427708. |
[3] | Carr ME. Diabetes mellitus: A hypercoagulable state. J Diabetes Complications. (2001) ;15: :44–54. doi:10.1016/S1056-8727(00)00132-X. |
[4] | Boden G, Vaidyula VR, Homko C, Cheung P, Rao AK. Circulating tissue factor procoagulant activity and thrombin generation in patients with type 2 diabetes: Effects of insulin and glucose. J Clin Endocrinol Metab. (2007) ;92: :4352–4358. doi:10.1210/jc.2007-0933. |
[5] | Krupinski J, Turu MM, Font MA, Ahmed N, Sullivan M, Rubio F, et al. Increased tissue factor, MMP-8, and D-dimer expression in diabetic patients with unstable advanced carotid atherosclerosis. Vasc Health Risk Manag. (2007) ;3: :405–412. |
[6] | Wang J, Ciaraldi TP, Samad F. Tissue factor expression in obese type 2 diabetic subjects and its regulation by antidiabetic agents. J Obes. (2015) ;2015: :291209. |
[7] | Reverter JL, Reverter JC, Tàssies D, Rius F, Monteagudo J, Rubiés-Prat J, et al. Thrombomodulin and induced tissue factor expression on monocytes as markers of diabetic microangiopathy: A prospective study on hemostasis and lipoproteins in insulin-dependent diabetes mellitus. Am J Hematol. (1997) ;56: :93–99. doi:10.1002/(SICI)1096-8652(199710)56:2<93::AID-AJH4>3.0.CO;2-W. |
[8] | Vaidyula VR, Rao AK, Mozzoli M, Homko C, Cheung P, Boden G. Effects of hyperglycemia and hyperinsulinemia on circulating tissue factor procoagulant activity and platelet CD40 ligand. Diabetes. (2006) ;55: :202–208. doi:10.2337/diabetes.55.01.06.db05-1026. |
[9] | Gerrits AJ, Koekman CA, Yildirim C, Nieuwland R, Akkerman JW. Insulin inhibits tissue factor expression in monocytes. J Thromb Haemost. (2009) ;7: :198–205. doi:10.1111/j.1538-7836.2008.03206.x. |
[10] | Gerrits AJ, Koekman CA, van Haeften TW, Akkerman JW. Increased tissue factor expression in diabetes mellitus type 2 monocytes caused by insulin resistance. J Thromb Haemost. (2011) ;9: :873–875. doi:10.1111/j.1538-7836.2011.04201.x. |
[11] | Rauch U, Nemerson Y. Tissue factor, the blood, and the arterial wall. Trends Cardiovasc Med. (2000) ;10: :139–143. doi:10.1016/S1050-1738(00)00049-9. |
[12] | Sommeijer DW, Hansen HR, van Oerle R, Hamulyak K, van Zanten AP, Meesters E, et al. Soluble tissue factor is a candidate marker for progression of microvascular disease in patients with type 2 diabetes. J Thromb Haemost. (2006) ;4: :574–580. doi:10.1111/j.1538-7836.2005.01763.x. |
[13] | Butenas S, Bouchard BA, Brummel-Ziedins KE, Parhami-Seren B, Mann KG. Tissue factor activity in whole blood. Blood. (2005) ;105: :2764–2770. doi:10.1182/blood-2004-09-3567. |
[14] | El-Hagracy RS, Kamal GM, Sabry IM, Saad AA, Ezz NFAE, Nasr HAR. Tissue factor, tissue factor pathway inhibitor and factor VII activity in cardiovascular complicated type 2 diabetes mellitus. Oman Med J. (2010) ;25: :173–178. doi:10.5001/omj.2010.52. |
[15] | Park MS, Martini WZ, Dubick MA, Salinas J, Butenas S, Kheirabadi BS, et al. Thromboelastography as a better indicator of postinjury hypercoagulable state than prothrombin time or activated partial thromboplastin time. J Trauma. (2009) ;67: :266–276. doi:10.1097/TA.0b013e3181ae6f1c. |
[16] | Kaibara M, Date M. A new rheological method to measure fluidity change of blood during coagulation: Application to in vitro evaluation of anticoagulability of artificial materials. Biorheology. (1985) ;22: :197–208. |
[17] | Kaibara M. Rheological study on coagulation of blood with special reference to the triggering mechanism of venous thrombus formation. J Biorheol. (2009) ;23: :2–10. doi:10.1007/s12573-009-0003-2. |
[18] | Hayashi Y, Katsumoto Y, Omori S, Yasuda A, Asami K, Kaibara M, et al. Dielectric coagulometry: A new approach to estimate venous thrombosis risk. Anal Chem. (2010) ;82: :9769–9774. doi:10.1021/ac101927n. |
[19] | Chiba S, Uchibori K, Fujiwara T, Ogata T, Yamauchi S, Shirai T, et al. Dielectric blood coagulometry as a novel coagulation test. J Sci Res Rep. (2015) ;4: :180–186. |
[20] | Hayashi Y, Brun M-A, Machida K, Nagasawa M. Principles of dielectric blood coagulometry as a comprehensive coagulation test. Anal Chem. (2015) ;87: :10072–10079. doi:10.1021/acs.analchem.5b02723. |
[21] | Sørensen B, Ingerslev J. Whole blood clot formation phenotypes in hemophilia A and rare coagulation disorders. Patterns of response to recombinant factor VIIa. J Thromb Haemost. (2004) ;2: :102–110. doi:10.1111/j.1538-7836.2004.00528.x. |
[22] | Bos MH, Meijerman DW, van der Zwaan C, Mertens K. Does activated protein C-resistant factor V contribute to thrombin generation in hemophilic plasma? J Thromb Haemost. (2005) ;3: :522–530. doi:10.1111/j.1538-7836.2005.01181.x. |
[23] | Duckers C, Simioni P, Spiezia L, Radu C, Dabrilli P, Gavasso S, et al. Residual platelet factor V ensures thrombin generation in patients with severe congenital factor V deficiency and mild bleeding symptoms. Blood. (2010) ;115: :879–886. doi:10.1182/blood-2009-08-237719. |
[24] | Murata T, Date M, Kaibara M. Analysis of newly developed damped-oscillation rheometer: Newtonian liquid. Jap J Appl Phys. (1987) ;26: :1234–1240. doi:10.1143/JJAP.26.1234. |
[25] | Kawakami S, Kaibara M, Nakayama M, Isogai Y, Ikemoto S, O’Rear EA, et al. Rheological study of the dynamic process of fibrinolysis. Blood Coagul Fibrinolysis. (1997) ;8: :351–359. doi:10.1097/00001721-199709000-00005. |
[26] | Feener EP, Zhou Q, Fickweiler W. Role of plasma kallikrein in diabetes and metabolism. Thromb Haemost. (2013) ;110: :434–441. doi:10.1160/TH13-02-0179. |
[27] | Kedzierska K, Ciechanowski K, Gołembiewska E, Safranow K, Ciechanowicz A, Domański L, et al. Plasma prekallikrein as a risk factor for diabetic retinopathy. Arch Med Res. (2005) ;36: :539–543. doi:10.1016/j.arcmed.2005.03.050. |
[28] | Clermont A, Chilcote TJ, Kita T, Liu J, Riva P, Sinha S, et al. Plasma kallikrein mediates retin Clermont al vascular dysfunction and induces retinal thickening in diabetic rats. Diabetes. (2011) ;60: :1590–1598. doi:10.2337/db10-1260. |
[29] | Iwata H, Kaibara M. Activation of factor IX by erythrocyte membranes causes intrinsic coagulation. Blood Coagul Fibrinolysis. (2002) ;13: :489–496. doi:10.1097/00001721-200209000-00003. |
[30] | Kaibara M, Hayashi Y, Shinozaki T, Uchimura I, Ujiie H, Suzuki Y. Simultaneous measurement of blood coagulation and erythrocyte sedimentation by means of a rheological technique. J Biorheol. (2010) ;24: :36–41. doi:10.1007/s12573-010-0022-z. |
[31] | Raicu V, Feldman Y. Dielectric relaxation in biological systems: Physical principles, methods, and applications. Oxford: Oxford University Press; (2015) . |
[32] | So AK, Varisco PA, Kemkes-Matthes B, Herkenne-Morard C, Chobaz-Péclat V, Gerster JC, et al. Arthritis is linked to local and systemic activation of coagulation and fibrinolysis pathways. J Thromb Haemost. (2003) ;1: :2510–2515. doi:10.1111/j.1538-7836.2003.00462.x. |
[33] | Ruszkowska-Ciastek B, Sokup A, Wernik T, Rhone P, Góralczyk K, Bielawski K, et al. Low-grade risk of hypercoagulable state in patients suffering from diabetes mellitus type 2. J Zhejiang Univ Sci B. (2015) ;16: :788–795. doi:10.1631/jzus.B1500066. |


