
A method to detect thermal damage in bovine liver utilising diffuse reflectance spectroscopy
Abstract
When light is illuminated using a broad spectrum and detected without physical contact between source and detector the method is often referred as diffuse reflectance spectroscopy (DRS). Combined with newest computational algorithms, DRS may reach high performance in near future in tissue characterization and pathology. In this study, we show that DRS can be used to automatically differentiate untreated fresh liver tissue from heat-induced and chemically induced tissue denaturation in bovine liver ex vivo. For this, we used a thresholding algorithm that was developed and tested using 10-fold cross validation. Our results indicate that DRS has potential to detect pathological tissue processes that result in tissue injury and ultimately tissue necrosis. The detection of necrosis is important for many medical applications, not least for tissue sampling by biopsy needle, where additional guidance to commonly used ultrasound would be welcome. Furthermore, cancer tissue is prone to necrosis as a result of tissue hypoxia and due to cancer treatments.
1.Introduction
Light has been utilized for several decades to study tissue properties. In general, the sensing principle is based on light interaction with tissue, causing changes in wavelength dependent absorption and scattering. Optical spectroscopic techniques are currently strongly developed also for in vivo applications. In particular, label-free methods, that do not require use of contrast agents to differentiate and classify tissues are especially suitable for clinical use [24]. Diffuse Reflectance Spectroscopy (DRS) is a technique that allows obtaining information from biological samples without the addition of molecular contrast agents [1]. For example, natural chromophores such as melanin, bilirubin or collagen could be used for this purpose [7] and continuous measurements allow to examine changes in tissue over time. This gives an opportunity to monitor e.g. metabolic and morphological changes in tissues as presented by Dremin et al. [14]. A single measurement can be also performed within sub-second range, allowing to track even subtle changes, that may occur quickly, for instance during radiation therapy [12,37]. Over past years DRS has shown feasibility in multiple tissue studies such as muscle, bone, fat, nervous [8,11,15,17]. In combination with proper signal processing, tissues could be characterized in real-time, as presented by Spliethoff et al. during lung biopsy [45], detection of breast cancer [10] or tissue assessment during colorectal cancer surgery [3]. DRS can be implemented also as an invasive monitoring technique, such was shown on rodents and human liver steatosis characterization during surgeries [39,42].
Coagulative necrosis resulting from irreversible cell injury may occur due to variety of injuries such as, frostbites [22], burns [5] or due to contact with toxic chemicals [41] or radiation [32]. The most common cause of coagulative necrosis is due to insufficient blood circulation resulting in tissue hypoxia and eventually an infarction. Hypoxic tissue necrosis is also common in cancer, when angiogenesis does not comply with the requirements of growing tumor mass [23]. Certain drug therapies can also result in irreversible cell injury and tissue necrosis [20]. Effective radiotherapy does result in irreversible cell injury in cancer cells, thus detection of necrosis is of high interest [36,37]. Sometimes this may result in non-representative sampling [51]. Furthermore, even small amount of necrosis may deprive mutation analyses that are needed for the correct treatment in cancer [9,53]. Thus, during biopsy, necrosed areas of a tumor should be avoided. In large tumours, central areas are more often necrotic and are usually avoided [50]. However, in smaller lesions presence of necrosis makes sampling of the tissue more challenging [6,18,51]. In cancer therapy, situation is opposite, since the pertinent estimation of necrosis is important as it can indicate success of treatment [4].
At present, fluorescence microscopy is typically used to detect necrosis in biopsy [19,27]. Necrosis can be also detected optically based on changes in tissue oxygenation [33,47]. In addition, Raman microscopy has been used to detect necrotic tissue during brain surgery [26], and Doppler optical coherence tomography in photo-dynamic therapy of prostate carcinoma [46]. In real-time detection or so-called rapid diagnosis, ionization mass spectroscopy has been tested on aggressive forms of breast cancer [49]. Additionally, staining tumor areas with inks may enhance performance of necrosis detection within tumor or allow to use previously unsuitable methods [44].
Previous studies utilising DRS have already shown potential in necrosis-related detection. Anand et al. utilized DRS in diabetic foot ulcer studies, as tissue oxygenation carried important information about both tissue condition but also healing process [2]. Voulgarelis et al. validated real-time measurement of liver tissue saturation, which is an indicator for liver perfusion and oxygen delivery [52]. Furthermore, hepatic steatosis might be tracked in vivo as shown by Piao et al. [40], proving versatility of the method. In combination with artificial intelligence, hepatic steatosis might be diagnosed with high precision [43]. Radio-frequency ablation of human colorectal liver metastases induces necrotic tissues and their presence might be studies using DRS as well [48]. In human liver cancer, prototype built by Keller et al. enabled continuous measurements during needle insertion, thus allowing the co-registration between measurement data and its histologic examination, including determination of histologic fibrosis and necrosis degree [25].
In this study, we used thermal injury [21] to study the capability of DRS to detect tissue coagulation as an ex vivo model resembling coagulative necrosis [29,34,38]. System able to track presence of necrosis and avoid it during biopsy would be useful tool for interventional radiologists. Especially, that currently only expensive and complex methods are able to track it. Liver as a deep organ is challenging during biopsy and thus it was chosen for these studies [35]. Bovine liver was chosen mainly due to its similarity to human liver [31]. Measurement setup, tissue coagulation model, measurement protocol, data analysis and classification algorithm is described in Method and materials section. It is followed by Results section, where data is visualized and classification algorithm is validated. In discussion, coagulation model is justified, thresholding algorithm is evaluated and future development proposed.
2.Methods and materials
2.1.Measurement setup
Data was collected using USB4000-VIS-NIR-ES portable spectrometer. Spectrometer was working in a full range mode. Collected 1000 optical spectra, from 10 different animals were later analyzed for automated classification. The fully portable and table-sized measurement system consisted of three main parts: fiberoptic probe with sample holder, spectrometer and halogen light source (Fig. 1). Optical probe and holder were custom made in-house. Two bare “FT200EMT”, 500 µm-thick, flat polished optical fibers with aperture of 0.39 NA were embedded into cavities of standard two-gauge 16 biopsy needles (inner diameter 1.19 mm, outer diameter 1.65 mm), manufactured by Bard biopsy. Distance between centers were set to 0.7 mm. First channel was used to guide the light onto the sample, the second channel for recording the reflectance from the surface of the samples. WS-1 by OceanInsights was used as diffuse reflectance standard (98% reflectivity in 250–1500 nm). Single point measurements of spectral arrays in patterns of
Fig. 1.
Model of the measurement system.
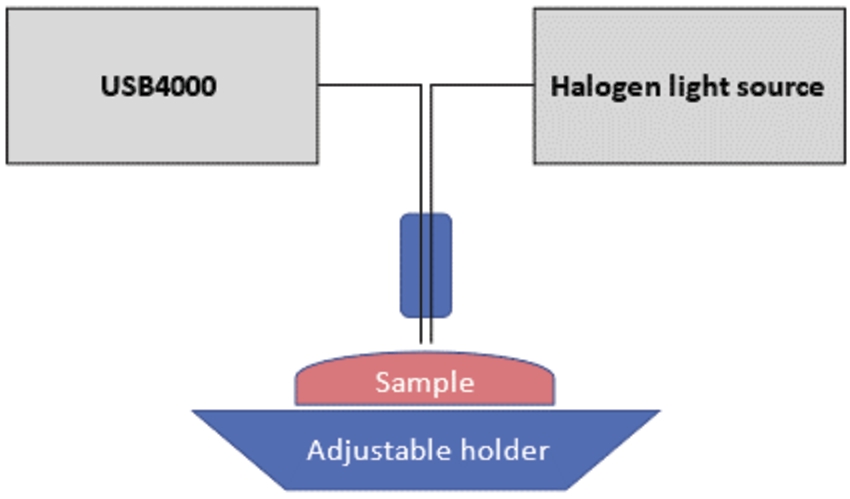
The spectrometer (Ocean Insights USB4000-UV-VIS-ES) covered the spectral range of 200–850 nm. The HL-2000-HP halogen light source by Ocean Insights provided illumination in range of 360–2400 nm, which was more than sufficient range and exceeded detection capabilities. USB4000 is a miniature spectrometer preconfigured for general UV and VIS range measurements. Raw photon count was recorded in “scope mode”. Reflectance was calculated manually using reflectance standard (WS-1) for every measured spectrum. Thus, all calculated reflectance values are relative. Integration time was set to 100 milliseconds, without averaging and boxcar window. Such short integration time was necessary to enable real-time measurement. Ambient light was reduced to minimum. Along white reference, so-called dark spectrum, which depicts noise generated by spectrometer were collected before measurements.
2.2.Thermal and chemical damage as model for tissue coagulation
Six different methods were tested to induce thermal injury in bovine liver ex vivo. The methods were: boiling in tap water, boiling in 0.9 % saline solution, heating in a test tube, microwave heating, and fixation in formalin and fixation in ethanol. All samples were same size of about
Fig. 2.
Necrosis model, histological H&E-stained rat’s liver slides: boiled (A–D), microwaved (E–F), formalin fixation (G), ethanol fixation (H).
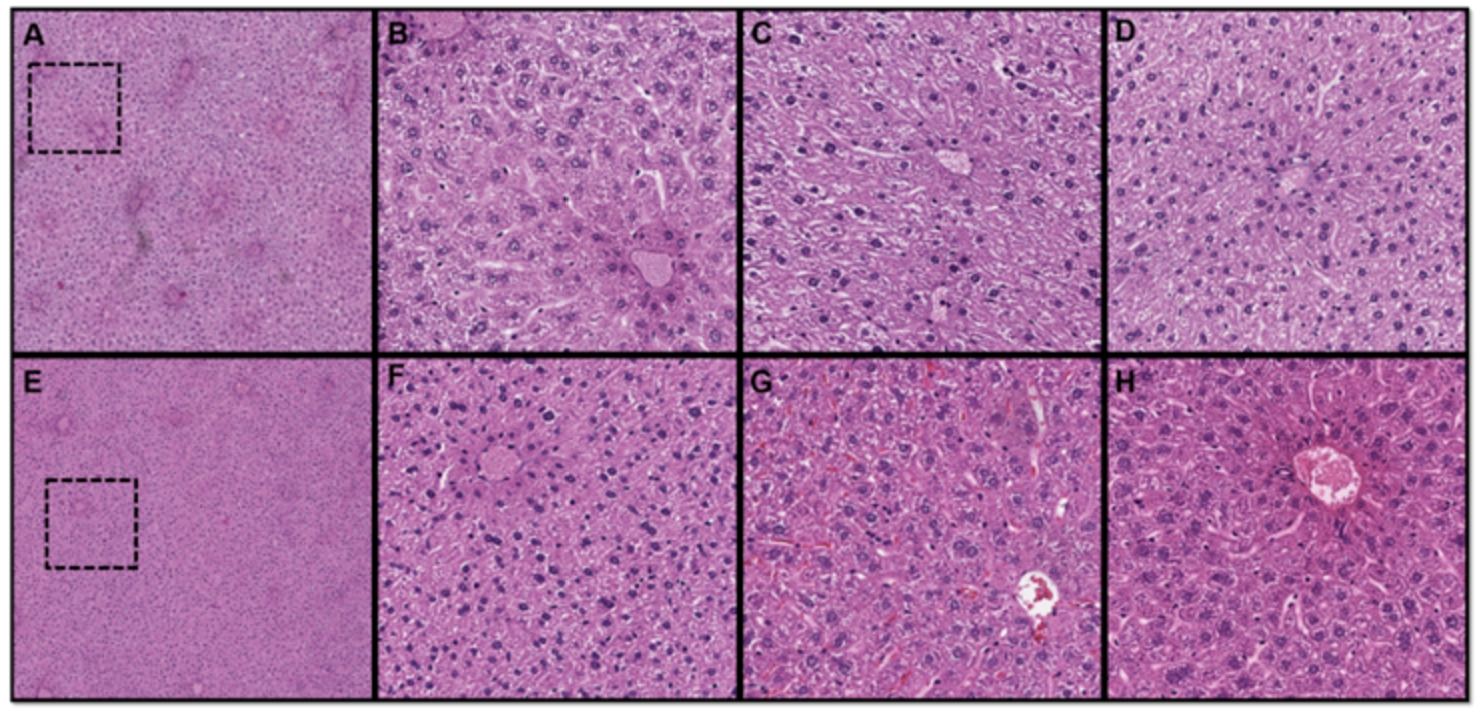
All the boiled samples (Fig. 2, A-D) were histologically similar. The most obvious tissue alterations and at least partial eosinophilia were observed around large portal veins. This indicates that the heat treatment did not last long enough to affect the whole tissue. Thermal damage in tissues induced by microwaves were more homogenous, indicating that the heat effect was distributed more evenly to the whole tissue. The fixated tissues (Fig. 2, G&H) were more evenly eosinophilic through the whole tissue because of the long fixation (72 h). In the formalin (Fig. 2, G), the cell structure of fixated tissue was the best preserved. In ethanol-fixated sample the cell structure was also well preserved, but some cell and nuclei changes were obtained (Fig. 2, H). Because of these, boiling in water was proposed as model to induce coagulation of the tissues.
2.3.Measurement protocol
Ten fresh bovine liver samples were selected from different animals, approximately
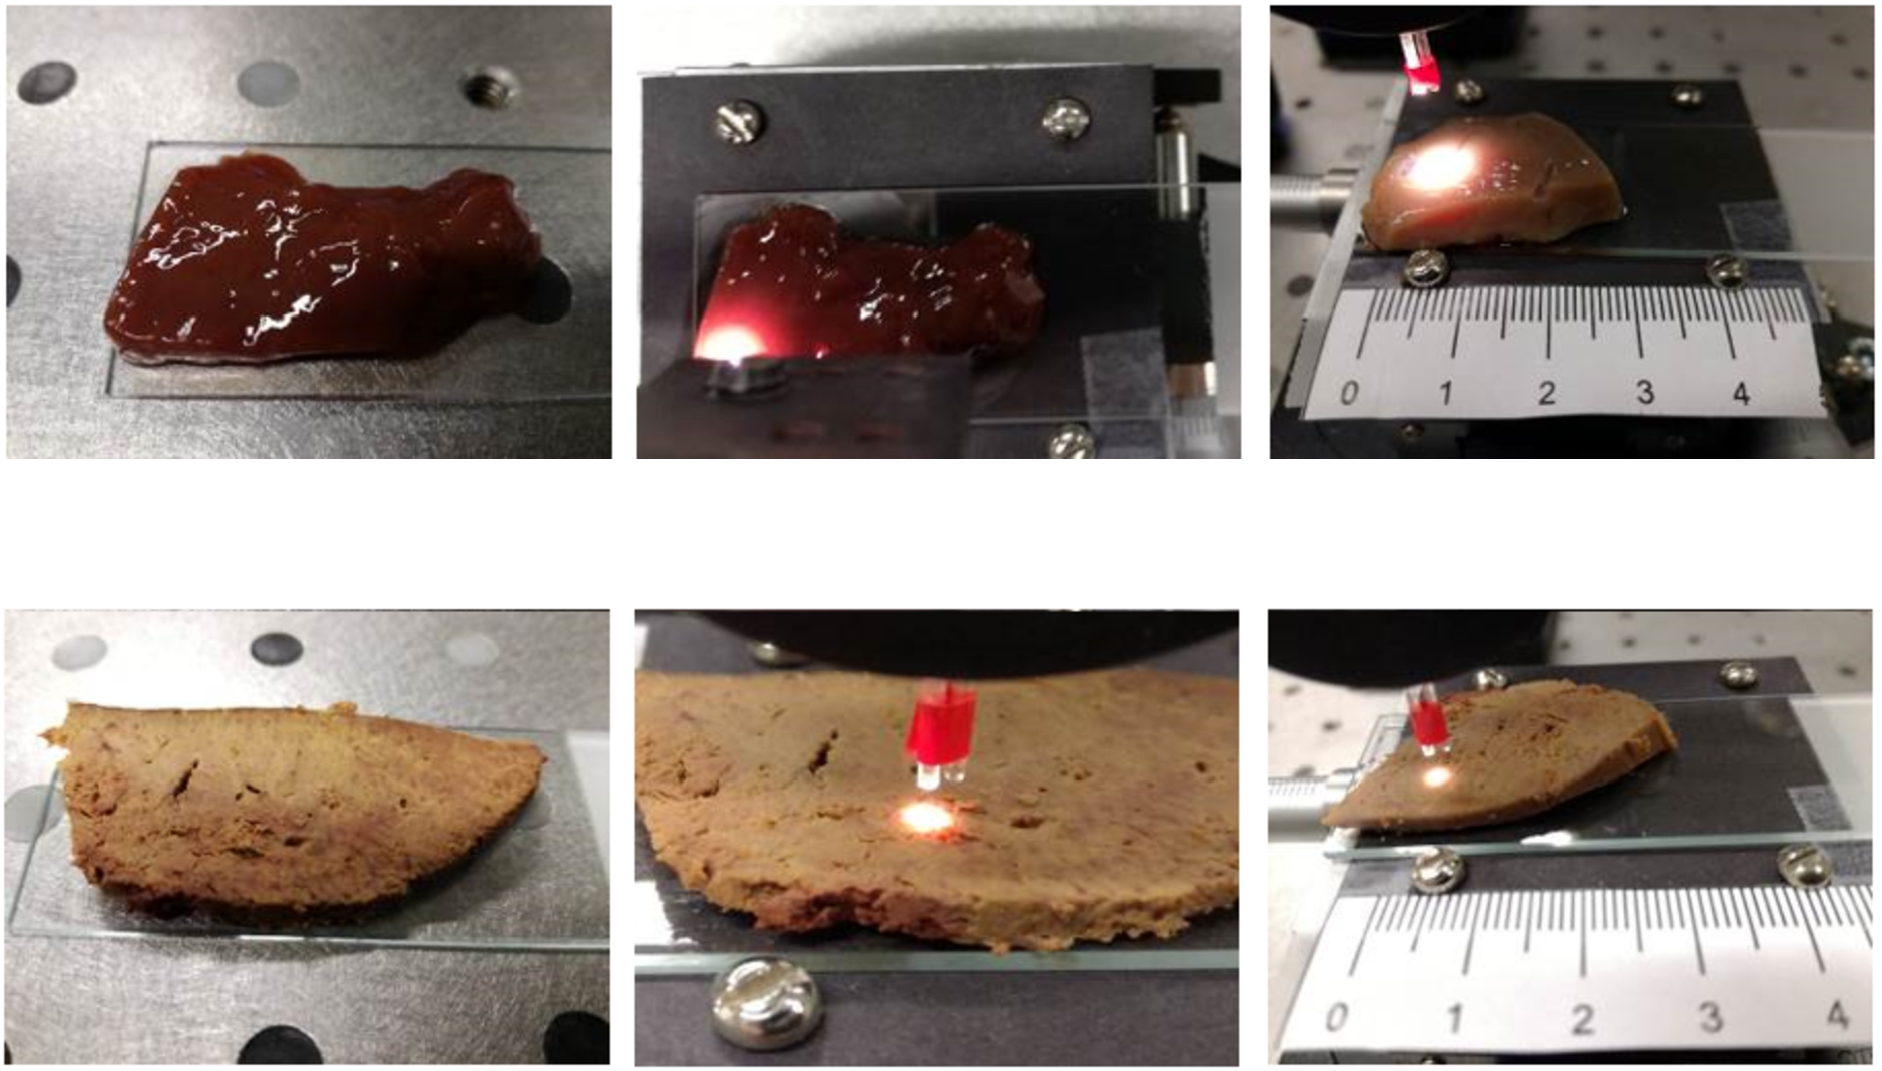
Fig. 3.
Visual differences between measured fresh (top) and boiled (bottom) bovine liver samples. Distance between sample and optical fibers adjusted between 2–3 mm.
2.4.Data analysis and statistical methods
Spectral data is a function of wavelength vs reflectance. In total, there were 1000 independently recorded optical spectra, where each 500 represented fresh and boiled liver model, collected from 10 animals. Data were preprocessed using Matlab to investigate signal features. Dataset of 100 spectra (2 samples) belonging to each group were selected and visualized to understand signal features. No software-based normalization, nor filtering was adapted. Equation (1) was used to calculate sample reflectance on certain wavelength λ, calculations are considering both reference and dark spectrum, which is whole noise produced by measurement equipment on given wavelength. Dark spectrum was independently measured for the purpose of the calculations.
Data analysis was based on investigating three signal features, which were later used to create three classifiers used to differentiate between fresh and boiled bovine liver samples. The classifiers were Euclidean Distance (ED) between each particular spectrum and averaged among given dataset of 100 spectra, Linear Approximation (LA), which interpolated optical spectrum using linear function and Standard Deviation (SD). Signal features were calculated using Matlab built-in functions. However, in case of ED own manual procedure was developed as distance was calculated between each spectrum to average spectrum among dataset [13].
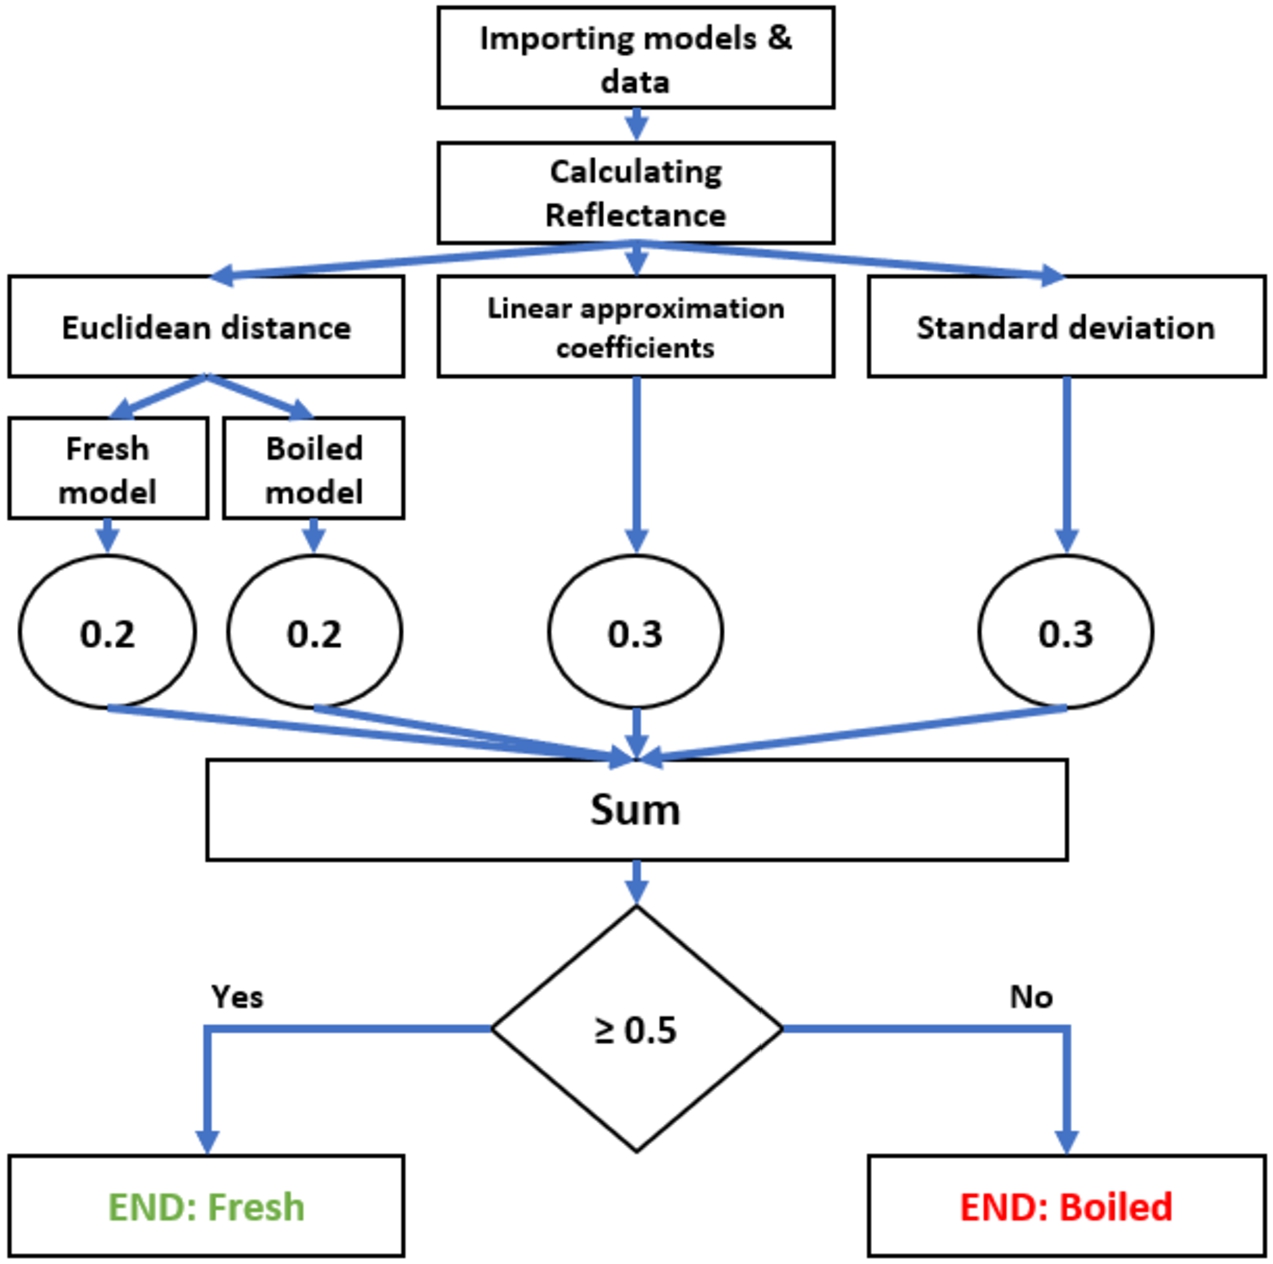
Fig. 4.
Block diagram of created classification algorithm.
2.5.Classification algorithm
Classification was based on automated coefficient extraction from training set. Classification algorithm (Fig. 4) uses threshold coefficients from the training phase, where 50 randomized samples for each class was analyzed. Thresholds were then estimated for each training set (SD, LA) or in accordance to average signals (ED). Classifier decision making starts with importing unknown spectrum, where reflectance is calculated using predefined dark and reference spectrum. There is three step classification performed with previously mentioned classifiers. In case of ED, two sub-steps are included as distance to average fresh and average boiled model is calculated. Linear approximation coefficients from unknown spectra are calculated and compared to the threshold obtained in learning phase. Standard deviation of the signal is calculated and evaluated the same way as in previous step. As they are not evenly impactful for the decision, different weights are distributed among the classifiers. Each of the Euclidean distance as generally weaker classifier obtained values of 0.2, where linear approximation and standard deviation were given score of 0.3. In such configuration two stronger classifiers are able to make decision on their own. In case of uncertainty – Euclidean distance decide about the final outcome. Based on the obtained score unknown signal is placed in one of two classes: fresh or boiled.
3.Results
Significant noise was observed in UV range, as light source was not providing sufficient UV emission. Thus, spectra were restrained to 470–860 nm. Otherwise, whole range considerations would be contaminated with noise peaks and falsely calculated reflectance values. Visualization of 100 fresh and 100 boiled liver spectra are shown of Fig. 5.
Fig. 5.
Visualization of 200 fresh liver spectra (left) and 200 boiled spectra (right).
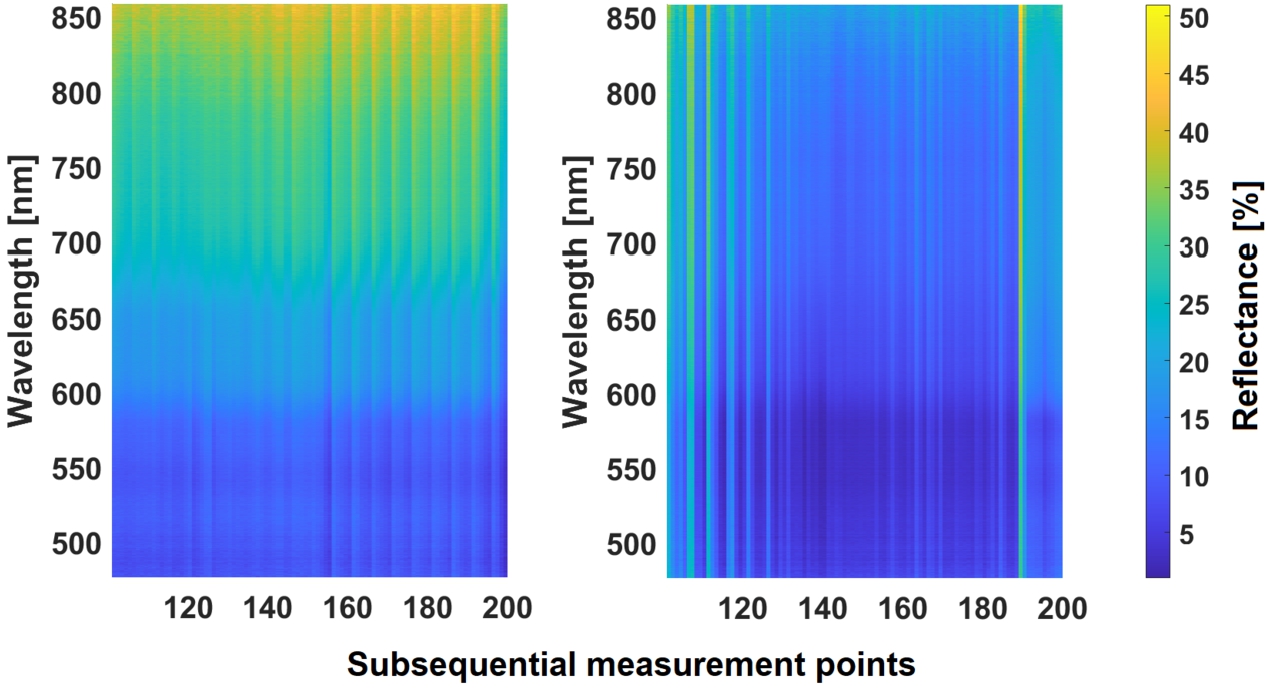
Fig. 6.
Average fresh and boiled spectra calculated among 100 data points.
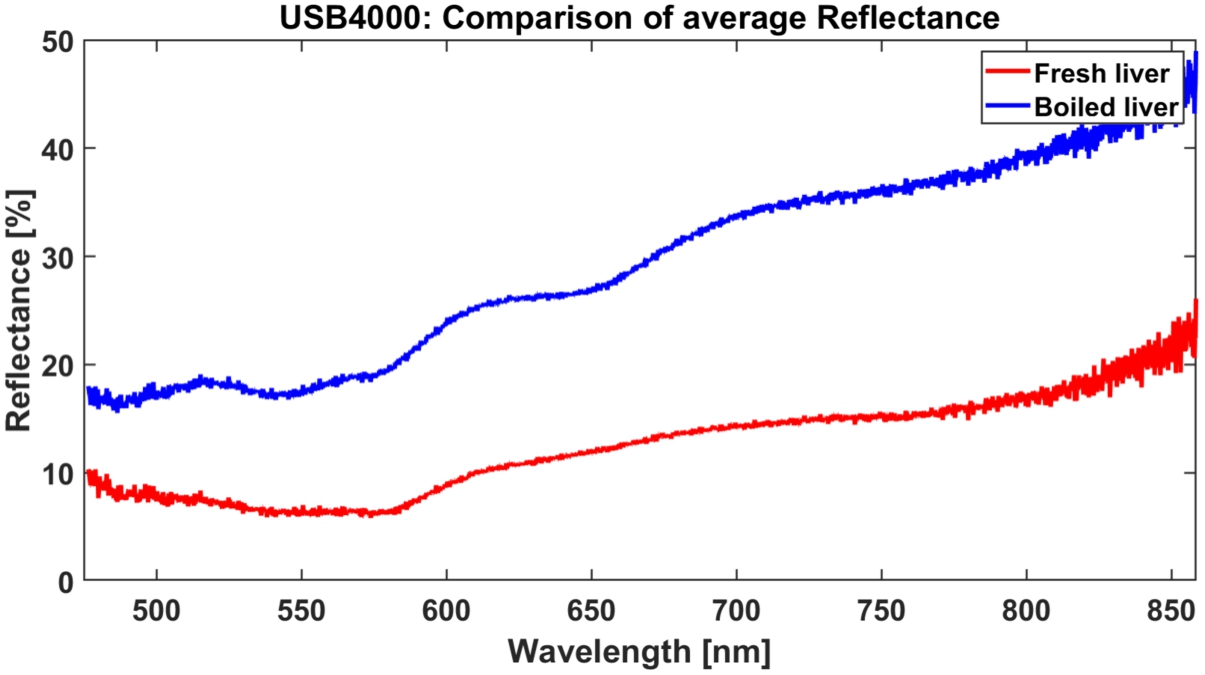
In order to find common features, spectra were averaged among datasets. Average spectra for healthy and boiled tissues were further used during calculation of ED, Fig. 6. There were local maxima observed at 520, 560, 620, 710 nm, and local minima at 540, 580, 640 nm in boiled. Where the spectra of fresh tissues were more plain, local minima were observed at 570 nm and 750 nm. Particular differences on 540 and 580 nm, which are hemoglobin absorption peaks are result of denaturation of tissues induced by heat treatment. Nature of 650 nm dip are mostly likely visual changes (color-related). Treated with temperature the hemoglobin becomes less likely to bind to oxygen and much more likely to unload to into the cells of the tissue, which is present in spectra.
Euclidean distance (ED) between each training data to corresponding averaged spectra (fresh to fresh, thermal damage to thermal damage) is presented on Fig. 7. ED as classifier has a potential for finding the outliers. Distance higher than 1000 points (arbitrary units) were considered potential outliers. ED was considered as a weak classifier as distances are in many cases in similar range between both classes.
Fig. 7.
Euclidean distance to corresponding averaged signals, fresh liver (blue) and thermal damage (red).
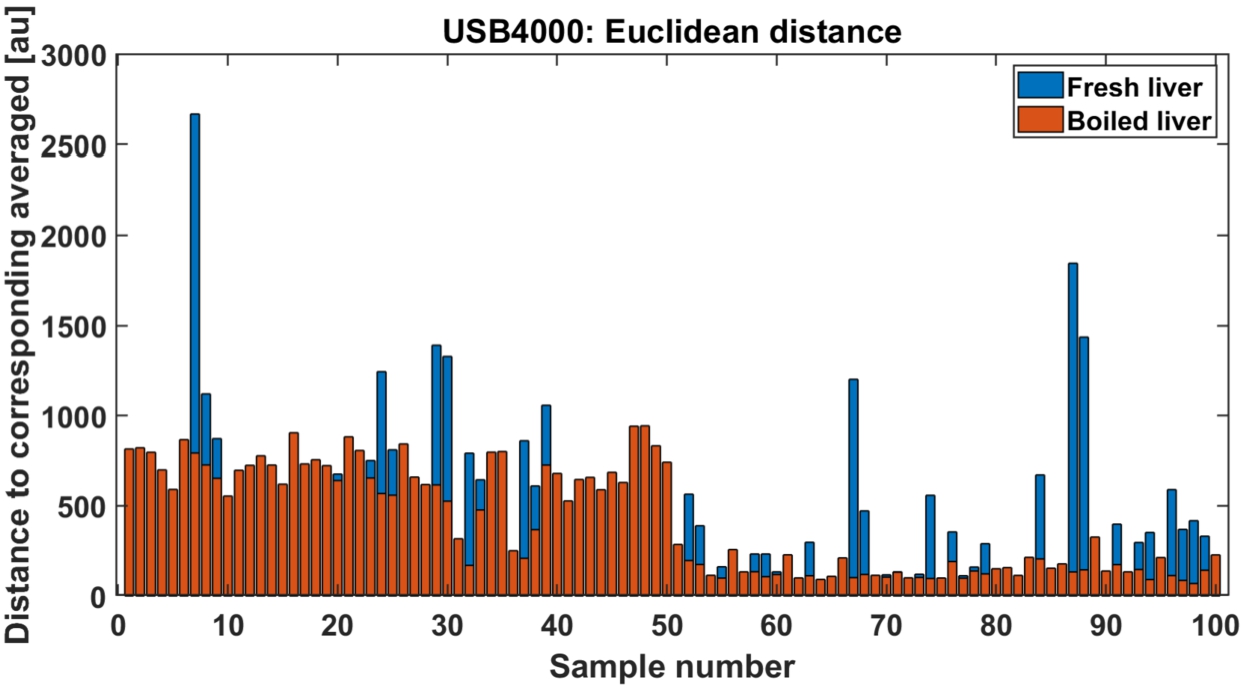
Fig. 8.
Linear approximation (presented in green) of 100 investigated spectra for fresh (left) and boiled liver (right), averaged spectra (red and blue) added for comparison.
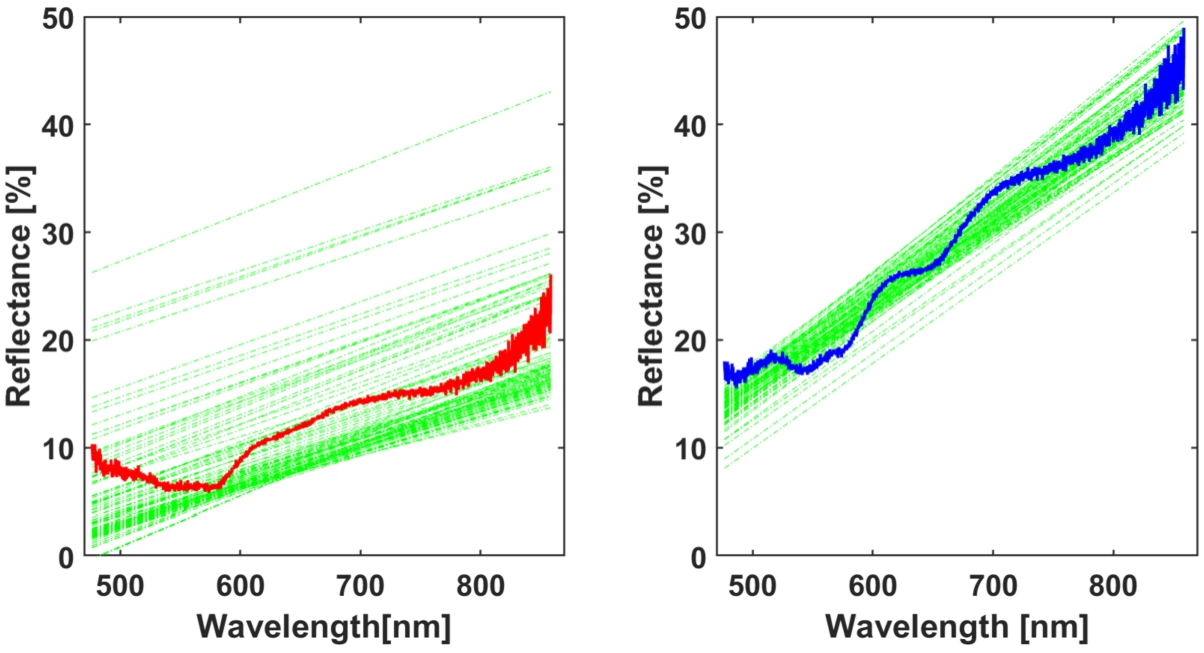
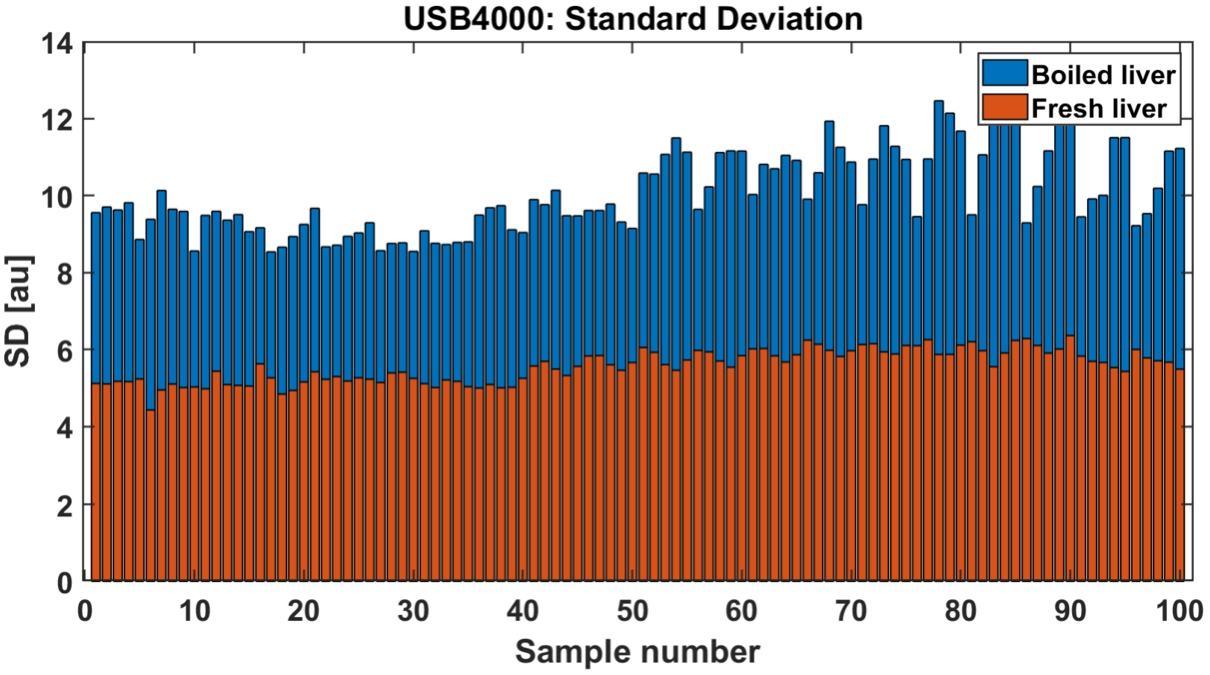
During calculations of linear approximation (Fig. 8) among 100 fresh and 100 boiled liver spectra, α-coefficients (defining slope angle) were extracted to create threshold values, where β-coefficients (defining distance from y-axis) were considered redundant. Averaged signals were added to the figure for reference and are presented in red and blue. In this particular instance, division between classes was clear. Boiled liver samples were more reflective, possibly due to back-scattering. Moreover, peaks on 630 nm and 730 nm appeared in boiled samples, mainly due to change of the color. Slope angle has risen due to overall change of the spectrum as it was calculated in full-range. Figure 9 present threshold levels of standard deviation values between fresh and boiled samples. In here division is also clearly visible. Since clear divisions between classes were observed. SD and LA were considered strong classifiers as threshold levels were significant between two fresh and boiled classes.
Fig. 9.
Standard deviation of each investigated reflectance spectra: fresh (red) and boiled liver (blue).
3.1.Data validation
In order to validate capabilities of thresholding algorithm 10-fold cross-validation was performed on whole dataset, including both untreated control and test model spectra. Beforehand, datasets were shuffled among their classes and divided into 10 groups. Subsequent 450 fresh and 450 thermal coagulation model spectra, from 9 groups, were used as training set. Where, remaining 50 fresh and 50 boiled liver model spectra were used as test data. Among training dataset thresholding coefficients were extracted. Automated classification was performed, and results were stored inside confusion matrix. After classification next folded data of 50 fresh and 50 boiled liver model spectra were used as test data, remaining nine groups (450 spectra each) were considered training data and automated classification was ran once again until reaching 10th iteration. Results were once again saved in confusion matrices.
After reaching last iteration results all confusion matrices were summed up and averaged (Table 1). Final results indicate 99.6% specificity (classification of fresh tissues) and 98.2% of sensitivity (detection of boiled liver).
Table 1
Results of 10-fold cross-validation
| Actual value | ||
| Predicted value | 49.1/50 | 0.9/50 |
| 0.2/50 | 49.8/50 | |
4.Discussion
Previously, DRS was used in 2016 in assessment of in vivo radiofrequency ablations by Tanis et al. in colorectal liver metastases [48] and by Evers et al. [16]. Fanjul-Vélez et al. performed porcine tissue classification using two approaches: principal component analysis and investigation of spectral characteristics in 2020 [17]. Another paper shown that combining DRS with autofluorescence has potential in brain tumor surgical guidance ex vivo [30]. Used analysis model was based on partial least square-linear discriminant analysis (PLS-LDA). Moreover, combination of DRS and fluorescence lifetime measurements in hepatocellular carcinomas in combination with even simple classification algorithms are able to distinguish tumor tissues [14]. Method should be developed further in combination of more advanced machine learning techniques. In order to improve cost efficiency of DRS assistance to biopsy, LED’s could be utilized. As proposed by Keller et al. for illumination two maximal peak wavelength of 470 nm and 515 nm could be even combined to increase sensitivity.
The purpose of our study was to develop a simplified ex vivo tissue coagulation model that could be utilized in the development of the equipment able to detect subtle tissue alterations related to the tissue coagulation that also occurs in the necrosis. Protein denaturation occurs in both thermal damage and in necrosis, while necrosis is much more complicated phenomenon. While denaturation only alters the tissue structure, our hypothesis was that if lesser changes are detectable, then it would be possible to continue on detecting the differences between viable tissue and necrosis. Moreover our intention was to combine DRS with computationally lightweight algorithms, in order to evaluate DRS as a quick, reliable, contactless, and inexpensive alternative in differentiation of biological tissues condition.
Three classifiers were sufficient number for proper classification. ED (or Euclidean metric), despite of being one of the simplest space models, proved useful way to model and investigate signal similarities. Linear approximation was sub-sequential approach to study signal similarity. Simplification of the signal was beneficial computationally. Spectral data was approximated using a linear model and coefficients from two signals were directly used in comparisons between different spectra, especially the slope angle carried valuable information. In order to improve classification rate number of classifiers should be enlarged. Solid improvement would be local maxima and minima analysis. Moreover, partitioning and local slope angles might be tracked. Lastly, more advanced machine learning methods could be applied. However, expanding number of classifiers could extend processing time, which was crucial parameter.
During evaluation of boiled liver models, there were no big differences observed among the dataset. Samples, where tissue coagulation was induced by microwaves were more evenly coagulated. It is possible that effect occurred only because of longer treatment time. The fixated tissues differed from the heated tissues, and this could potentially “contaminate” the spectra. Thus, boiling was proposed as the most suitable and least optically invasive method. Moreover, during evaluation phase it was observed that 2–3 mm distance between probe and tissue did not affect reflectance spectra besides minor decrease of amplitude, which was still greatly above level of detectivity.
Regarding the technology, possibly similar benefits could be obtained with Raman Spectroscopy. Very interesting and promising techniques are based on polarized light [28]. The biggest advantage of current classification method (the algorithm) is its flexibility. With proper adjustments it would be possible to utilize even current version for different purposes in tissue pathology. Differentiation between healthy and tumorous tissue could be the final goal. However, the main challenges in that field are variety of tumour types and building sufficient class databases for successful classification. Future work should concentrate also on detection of tissue damage progression. In the current model only two classes were investigated, which was much simpler to classify.
5.Conclusions
Presence of necrotic tissue is most unwelcome during biopsy. The purpose of the study was to evaluate reliability and consistency of DRS in detection of tissue coagulation, which was proposed as simplified model of necrotic tissue. Utilized optical technique with combination of automated classification algorithm reliably differentiated untreated tissues (98.2%) from boiled liver (99.6%). Our work indicates that DRS is able to detect subtle tissue alterations, suggesting that detection of other tissue alterations, including necrosis, could be possible. More focused research are necessary to support this. Future work should be focused on development of classification algorithm and usage of necrosis instead of the simplified model for final evaluation.
Acknowledgements
The authors are very grateful to MD Ilkka Minkkinen, Ms. Erja Tomperi and Ms. Mirja Mäkeläinen from the Department of Pathology for their skillful assistance with the preparation of the samples.
Conflict of interest
The authors have no conflict of interest to report.
Ethical considerations
The rat used in thermal injury assessment, was euthanized by the Animal Facility of University of Oulu prior to delivery for research, thereby no ethical permissions were needed. Fresh bovine liver tissue was commercially available.
References
[1] | S. Akter, M.G. Hossain, I. Nishidate, H. Hazama and K. Awazu, Medical applications of reflectance spectroscopy in the diffusive and sub-diffusive regimes, Journal of Near Infrared Spectroscopy 26: (6) ((2018) ), 337–350. doi:10.1177/0967033518806637. |
[2] | S. Anand, N. Sujatha, V. Narayanamurthy, V. Seshadri and R. Poddar, Diffuse reflectance spectroscopy for monitoring diabetic foot ulcer – A pilot study, Optics and Lasers in Engineering 53: ((2014) ), 1–5. doi:10.1016/j.optlaseng.2013.07.020. |
[3] | E.J. Baltussen, P. Snæbjörnsson, S.G.B. De Koning, H.J. Sterenborg, A.G. Aalbers, N. Kok, G.L. Beets, B.H. Hendriks, K.F. Kuhlmann and T.J. Ruers, Diffuse reflectance spectroscopy as a tool for real-time tissue assessment during colorectal cancer surgery, Journal of Biomedical Optics 22: (10) ((2017) ), 106014. doi:10.1117/1.JBO.22.10.106014. |
[4] | R.F. Barajas Jr., J.S. Chang, M.R. Segal, A.T. Parsa, M.W. McDermott, M.S. Berger and S. Cha, Differentiation of recurrent glioblastoma multiforme from radiation necrosis after external beam radiation therapy with dynamic susceptibility-weighted contrast-enhanced perfusion MR imaging, Radiology 253: (2) ((2009) ), 486. doi:10.1148/radiol.2532090007. |
[5] | S. Bohr, S.J. Patel, D. Sarin, D. Irimia, M.L. Yarmush and F. Berthiaume, Resolvin D 2 prevents secondary thrombosis and necrosis in a mouse burn wound model, Wound Repair and Regeneration 21: (1) ((2013) ), 35–43. doi:10.1111/j.1524-475X.2012.00853.x. |
[6] | G. Bredholt, M. Mannelqvist, I.M. Stefansson, E. Birkeland, T.H. Bø, A.M. Øyan, J. Trovik, K.-H. Kalland, I. Jonassen, H.B. Salvesen et al., Tumor necrosis is an important hallmark of aggressive endometrial cancer and associates with hypoxia, angiogenesis and inflammation responses, Oncotarget 6: (37) ((2015) ), 39676. doi:10.18632/oncotarget.5344. |
[7] | T.M. Bydlon, R. Nachabé, N. Ramanujam, H.J. Sterenborg and B.H. Hendriks, Chromophore based analyses of steady-state diffuse reflectance spectroscopy: Current status and perspectives for clinical adoption, Journal of Biophotonics 8: (1–2) ((2015) ), 9–24. doi:10.1002/jbio.201300198. |
[8] | B. Chen, Y. Zhang, S. Gao and D. Li, Extraction of the structural properties of skin tissue via diffuse reflectance spectroscopy: An inverse methodology, Sensors 21: (11) ((2021) ), 3745. doi:10.3390/s21113745. |
[9] | Z. Darzynkiewicz, G. Juan, X. Li, W. Gorczyca, T. Murakami and F. Traganos, Cytometry in cell necrobiology: Analysis of apoptosis and accidental cell death (necrosis), Cytometry: The Journal of the International Society for Analytical Cytology 27: (1) ((1997) ), 1–20. doi:10.1002/(SICI)1097-0320(19970101)27:1<1::AID-CYTO2>3.0.CO;2-L. |
[10] | L.L. De Boer, T.M. Bydlon, F. Van Duijnhoven, M.-J.T. Vranken Peeters, C.E. Loo, G.A. Winter-Warnars, J. Sanders, H.J. Sterenborg, B.H. Hendriks and T.J. Ruers, Towards the use of diffuse reflectance spectroscopy for real-time in vivo detection of breast cancer during surgery, Journal of Translational Medicine 16: (1) ((2018) ), 1–14. doi:10.1186/s12967-017-1374-6. |
[11] | K. Dev, U. Dinish, S. Chakraborty, R. Bi, S. Andersson-Engels, S. Sugii and M. Olivo, Quantitative in vivo detection of adipose tissue browning using diffuse reflectance spectroscopy in near-infrared II window, Journal of Biophotonics 11: (12) ((2018) ), 201800135. doi:10.1002/jbio.201800135. |
[12] | P.M. Diaz, S.V. Jenkins, K. Alhallak, D. Semeniak, R.J. Griffin, R.P. Dings and N. Rajaram, Quantitative diffuse reflectance spectroscopy of short-term changes in tumor oxygenation after radiation in a matched model of radiation resistance, Biomedical Optics Express 9: (8) ((2018) ), 3794–3804. doi:10.1364/BOE.9.003794. |
[13] | I. Dokmanic, R. Parhizkar, J. Ranieri and M. Vetterli, Euclidean distance matrices: Essential theory, algorithms, and applications, IEEE Signal Processing Magazine 32: (6) ((2015) ), 12–30. doi:10.1109/MSP.2015.2398954. |
[14] | V. Dremin, E. Potapova, E. Zherebtsov, K. Kandurova, V. Shupletsov, A. Alekseyev, A. Mamoshin and A. Dunaev, Optical percutaneous needle biopsy of the liver: A pilot animal and clinical study, Scientific Reports 10: (1) ((2020) ), 1–11. doi:10.1038/s41598-019-56847-4. |
[15] | M. Duperron, K. Grygoryev, G. Nunan, C. Eason, J. Gunther, R. Burke, K. Manley and P. O’Brien, Diffuse reflectance spectroscopy-enhanced drill for bone boundary detection, Biomedical Optics Express 10: (2) ((2019) ), 961–977. doi:10.1364/BOE.10.000961. |
[16] | D. Evers, R. Nachabe, D. Hompes, F. Van Coevorden, G. Lucassen, B. Hendriks, M.-L. van Velthuysen, J. Wesseling and T. Ruers, Optical sensing for tumor detection in the liver, European Journal of Surgical Oncology (EJSO) 39: (1) ((2013) ), 68–75. doi:10.1016/j.ejso.2012.08.005. |
[17] | F. Fanjul-Vélez, S. Pampín-Suárez and J.L. Arce-Diego, Application of classification algorithms to diffuse reflectance spectroscopy measurements for ex vivo characterization of biological tissues, Entropy 22: (7) ((2020) ), 736. doi:10.3390/e22070736. |
[18] | J. Folkman and M. Klagsbrun, Angiogenic factors, Science 235: (4787) ((1987) ), 442–447. doi:10.1126/science.2432664. |
[19] | T. Han, N. Khavanin, J. Wu, M. Zang, S. Zhu, B. Chen, S. Li, Y. Liu and J.M. Sacks, Indocyanine green angiography predicts tissue necrosis more accurately than thermal imaging and near-infrared spectroscopy in a rat perforator flap model, Plastic and Reconstructive Surgery 146: (5) ((2020) ), 1044–1054. doi:10.1097/PRS.0000000000007278. |
[20] | A. Iorga, L. Dara and N. Kaplowitz, Drug-induced liver injury: Cascade of events leading to cell death, apoptosis or necrosis, International Journal of Molecular Sciences 18: (5) ((2017) ), 1018. doi:10.3390/ijms18051018. |
[21] | A. Ito, H. Honda and T. Kobayashi, Cancer immunotherapy based on intracellular hyperthermia using magnetite nanoparticles: A novel concept of “heat-controlled necrosis” with heat shock protein expression, Cancer Immunology, Immunotherapy 55: ((2006) ), 320–328. doi:10.1007/s00262-005-0049-y. |
[22] | K. Joshi, D. Goyary, B. Mazumder, P. Chattopadhyay, R. Chakraborty, Y. Bhutia, S. Karmakar and S.K. Dwivedi, Frostbite: Current status and advancements in therapeutics, Journal of Thermal Biology 93: ((2020) ), 102716. doi:10.1016/j.jtherbio.2020.102716. |
[23] | A.M. Jubb, F.M. Buffa and A.L. Harris, Assessment of tumour hypoxia for prediction of response to therapy and cancer prognosis, Journal of Cellular and Molecular Medicine 14: (1–2) ((2010) ), 18–29. doi:10.1111/j.1582-4934.2009.00944.x. |
[24] | P. Karthikeyan, S. Moradi, H. Ferdinando, Z. Zhao and T. Myllylä, Optics based label-free techniques and applications in brain monitoring, Applied Sciences 10: (6) ((2020) ), 2196. doi:10.3390/app10062196. |
[25] | A. Keller, P. Bialecki, T.J. Wilhelm and M.K. Vetter, Diffuse reflectance spectroscopy of human liver tumor specimens-towards a tissue differentiating optical biopsy needle using light emitting diodes, Biomedical Optics Express 9: (3) ((2018) ), 1069–1081. doi:10.1364/BOE.9.001069. |
[26] | S. Koljenović, L.-P. Choo-Smith, T.C. Bakker Schut, J.M. Kros, H.J. van den Berge and G.J. Puppels, Discriminating vital tumor from necrotic tissue in human glioblastoma tissue samples by Raman spectroscopy, Laboratory Investigation 82: (10) ((2002) ), 1265–1277. doi:10.1097/01.LAB.0000032545.96931.B8. |
[27] | D.V. Krysko, T.V. Berghe, K. D’Herde and P. Vandenabeele, Apoptosis and necrosis: Detection, discrimination and phagocytosis, Methods 44: (3) ((2008) ), 205–221. doi:10.1016/j.ymeth.2007.12.001. |
[28] | B. Kunnen, C. Macdonald, A. Doronin, S. Jacques, M. Eccles and I. Meglinski, Application of circularly polarized light for non-invasive diagnosis of cancerous tissues and turbid tissue-like scattering media, Journal of Biophotonics 8: (4) ((2015) ), 317–323. doi:10.1002/jbio.201400104. |
[29] | S. Li, S. Chien and P.-I. Brånemark, Heat shock-induced necrosis and apoptosis in osteoblasts, Journal of Orthopaedic Research 17: (6) ((1999) ), 891–899. doi:10.1002/jor.1100170614. |
[30] | H. Lu, K. Grygoryev, N. Bermingham, M. Jansen, M. O’Sullivan, G. Nunan, K. Buckley, K. Manley, R. Burke and S. Andersson-Engels, Combined autofluorescence and diffuse reflectance for brain tumour surgical guidance: Initial ex vivo study results, Biomedical Optics Express 12: (4) ((2021) ), 2432–2446. doi:10.1364/BOE.420292. |
[31] | K. Madhan and S. Raju, Comparative histology of human and cow, goat and sheep liver, Journal of Surgical Academia 4: (1) ((2014) ), 10–13. |
[32] | A. Mariani, W. Kwiecinski, M. Pernot, D. Balvay, M. Tanter, O. Clement, C. Cuenod and F. Zinzindohoue, Real time shear waves elastography monitoring of thermal ablation: In vivo evaluation in pig livers, Journal of Surgical Research 188: (1) ((2014) ), 37–43. doi:10.1016/j.jss.2013.12.024. |
[33] | I. Martinic, S.V. Eliseeva, T.N. Nguyen, V.L. Pecoraro and S. Petoud, Near-infrared optical imaging of necrotic cells by photostable lanthanide-based metallacrowns, Journal of the American Chemical Society 139: (25) ((2017) ), 8388–8391. doi:10.1021/jacs.7b01587. |
[34] | F. Menzella, M. Lusuardi, C. Galeone, G. Montanari, A. Cavazza and N. Facciolongo, Heat-induced necrosis after bronchial thermoplasty: A new concern?, Allergy, Asthma & Clinical Immunology 14: (1) ((2018) ), 1–5. doi:10.1186/s13223-017-0225-6. |
[35] | M. Midia, D. Odedra, A. Shuster, R. Midia and J. Muir, Predictors of bleeding complications following percutaneous image-guided liver biopsy: A scoping review, Diagnostic and Interventional Radiology 25: (1) ((2019) ), 71. doi:10.5152/dir.2018.17525. |
[36] | E. Mladenov, S. Magin, A. Soni and G. Iliakis, DNA double-strand break repair as determinant of cellular radiosensitivity to killing and target in radiation therapy, Frontiers in Oncology 3: ((2013) ), 113. |
[37] | T. Myllylä, P. Karthikeyan, U. Honka, V. Korhonen, S.S. Karhula and J. Nikkinen, Cerebral haemodynamic effects in the human brain during radiation therapy for brain cancer, in: Tissue Optics and Photonics, Vol. 11363: , SPIE, (2020) , pp. 14–19. |
[38] | M. Nikfarjam, V. Muralidharan and C. Christophi, Mechanisms of focal heat destruction of liver tumors, Journal of Surgical Research 127: (2) ((2005) ), 208–223. doi:10.1016/j.jss.2005.02.009. |
[39] | M.S. Nogueira, M. Raju, J. Gunther, K. Grygoryev, K. Komolibus, H. Lu and S. Andersson-Engels, Diffuse reflectance spectroscopy for determination of optical properties and chromophore concentrations of mice internal organs in the range of 350 nm to 1860 nm, in: Biophotonics: Photonic Solutions for Better Health Care VI, Vol. 10685: , SPIE, (2018) , pp. 520–539. |
[40] | D. Piao, N. Sultana, G.R. Holyoak, J.W. Ritchey, C.R. Wall, J.K. Murray and K.E. Bartels, In vivo assessment of diet-induced rat hepatic steatosis development by percutaneous single-fiber spectroscopy detects scattering spectral changes due to fatty infiltration, Journal of Biomedical Optics 20: (11) ((2015) ), 117002. doi:10.1117/1.JBO.20.11.117002. |
[41] | G. Qu, S. Liu, S. Zhang, L. Wang, X. Wang, B. Sun, N. Yin, X. Gao, T. Xia, J.-J. Chen et al., Graphene oxide induces toll-like receptor 4 (TLR4)-dependent necrosis in macrophages, ACS Nano 7: (7) ((2013) ), 5732–5745. doi:10.1021/nn402330b. |
[42] | N. Reistad, J.H. Nilsson, M. Bergenfeldt, P. Rissler and C. Sturesson, Intraoperative liver steatosis characterization using diffuse reflectance spectroscopy, HPB 21: (2) ((2019) ), 175–180. doi:10.1016/j.hpb.2018.06.1809. |
[43] | E.J.A. Romeu, J.D.R. Fernández, K.R. Tort, A. Valor, G. Escobedo, D.A.F. Bustos, S. Stolik, J.M. de la Rosa and C. Guzmán, Combined methods of optical spectroscopy and artificial intelligence in the assessment of experimentally induced non-alcoholic fatty liver, Computer Methods and Programs in Biomedicine 198: ((2021) ), 105777. doi:10.1016/j.cmpb.2020.105777. |
[44] | D. Schneidereit, A. Bröllochs, P. Ritter, L. Kreiß, Z. Mokhtari, A. Beilhack, G. Krönke, J.A. Ackermann, M. Faas, A. Grüneboom et al., An advanced optical clearing protocol allows label-free detection of tissue necrosis via multiphoton microscopy in injured whole muscle, Theranostics 11: (6) ((2021) ), 2876. doi:10.7150/thno.51558. |
[45] | J.W. Spliethoff, W. Prevoo, M.A. Meier, J. de Jong, H.M. Klomp, D.J. Evers, H.J. Sterenborg, G.W. Lucassen, B.H. Hendriks and T.J. Ruers, Real-time in vivo tissue characterization with diffuse reflectance spectroscopy during transthoracic lung biopsy: A clinical feasibility study biopsy guidance by diffuse reflectance spectroscopy, Clinical Cancer Research 22: (2) ((2016) ), 357–365. doi:10.1158/1078-0432.CCR-15-0807. |
[46] | B.A. Standish, K.K. Lee, X. Jin, A. Mariampillai, N.R. Munce, M.F. Wood, B.C. Wilson, I.A. Vitkin and V.X. Yang, Interstitial Doppler optical coherence tomography as a local tumor necrosis predictor in photodynamic therapy of prostatic carcinoma: An in vivo study, Cancer Research 68: (23) ((2008) ), 9987–9995. doi:10.1158/0008-5472.CAN-08-1128. |
[47] | M. Stranc, M. Sowa, B. Abdulrauf and H. Mantsch, Assessment of tissue viability using near-infrared spectroscopy, British Journal of Plastic Surgery 51: (3) ((1998) ), 210–217. doi:10.1054/bjps.1997.0088. |
[48] | E. Tanis, J.W. Spliethoff, D.J. Evers, G.C. Langhout, P. Snaebjornsson, W. Prevoo, B.H. Hendriks and T.J. Ruers, Real-time in vivo assessment of radiofrequency ablation of human colorectal liver metastases using diffuse reflectance spectroscopy, European Journal of Surgical Oncology (EJSO) 42: (2) ((2016) ), 251–259. doi:10.1016/j.ejso.2015.12.005. |
[49] | A. Tata, M. Woolman, M. Ventura, N. Bernards, M. Ganguly, A. Gribble, B. Shrestha, E. Bluemke, H.J. Ginsberg, A. Vitkin et al., Rapid detection of necrosis in breast cancer with desorption electrospray ionization mass spectrometry, Scientific Reports 6: (1) ((2016) ), 1–10. doi:10.1038/s41598-016-0001-8. |
[50] | B. Tetu, J.Y. Ro and A.G. Ayala, Large cell calcifying Sertoli cell tumor of the testis: A clinicopathologic, immunohistochemical, and ultrastructural study of two cases, American Journal of Clinical Pathology 96: (6) ((1991) ), 717–722. doi:10.1093/ajcp/96.6.717. |
[51] | P. Vassalli, The pathophysiology of tumor necrosis factors, Annual Review of Immunology 10: ((1992) ), 411–452. doi:10.1146/annurev.iy.10.040192.002211. |
[52] | S. Voulgarelis, F. Fathi, A.G. Stucke, K.D. Daley, J. Kim, M.A. Zimmerman, J.C. Hong, N. Starkey, K.P. Allen and B. Yu, Evaluation of visible diffuse reflectance spectroscopy in liver tissue: Validation of tissue saturations using extracorporeal circulation, Journal of Biomedical Optics 26: (5) ((2021) ), 055002. doi:10.1117/1.JBO.26.5.055002. |
[53] | L. Wiechmann and H.M. Kuerer, The molecular journey from ductal carcinoma in situ to invasive breast cancer, Cancer 112: (10) ((2008) ), 2130–2142. doi:10.1002/cncr.23430. |


