
Portable NMR for the investigation of models of mammographic density ex vivo: Androgens antagonise the promotional effect of oestrogen
Abstract
Background:
Increased mammographic density (MD) is a strong and independent risk factor for breast cancer. Lifetime oestrogenic exposure is associated with increased MD, however androgenic effects on MD have not been widely investigated.
Methods:
We studied the effect of
Results:
We observed an upward trend in explants treated with E2 alone in 3/6 cases, an effect which appeared to be somewhat influenced by menopausal status. Co-treatment of E2 with the AR agonists DHT or Enobosarm however effected a downward trend in regards to MD. E2 significantly upregulated the ER regulated genes (ERGs) CELSR2 and
Conclusions:
Collectively, these findings supports the utility of single-sided Portable NMR for the measurement of MD in explanted human mammary tissue to detect MD change in response to exogenous hormone treatments. A mechanism through which activation of AR may reduce MD as a potential mechanism for reducing breast cancer risk associated to high MD is discussed.
Abbreviations
AR | androgen receptor |
ARGs | androgen-regulated genes |
DHEA(S) | dehydroepiandrosterone (sulphate) |
DHT | |
GEE | generalised estimated equation |
E2 | |
ETH | 0.00001% ethanol control |
ER | oestrogen receptor |
ERGs | E2-regulated genes |
HMD | (regions of) high mammographic density |
HR | regulatory hormone receptor |
IHC | immunohistochemistry |
LMD | (regions of) low mammographic density |
MD | mammographic density |
(c)MHT | (combined) menopause hormonal therapy |
NMR | Nuclear Magnetic Resonance |
PDE | patient-derived explant |
PR | progesterone receptor |
PRGs | progesterone-regulated genes |
SARM | selective androgen receptor modulator |
T | testosterone |
WT | wild type |
1.Introduction
Breast fibroglandular tissue (epithelium and stroma) can attenuate x-rays and appear light on a mammogram; this light, radio-opaque area is known as mammographic density (MD) [6]. When adjusted for age and body mass index, MD is a strong and independent risk factor for breast cancer – women with breasts in the upper MD quartile (75% or more dense tissue area) are at 4- to 6-fold greater risk of breast cancer compared to women in the lowest MD quartile [6,18,39]. Assessment of MD complements other well-established breast cancer risk factors including multi-generational family history, polygenic risk scores, high risk mutations, family history, parity / breastfeeding, age at menarche, and age at first childbirth [29].
Female sex hormone (oestrogen, progesterone) exposure is strongly correlated with MD [20,23,36]. MD fluctuates during the menstrual cycle due to the periodic changes of endogenous sex hormone production from the ovaries [8,30,57]. Menopause decreases MD because of reduced sex hormone levels [9]. Menopause hormonal therapy (MHT), especially formulations containing an oestrogen and a synthetic progestogen (progestin) (e.g. Medroxyprogesterone [MPA] and Norethisterone acetate [NETA]), can increase MD and sustain density at a high level, consequently increasing breast cancer risk [4,10,21,26,46]. Breast cancer risk associated with progestin-containing MHT disappears after adjustment for treatment-induced changes in MD, indicating that an increase in MD with combined MHT (cMHT) is an intermediate surrogate marker of breast cancer risk [10].
Androgens are another type of sex hormone found in women and the androgen receptor (AR) is expressed in luminal epithelia of normal mammary tissues [24]. AR activity is required to inhibit breast development in males and its anti-estrogenic, anti-proliferative activity in normal and malignant female breast tissues indicates a tumour suppressor role [17,25]. However, the effect of AR signalling on MD is unknown. Only one study has evaluated AR expression in the context of mammographic density; Sartor et al. reported that high MD (HMD) was associated with AR-negative breast tumours, although evidence for this association was considered weak [48].
Testosterone (T) and
To date, exploration of androgenic effects on MD have mainly focused on serum androgens; as yet no prospective randomised trial to study MD reduction with androgenic treatment in women has been performed. Relationships between MD and levels of different types of circulating androgens, including testosterone (total and free), androstenedione, dehydroepiandrosterone (DHEA) and DHEA sulphate (DHEAS) have been widely studied, but the results are conflicting and potentially confounded by conversion of circulating androgens to oestrogens [1,5,16,38,41]. Thus, the direct effect of androgen on MD is still unclear.
The suitability of single-sided Portable NMR for compositional and microstructural profiling of biological tissues has been well-demonstrated [7,56]. We have previously demonstrated that single-sided Portable NMR measurements of MD of patient-derived explants (PDEs) in vitro closely correlate with the MD measured by MicroCT and X-ray mammography [2,3,32,54], and Portable NMR measurements in healthy human volunteers in vivo enabled depth profiling of MD within the breast [40]. We have also used Portable NMR to accurately measure MD in PDEs of human breast tissue cultured ex vivo over two weeks [33]. To study the effect of AR signalling on MD, we tested the effects of DHT and Enobosarm and utilised Portable NMR measurements to monitor MD change. The hormonal mechanism regulating MD change was also investigated by analysing hormone receptors and their respective downstream signalling molecules at the mRNA and protein level.
2.Materials and methods
2.1.Patient cohort
Human breast tissue specimens surplus to pathology needs and with no evidence of malignancy were accrued from prophylactic mastectomy surgeries, primarily in women with high BC risk as determined by family history of breast cancer and/or contralateral benign or malignant disease. Six females (2 postmenopausal, 4 premenopausal) were included in this study, equally divided in regards to BRCA 1 or BRCA 2 mutation, or WT status, and ranged in age from 27 to 48, with the average age being 38 years old. Information about the patient cohort and sample treatments is summarised in Table 1.
Table 1
Patient demographics and summary of the PDE treatments. Treatment abbreviations: ethanol control (ETH), oestradiol (E2), enobosarm (SARM), dihydrotestosterone (DHT)
| Patient ID | Age | Menstrual status | BRCA1/2 pathogenic variant status | BI-RADS | PDE treatments |
| PAH032M | 48 | Postmenopausal | WT | 3 | ETH |
| E2 | |||||
| E2 plus SARM | |||||
| E2 plus DHT | |||||
| PAH037M | 27 | Premenopausal | BRCA1+ | unknown | ETH |
| E2 | |||||
| E2 plus SARM | |||||
| E2 plus DHT | |||||
| PAH040M | 48 | Postmenopausal | WT | 4 | ETH |
| E2 | |||||
| PAH043M | 33 | Premenopausal | WT | 3 | ETH |
| E2 | |||||
| E2 plus SARM | |||||
| E2 plus DHT | |||||
| PAH044M | 36 | Premenopausal | BRCA2+ | 2 | ETH |
| E2 | |||||
| E2 plus SARM | |||||
| E2 plus DHT | |||||
| PAH045M | 34 | Premenopausal | BRCA1+ | 2 | ETH |
| E2 | |||||
| E2 plus SARM | |||||
| E2 plus DHT |
Outline of the study design can be viewed in Supplementary Fig. 1. Resected breast tissue was placed on ice and taken from surgery to the Pathology Department at Princess Alexandra Hospital, cut into approximately 1 cm thick slices, and checked for lesions by qualified pathologists (Dr Linda Shen and Dr Simone Birch). Up to 3 slices per patient were obtained and used in this project. Some tissues were immediately processed for downstream analyses and some were delegated to culture as PDEs. This study was approved by the Metro South Hospital and Health Services, Queensland (HREC/16/QPAH/107) and Queensland University of Technology (1600000261).
2.2.Ex vivo culture of patient-derived explants of normal human breast tissue
Mammography was used to determine high, medium (defined as a mixture of low and high MD) or low MD regions of the mammary slices as interpreted by the clinical radiologist (TL). PDEs were cultured ex vivo as previously described [12,33]. Briefly, medium MD regions (used to allow observations of both increased or decreased MD) were cut into smaller pieces of approximately 0.5 cm3 in size and 1-2 pieces randomly placed onto a gelatin sponge scaffold (Spongostan dental sponge, Ark Health, Australia), which was semi-submerged in basal media (phenol red-free RPMI containing 10% charcoal-stripped foetal bovine serum (FBS; ThermoFisher Scientific, Australia), 1 x penicillin and streptomycin (Merck, Australia), 100 μg/mL hydrocortisone (Merck, Australia) and 100 μg/mL insulin (Merck, Australia)) in a well of a 24-well culture plate. For hormonal treatments, basal media was supplemented with ETH control (0.00001% ethanol (Sigma-Aldrich), or 1nM E2 (Merck, Australia), 1 nM E2 plus 100 nM Enobosarm (GTx-024, a gift from TE Hickey) or 1 nM E2 plus 100nM DHT (Sigma). PDEs were first cultured in the basal medium for 36 hrs to allow tissue equilibration to culture, then treated and maintained for up to 2 weeks, a technique has been shown to sustain tissue viability and hormone responsiveness [33]. Media and treatments were replenished twice weekly. Explant-specific PDE treatments are summarised in Table 1.
2.3.Portable NMR measurements
Individual PDEs were removed from the underlying sponge and placed in a well within a dry 24 well plate for Portable NMR measurements using a PM5 or PM25 NMR-MOUSE instrument (Magritek, Aachen, Germany) at day 0 (baseline) and day 14 (endpoint). For all treatments, the relative tissue water and fat contents of these explants were measured from the
2.4.RNA extraction and RT-qPCR
At endpoint, cultured PDEs were cut in half for RNA isolation or fixation and immunohistochemistry. The tissue for RNA extraction was firstly homogenised in TRIzol (Ambion, Life Technologies) using a Qiagen Tissue Lyser II with pre-autoclaved tungsten carbide beads (Qiagen). Bioline RNA extraction set (Catalog no. BIO-52075) was used for RNA isolation, and purified RNA quantitated and validated using spectrophotometry (NanoDrop 2000/2000c, ThermoFisher Scientific). The SensiFAST cDNA Synthesis Kit was applied for reverse transcription of 100 ng of total RNA. RT-qPCR was performed as previously described [34]. Primer sequences are detailed in Table 2.
Table 2
Primer sequence details
| Gene | Sequence | Gene | Sequence |
| 5′ L32 | GATCTTGATGCCCAACATTGGTTATG | 3′ L32 | GCACTTCCAGCTCCTTGACG |
| 5′ ALCAM | GTGCAGTACGACGATGTACCAGAATACAA | 3′ ALCAM | TGTCCTCAGTTACTAGCATGCACACAAA |
| 5′ STMN1 | CAGAATTCCCCCTTTCCCCTCCAAAGAA | 3′ STMN1 | TTTGTGGGTCAGTTTCTCTTCTGCCATTTT |
| 5′ GREBI | AGGACCTGCGCCTTGTCTCCATTT | 3′ GREBI | CTGCTTCTTGGGTTGAGTGGTCAGTTT |
| 5′ PDZK1 | CTGCAGGCTGGCTAAAGGTGAAAAT | 3′ PDZK1 | AAGTGGATCAGCCAGGGAGGAAACAATA |
| 5′ RASSF5 | GGCAAAAGTCTCTTCATGGACAAGTGTTT | 3′ RASSF5 | TCAAAGAGGAATCAATGCCAGAGAAAGAA |
| 5′ FKBP5 | GGACATTGGGGTGGCTACCATGAAGAAA | 3′ FKBP5 | CTCCGGATAATGCCTCCATCTCAAATAAA |
| 5′ AR | GGGCCCCACTTTCCCCGGCTTAA | 3′ AR | GCACAGCGGGTGGAACTCCCAAAA |
| 5′ ATP6V1B1 | ATGCCAGGAAGACCACTTGCGAATTTA | 3′ ATP6V1B1 | TCAATAGGAGAAATGCCCGTCTGAATCAT |
| 5′ IGSF1 | CCCTTACTGAGTCCAATGCAGGTCTTTA | 3′ IGSF1 | CCAGCCATGGCAGAGGATGTTAACATTA |
| 5′ CELSR2 | GGGCGTTTCAATGAGAAGCATGACTTT | 3′ CELSR2 | GGTTCACGCAAGTGCCCCCATTGT |
| 5′ SERPINA3 | TGGTGGAGCTGAAGTACACAGGCAAT | 3′ SERPINA3 | GCTTCTGTGCCCTCCTCAAATACATCAA |
| 5′ CLIC6 | AGGAAACCCGCAGACCTGCAGAA | 3′ CLIC6 | CTCGGTGCTGTAGGCATCTATTTCAT |
| 5′ MSMB | TGTTCTCCTGGGCAGCGTTGTGA | 3′ MSMB | GGGTCCTTCTTCTCCACCACGATATACTT |
| 5′ SHR00M3 | CCATGCAGATACTGGTGCCTCTAACTT | 3′ SHR00M3 | CATCGGGTTGCTTCTCCCCAGATTTA |
| 5′ EAF2 | AAGTTAGGGGAGAGTTTCGAGAA | 3′ EAF2 | CCAACCTCAAGGTATCCTTCAG |
| 5′ EL0VL5 | GTGCACATTCCCTCTTGGTT | 3′ EL0VL5 | TTCAGGTGGTCTTTCCTTCG |
| 5′ GPRC5A | CTCACTCTCCCGATCCTCGT | 3′ GPRC5A | CAGTCCGATGATGAAGGCGAA |
| 5′ SCP2 | CCACTGATAAGCATGTTGACCT | 3′ SCP2 | TGAACTGGGAATACGGGTTA |
| 5′ SEC14L2 | GCCGAATCCAGATGACTATTTTCT | 3′ SEC14L2 | GATGTTGTCAATGTCCTTTTGCTT |
| 5′ ZBTB16 | GAGATCCTCTTCCACCGCAAT | 3′ ZBTB16 | CCGCATACAGCAGGTCATC |
| 5′ TFF1 | CGAATGGCCACCATGGAGAACAA | 3′ TFF1 | GAGGGCGTGACACCAGGAAAA |
| 5′ MYB | CAGGAAGGTTATCTGCAGGAGTCTTCAAAA | 3′ MYB | CTATAGGCGGAGCCTGAGCAAAA |
| 5′ PGR | CGAGACTCAGCCAAATGTCATTTCTGTAA | 3′ PGR | CTGCTTGGAAGACTCAGGGAAGATT |
| 5′ ESR1 | GTGCCTTACACAGGGGTGAACTGTT | 3′ ESR1 | GCCCCTGCTCCTTTCAACTACCATTT |
| 5′ RANK | GCTGCAGGTGGCTTTGCAGAT | 3′ RANK | CCGGGCCACAGGGCAGACATA |
| 5′ RANKL | GCAAGCTTGAAGCTCAGCCTTTT | 3′ RANKL | CATGGTACCAAGAGGACAGACTCACTTTAT |
2.5.Immunohistochemistry
The remaining tissue was fixed overnight in 4% paraformaldehyde (Sigma) or 10% neutral buffered formalin (Sigma-Aldrich) at 4
2.6.Statistics
Student’s T-test (used to assess the differences in MD changes and gene expression levels between the different treatment groups), were calculated using GraphPad Prism version 8.4.3. Statistical parameters characterizing the correlations between gene expression and MD change were calculated using IBM SPSS v.27.
3.Results
3.1.MD changes with hormonal treatment of breast PDEs
Breast PDEs of medium MD were treated with E2 alone or E2 combined with an AR agonist for 2 weeks. Portable NMR measurements were conducted at baseline and endpoint to determine MD changes. As shown in Fig. 1, MD changed in all explants over the 2 weeks of treatment. In our study, 6 independent cases (from 4 pre- and 2 post-menopausal women) were treated with E2, 5 of which provided sufficient material to include co-treatment with an AR agonist. Compared to the patient-matched vehicle control, 3 cases showed E2-induced increases in MD while the other 3 samples exhibited a decrease (Fig. 1A). The oestrogenic effects on MD were relatively small (1.03% to 2.03% increase; −0.96% to −0.85% decrease), except for one case (PAH032M) in which E2 treatment induced a 10.4% difference in MD (Fig. 1A). Notably, the E2-induced promotion of MD occurred in the tissues from premenopausal women. Considering premenopausal cases we previously reported in terms of E2 effects on MD in breast PDEs [33], 6 out of 7 (85.7%) of PDEs from premenopausal women displayed an increase in MD with E2. Conversely, the two postmenopausal PDEs in the current study displayed a decrease in MD over the treatment period. Although the numbers are small, this data suggests that oestrogenic promotion of MD in excised tissues may only occur prior to menopause.
Fig. 1.
Tissue water content change obtained from Portable NMR measurements. The differences of tissue water content (“% water”) between endpoint and baseline (day 14 – day 0) are shown, representing the MD modulation due to different hormonal treatments (ETH CONT = ethanol equivalent control, E2 = 1nM oestradiol, SARM = 100nM Enobosarm, DHT = 10 nM 5-alpha dihydrotestoerone. (A) ETH control vs E2 (n = 6). (B) E2 vs E2 plus SARM (n = 5). (C) E2 vs E2 plus DHT (n = 5 each dot represented % water change in one patient sample with one treatment. Different treatments in the same sample are connected with one colour line. Full lines represent the explants excised from premenopausal women, dotted lines the explants excised from postmenopausal women. Student’s paired T-test was used to determine significance; none of these comparisons were significant.
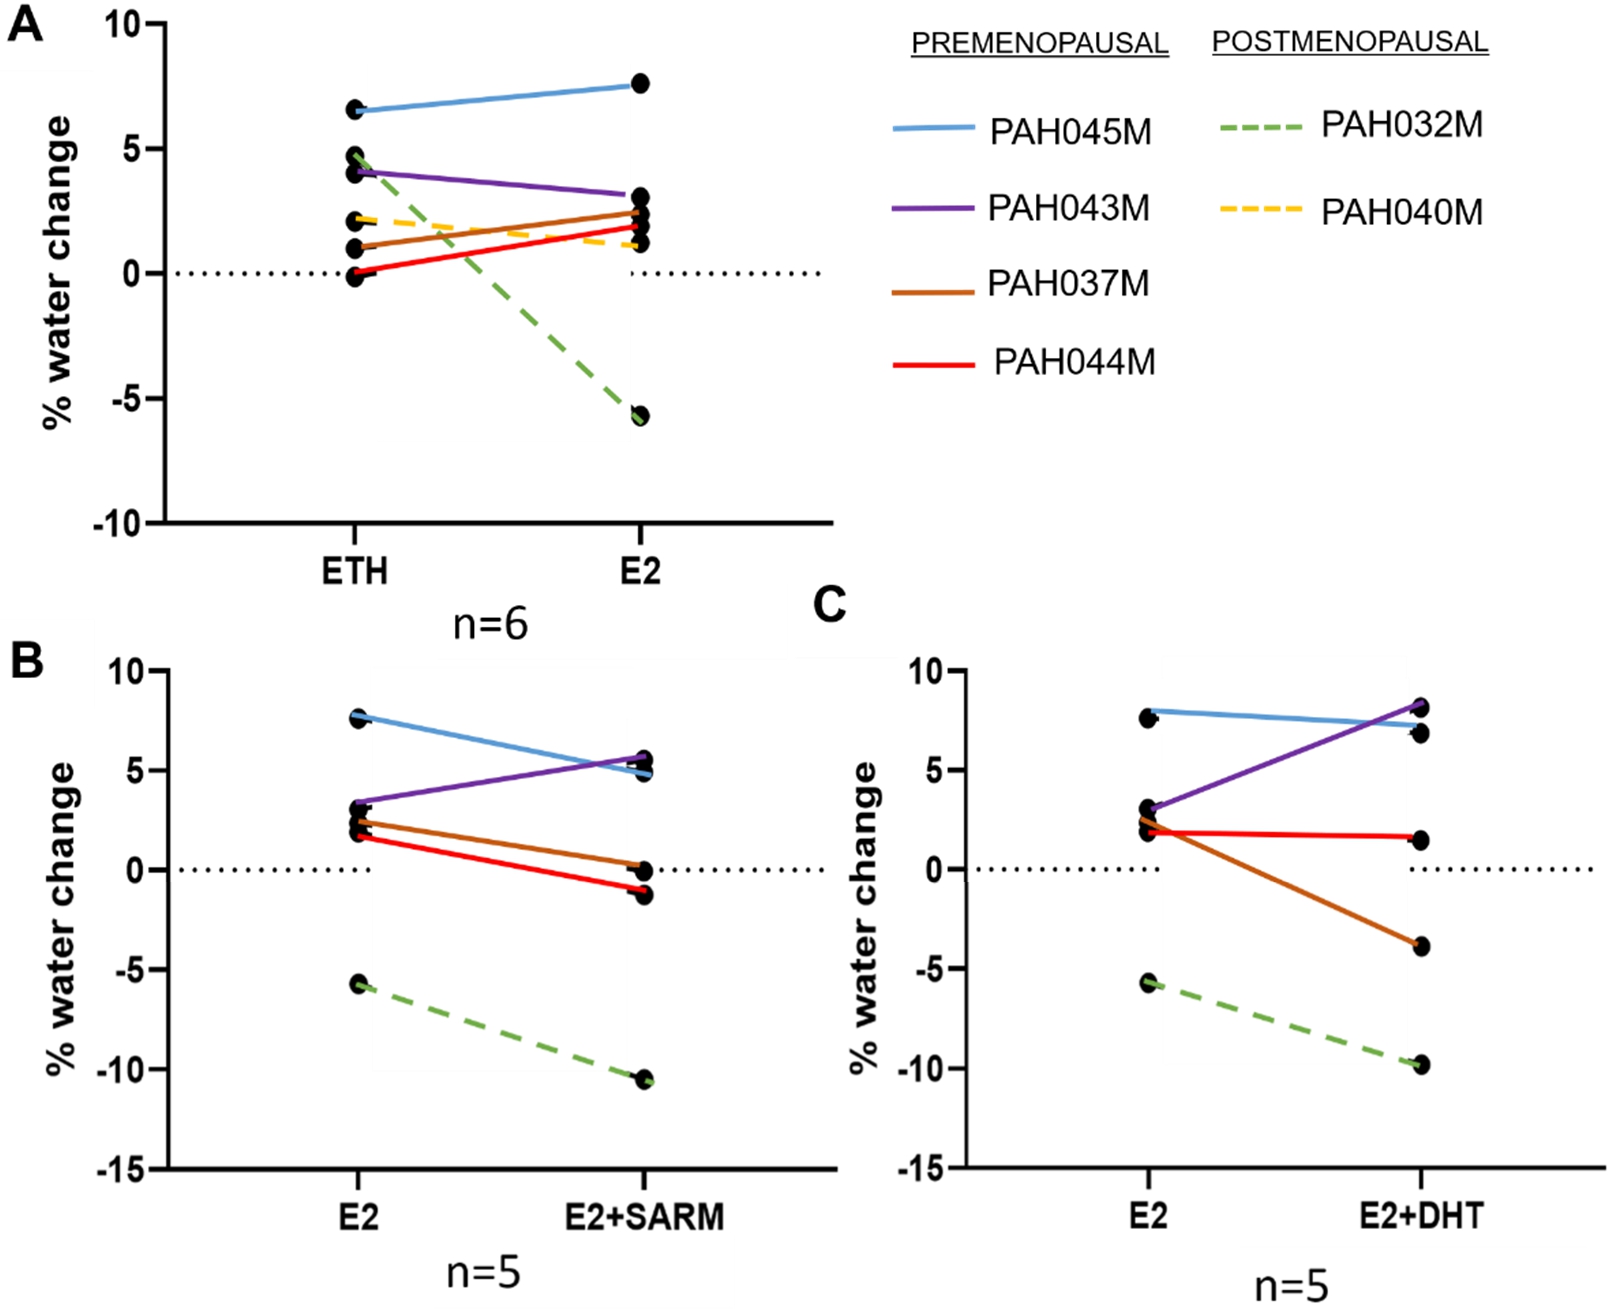
To study the potential anti-estrogenic effect of AR signalling on MD, PDEs were also treated with E2 plus either Enobosarm or DHT. We observed a downward trend in MD in 4 out of 5 cases co-treated with E2 plus either AR agonist compared with E2 alone (Figs 1B and 1C). This downward trend occurred irrespective of the effect of E2 on MD. The only exception was the premenopausal case PAH043M, in which E2 alone appeared to decrease MD and both AR agonists increased MD compared to E2 treatment (Figs 1B–1C). PDEs treated with E2 plus Enobosarm showed comparatively moderate decreases in MD, in the range of −2.48% to −4.8%, compared with PDEs treated with E2 plus DHT, which varied considerably, from −0.44% to −6.24%. This variation may be due in part to the ability of DHT to be metabolised in breast tissues [31,44].
3.2.Hormone receptor expression levels in untreated PDEs
To explore the possible reason for the outlier PAH043M in regards to hormonal effects on MD, we analysed hormone receptor expression in the original tissue (not explanted) from the 5 patients treated with E2 alone or in combination with an AR agonist. The % DAB positivity per glandular area after immunostaining was calculated. As shown in Figs 2A and 2B, PAH043M had significantly higher expression levels of ER (19.8% vs 1.3%–7.5%;
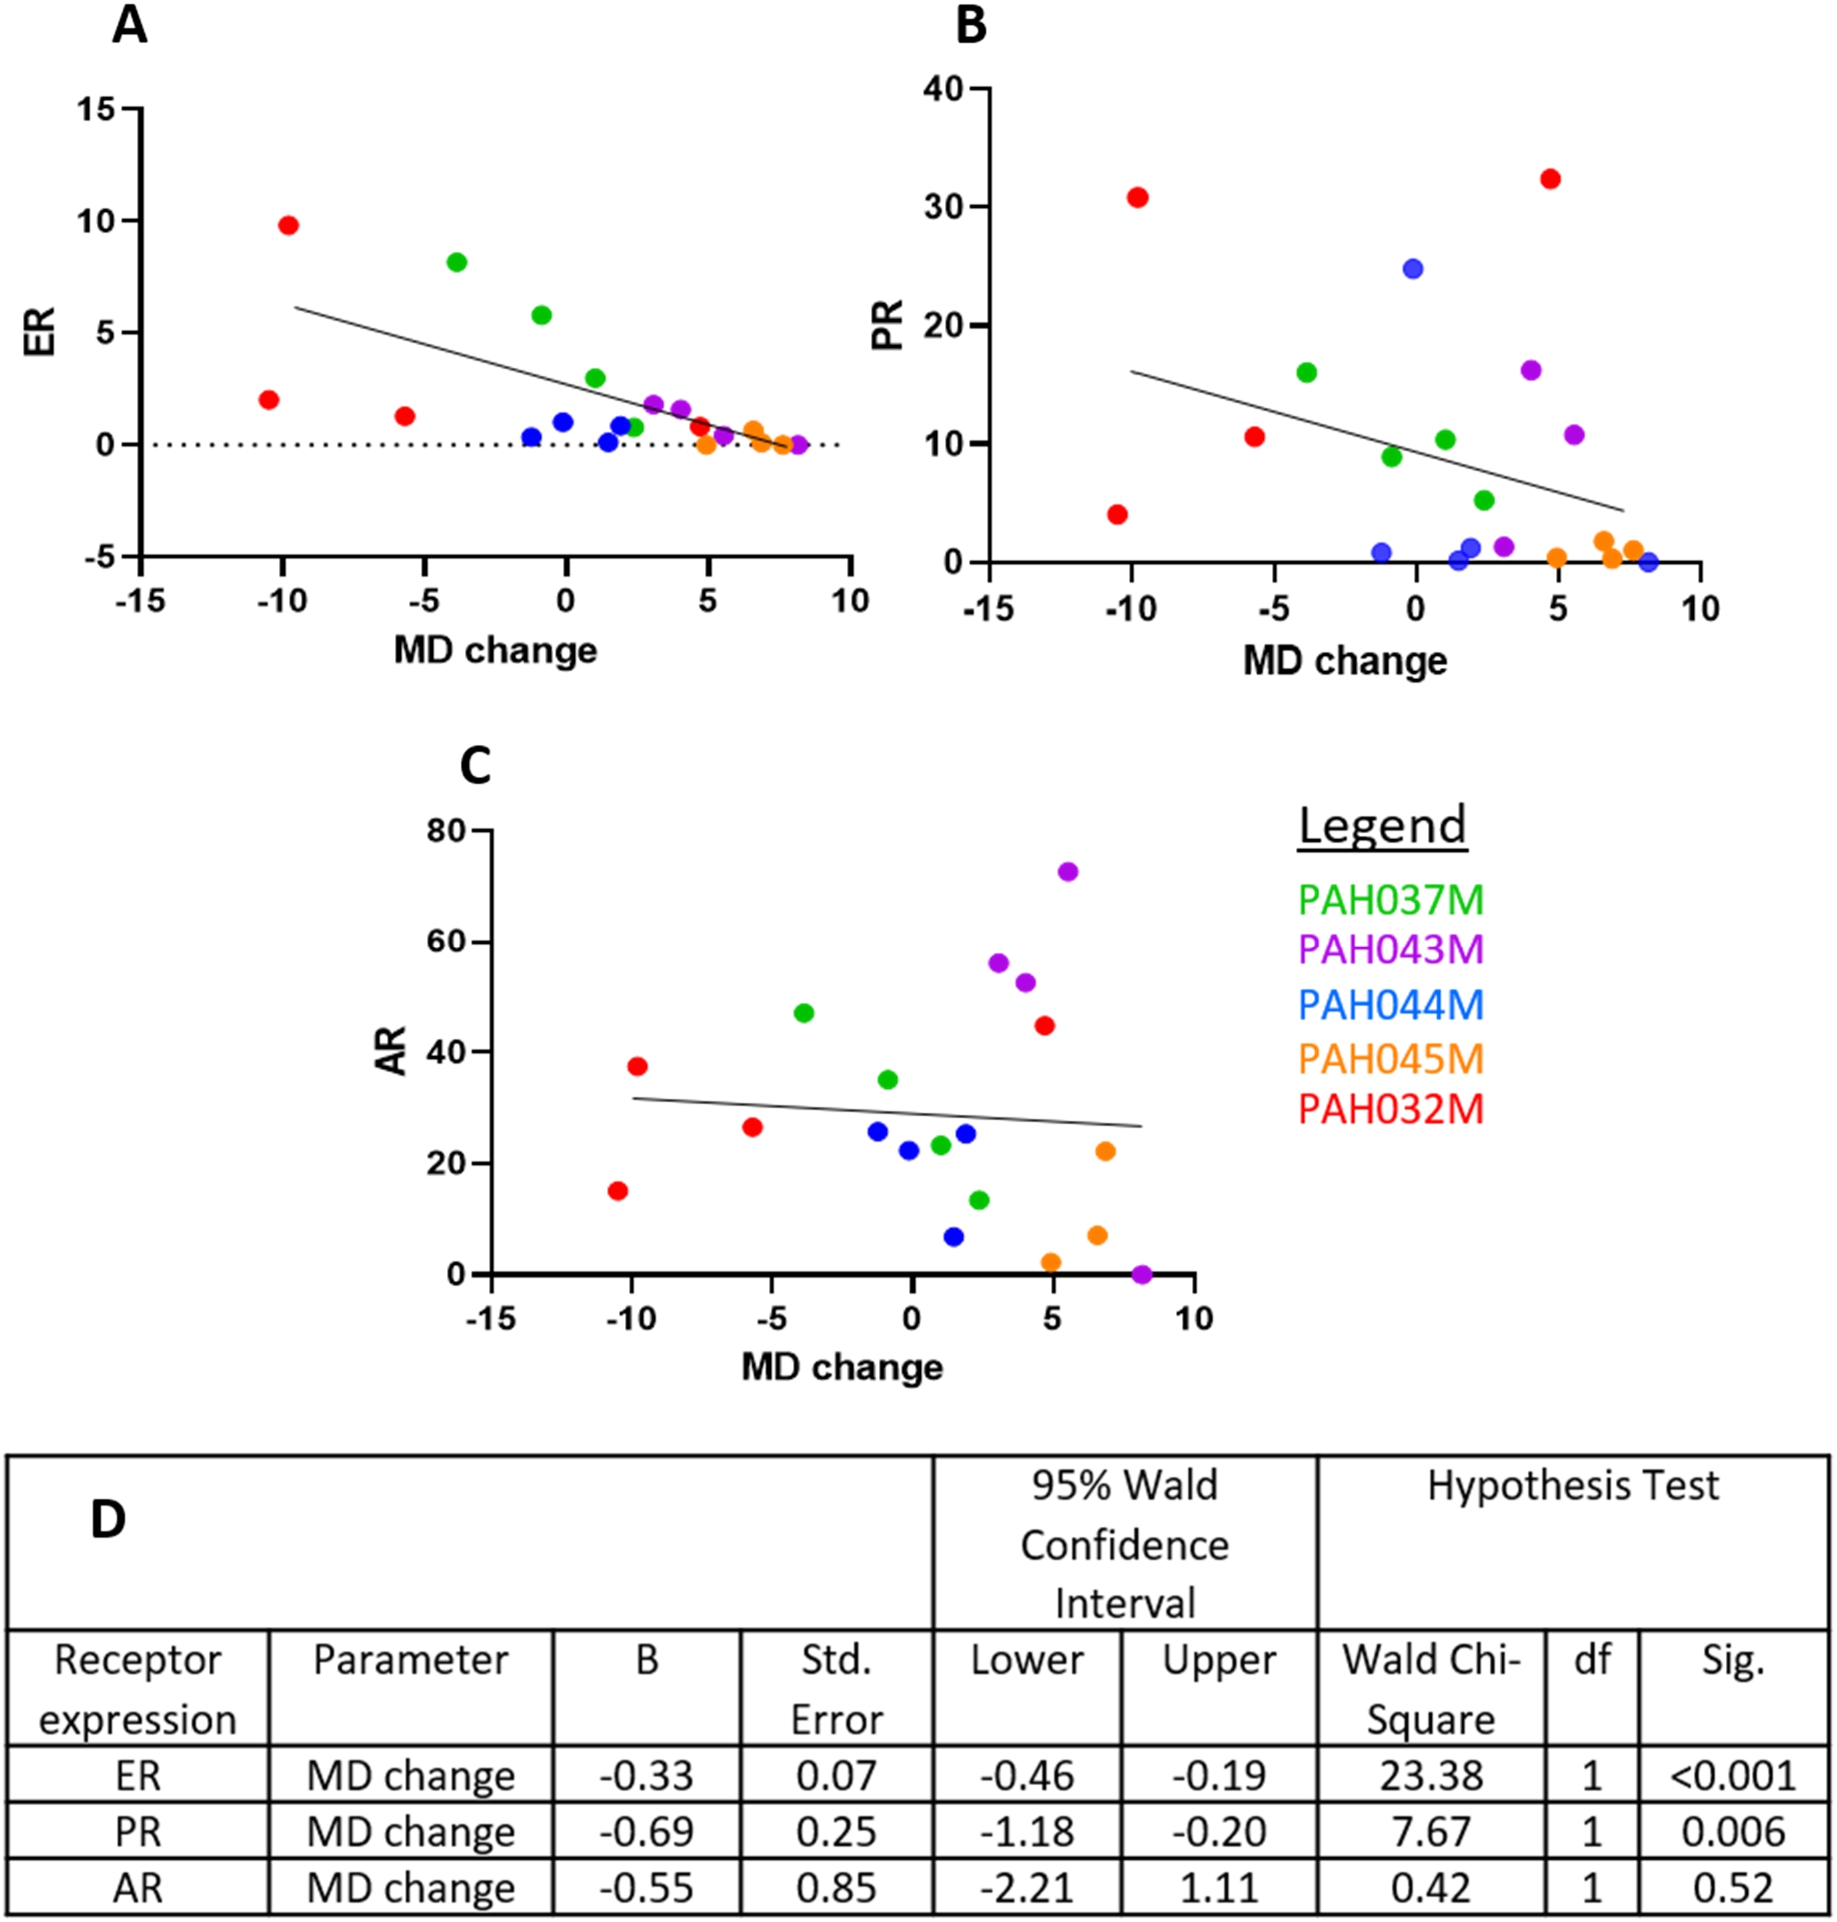
3.3.Oestrogen receptor levels predict MD change
Correlation between percentages of DAB-stained ER/nuclear area per glandular region and MD changes were analysed for the 20 PDEs treated with the four treatments (ETH control, E2, E2 plus DHT, E2 plus SARM) from the 5 patients in Fig. 2 (PDEs and treatments detailed in the methods section). Generalised estimated equation (GEE) analyses were applied to determine association between hormone receptor levels and effects of these combined treatments on MD, according to patient number. As shown in Fig. 3, expression of ER protein appeared to be associated with MD change. Although the GEE statistics indicate significance, more cases are needed to determine if this is indeed a significant finding. Interestingly, a similar association was also observed for PR and MD change, however with a lower Wald Chi-Square value (23.38 vs 7.67). AR protein expression was not associated with MD change. The images of ER positivity are shown in Fig. 2.
Fig. 2.
IHC analysis of hormonal receptors in original tissue from 5 cases treated with AR agonists. A. Comparisons of positivity of ER, PR and AR in original mammary tissue from 5 different. One-way ANOVA was used to determine significance;
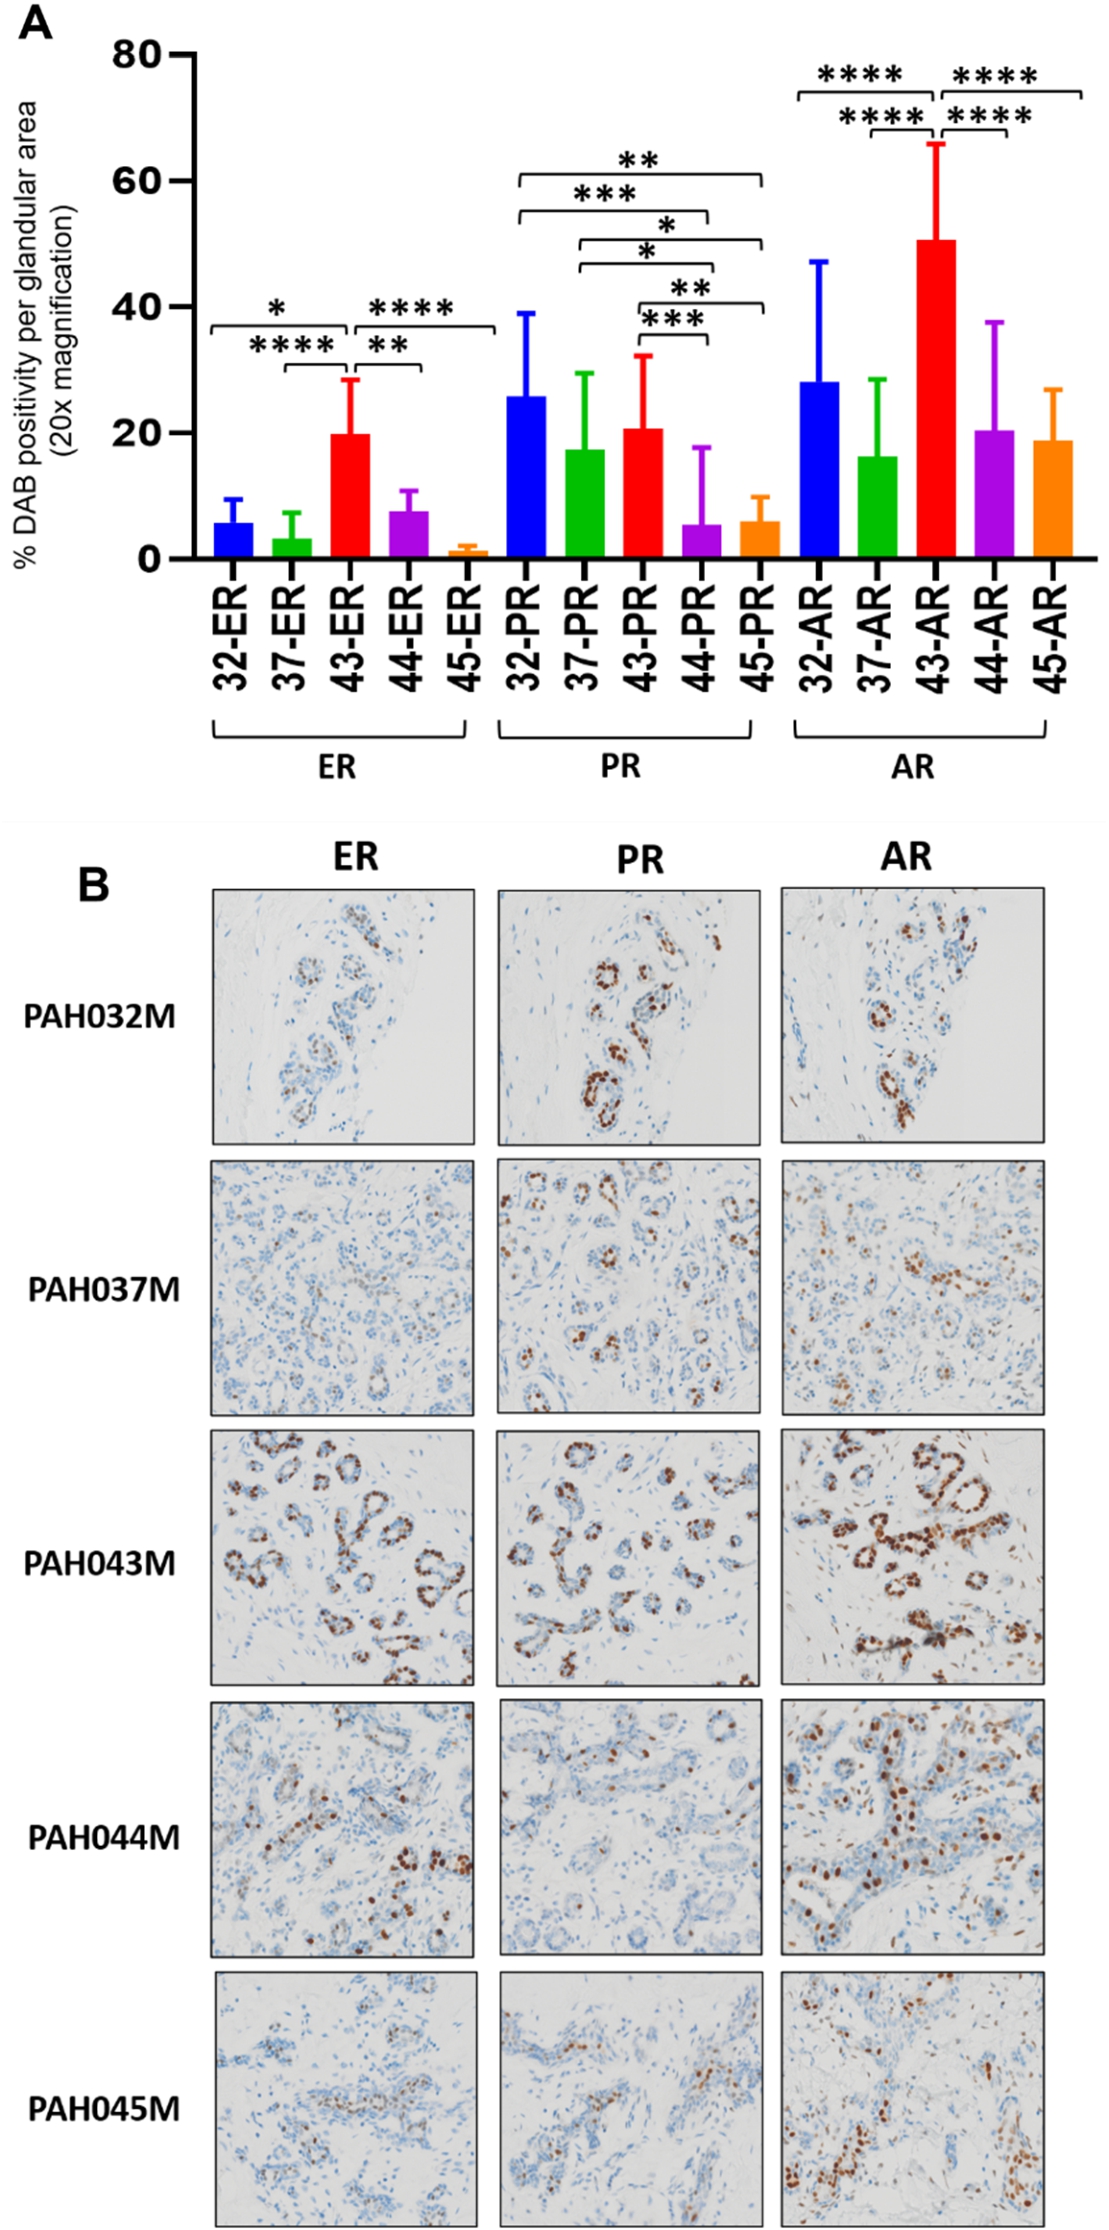
Fig. 3.
Generalised estimated equations analyses of MD change and ER (A), PR (B) and AR (C) levels were conducted in 20 explants from 5 patients, representing the controls and all 4 treatments (ETH, E2, E2 plus SARM and E2 plus DHT) for each patient. Hormonal receptor levels were shown as % DAB positivity per glandular area. D. Parameter estimates obtained from the application of generalised estimated equations.
3.4.Hormone receptor mRNA expression after treatment with E2 alone or E2 combined with an AR agonist
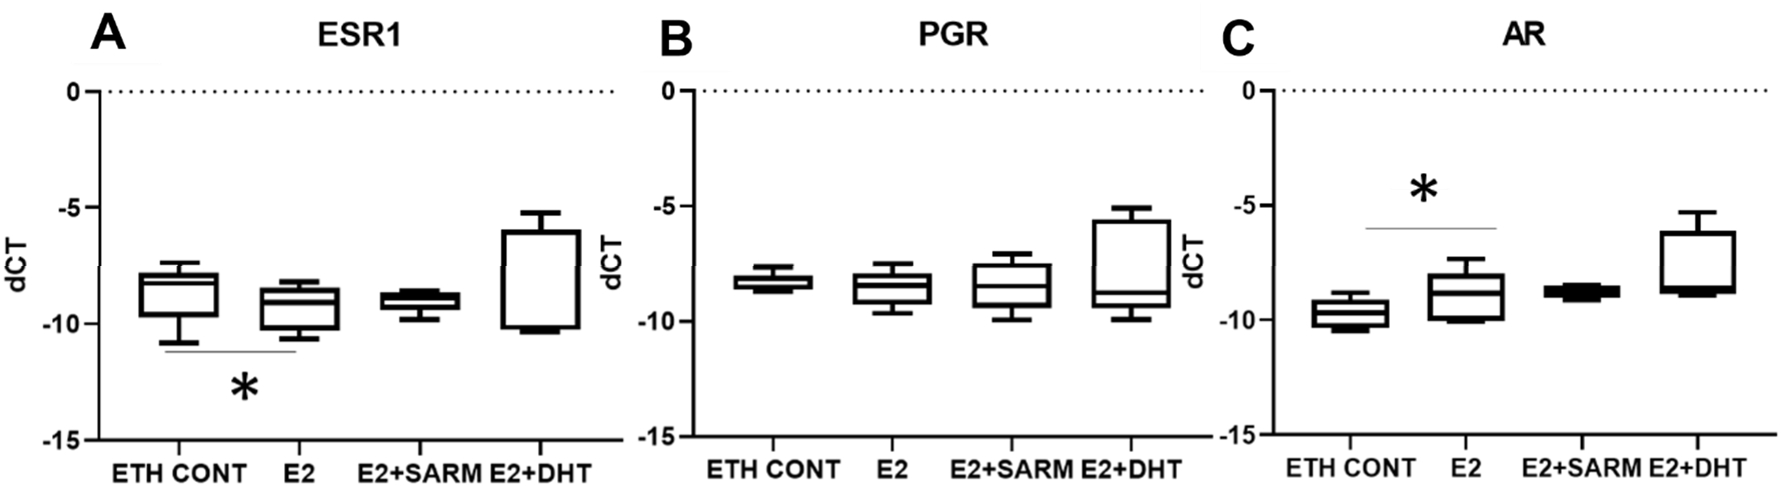
The mRNA levels of ER, PR and AR in hormone-treated PDEs were analysed by RT-qPCR at harvest. As expected, treatment with E2 alone reduced the mRNA expression of oestrogen receptor (ESR1) (Fig. 4A), however, mRNA levels of progesterone receptor (PGR) were unchanged at this time point (Fig. 4B). Interestingly, E2 treatments increased androgen receptor (
Fig. 4.
Hormonal receptor mRNA expression level in treated explants. CT values from RT-qPCR were normalised with L32, with delta-CT shown. A Expression levels of ESR1. B Expression levels of PGR. C Expression levels of
3.5.The effect of hormone treatments on expression levels of oestrogen, progesterone or androgen-regulated genes in PDEs
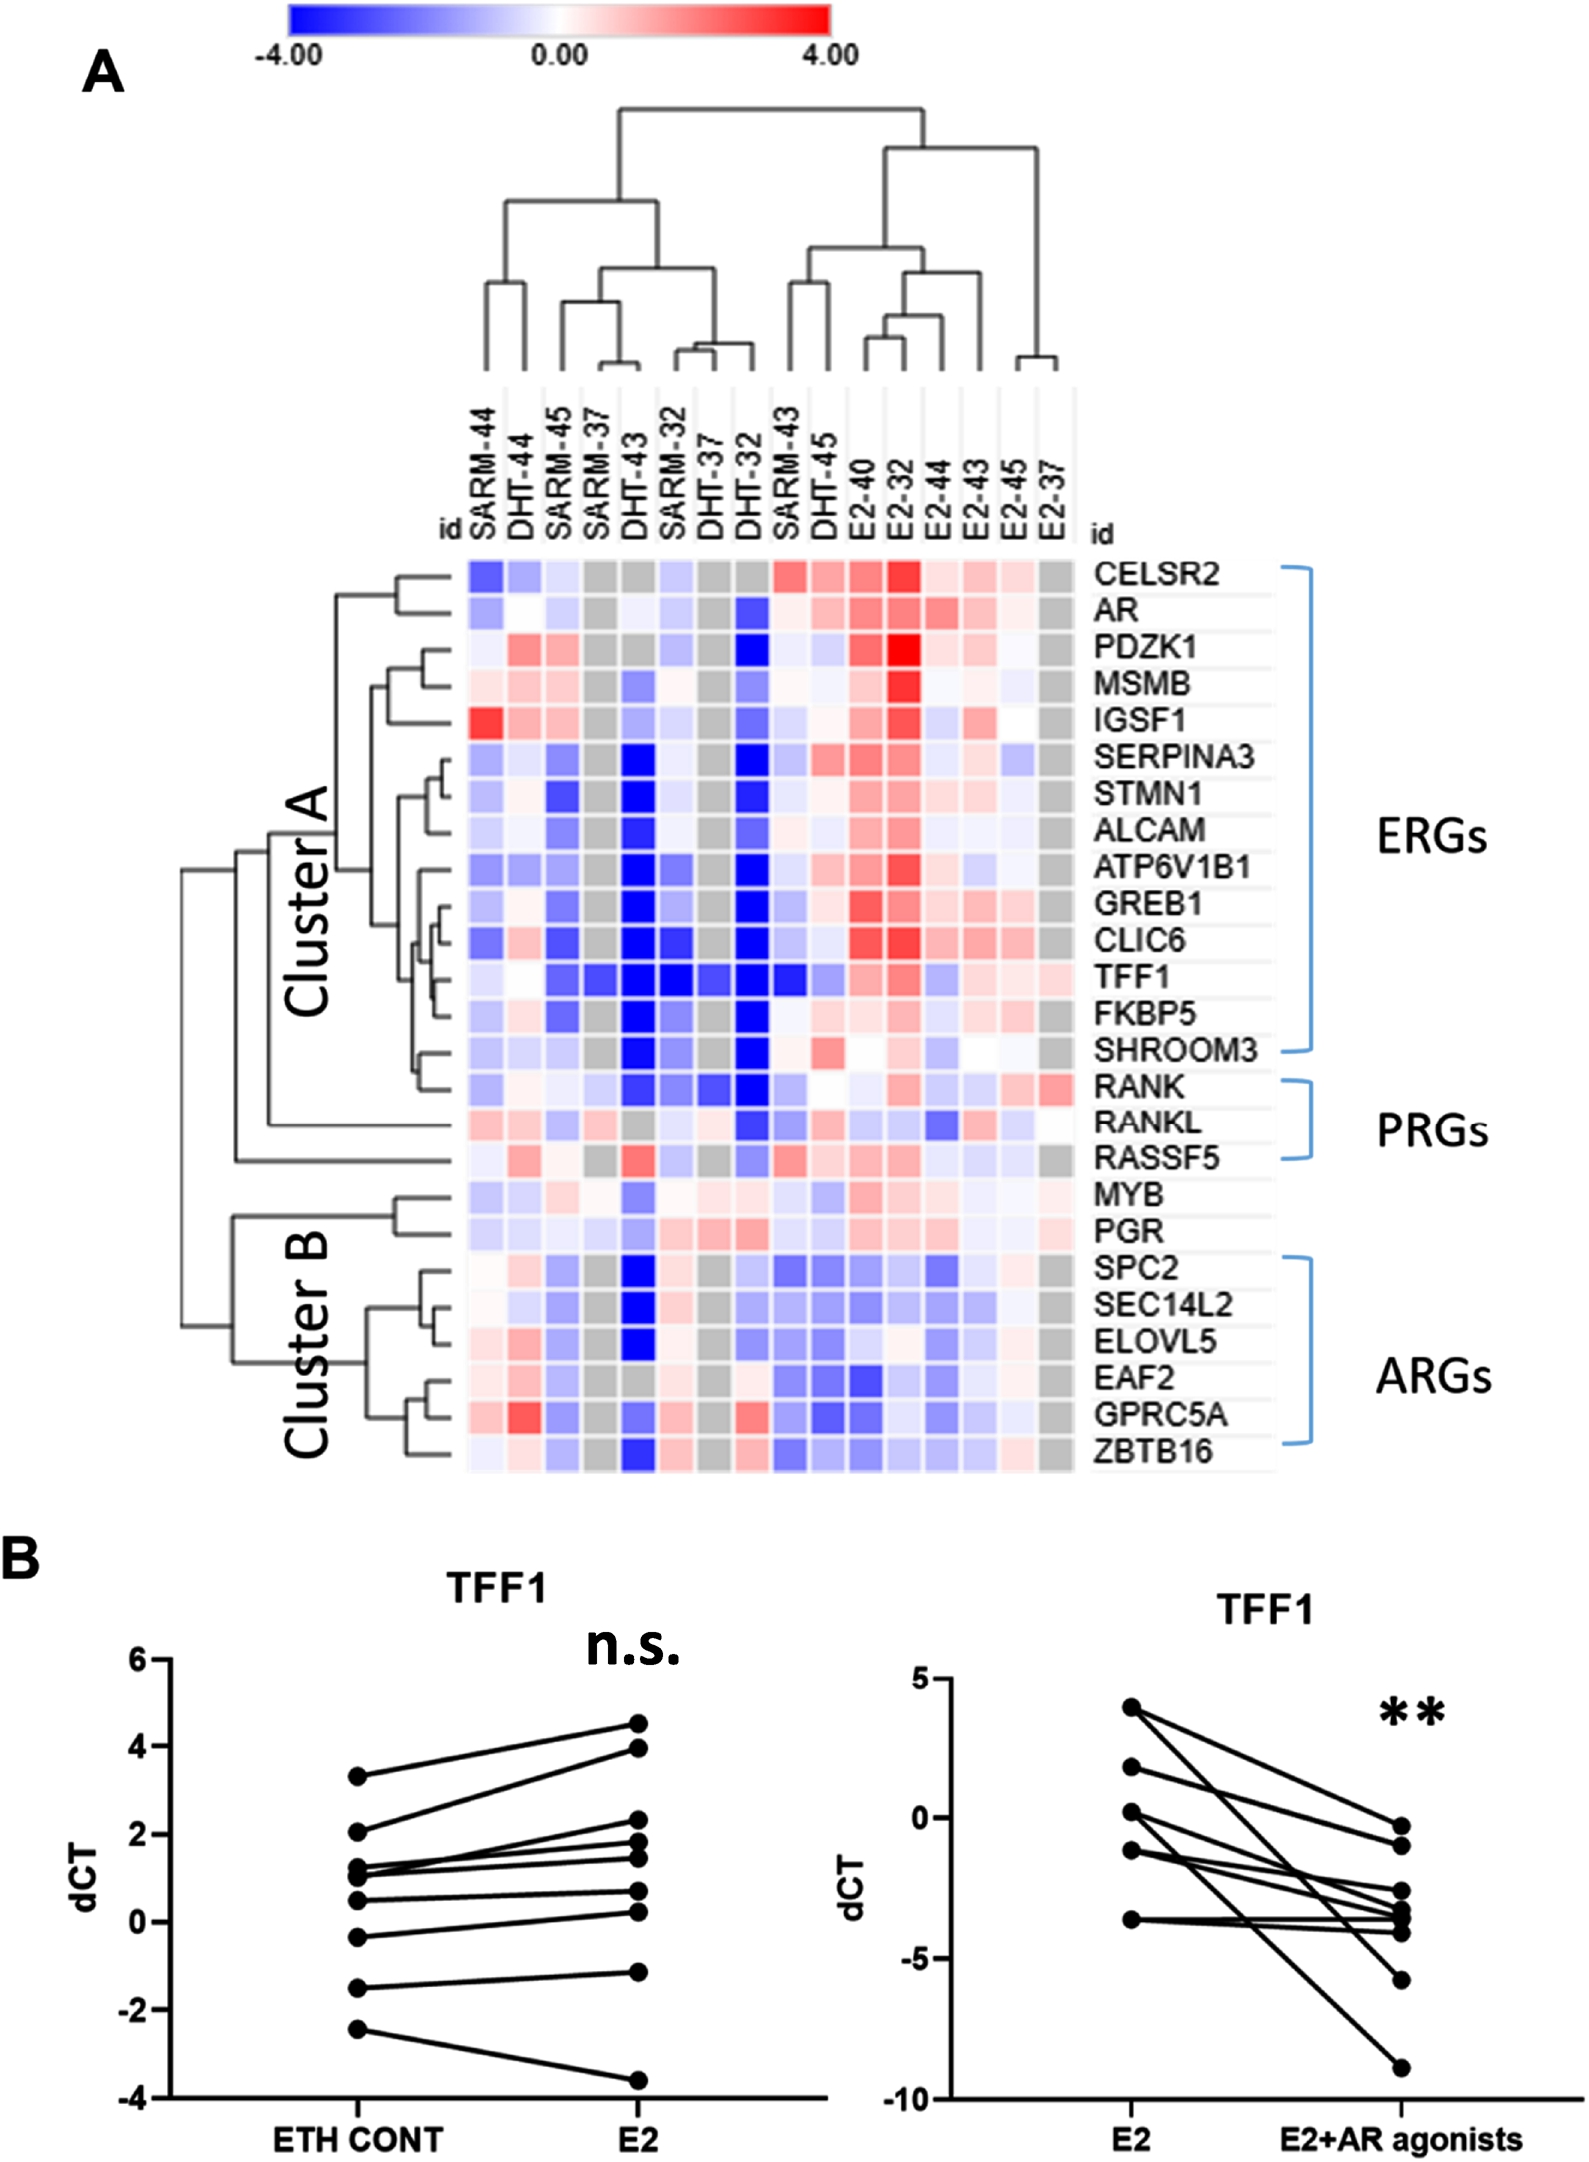
To further investigate oestrogen and androgen signalling in PDEs, RT-qPCR analysis was performed to assess mRNA expression of 14 known E2-regulated genes (ERGs) and 5 progesterone-regulated genes (PRGs) as defined from previous studies [22,49], Fig. 5A. Although progesterone was not included as an explant treatment in this study, it is known that activation of the ER can influence PR activity [35]. In addition, 6 AR target genes identified in ER+ breast cancers [25] were assessed. To adjust for the potential confounding effect of varied epithelial content in our PDEs, we normalised target gene expression data to mRNA expression data for the regulatory hormone receptor (HR). Student’s paired t test was used to determine significance.
As shown in Fig. 5A, genes were divided into two clusters according to their response to hormonal treatments. Most ERGs were up-regulated in response to treatment with E2 alone (compared to ETH control) and down-regulated in response to E2 plus an AR agonist compared to E2 alone (Cluster A). Conversely, Cluster B was characterised by moderate up-regulation of ARGs in the presence of E2 plus an AR agonist compared to E2 alone, and potent down-regulation of ARGs in the presence of E2 alone compared to ETH, indicative of anti-androgenic effects. The statistical comparison of gene expression averaged across the groups (ERGs, ARGs and PRGs) according to treatment can be seen in Supplementary Tables 1 and 2, where the gene expression trends visible in Fig. 5A were evident. E2 treatment alone did not significantly affect gene expression across the groups, however the combination of E2 and Enobosarm (SARM) significantly reduced ERG (
Fig. 5.
A. Heatmap of expressions of ERGs, PRGs and ARGs in PDEs treated with E2 compared to ETH control (n = 6) and E2 plus SARM or DHT (note that in these cases only SARM or DHT is labelled) treatment compared to E2 alone (n = 5). Each cube represents one gene expression level after normalisation with respective HR expression (ddCT value). B. TFF1 expression levels in ETH vs E2 (left) and E2 vs E2 plus AR agonists (right). Student’s paired T-test was used to determine the significance of correlations;
3.6.Correlations between MD and hormone-regulated gene expression signatures
In addition to the regulation of gene expression by hormones, putative associations between these gene expression patterns and MD were studied to provide insight into the possible mechanism of hormonal effects on MD. Given sample size was small, we report our observations as trends only. Generalised estimated equations analyses were conducted on gene expression in PDEs, regardless of treatment, but taking patient ID into account, to study correlative trends of endpoint gene expression and endpoint MD. Wald chi-square values and respective p values are listed in Table 3. The full GEE output for genes with p values <0.05 have been presented in Supplementary Table 7, including the direction of correlation (positive or negative). Gene expression which trended to negatively correlate with endpoint MD were the ERGs IGSF1 (Wald chi-square = 4.430), MSMB (Wald chi-square = 13.184), PGR (Wald chi-square = 6.607), ALCAM (Wald chi-square = 17.034) and the androgen receptor associated gene GRPCA (Wald chi-square = 6.090). Three of these genes negatively associated with MD (IGSF1, MSMB, ALCAM) share similarities in that they contain an immunoglobulin-like domain and/or immunoglobulin binding [47] and thus may be related functionally. Gene expression which trended to positively associate with MD included the ERGs GREB1 (Wald chi-square = 3.895), SHROOM3 (Wald chi-square = 17.620) and the two functionally paired PR response genes RANK (Wald chi-square = 16.501) and its ligand, RANKL (Wald chi-square = 9.158). The presentation of these potential correlations, in an insufficient number of cases, have been made for discussion purposes only and need to be further investigated in a larger number of cases.
Table 3
Generalised estimated equation analysis of gene expression versus MD value at endpoint. The correlation was analysed among all treated explants following normalization with respective hormone receptor expression CT
| Gene | Wald chi-square | p value |
| PDZK1 | 2.256 | 0.133 |
| SERPINA3 | 0.927 | 0.336 |
| CELSR2 | 0.002 | 0.961 |
| AR | 2.074 | 0.150 |
| ATP6V1B1 | 1.284 | 0.257 |
| GREB1 | 3.895 | 0.048 |
| IGSF1 | 4.430 | 0.035 |
| CLIC6 | 1.873 | 0.171 |
| MSMB | 13.184 | <0.0001 |
| TFF1 | 0.675 | 0.411 |
| MYB | 2.421 | 0.120 |
| PGR | 6.607 | 0.010 |
| ALCAM | 17.034 | <0.0001 |
| STMN1 | 1.343 | 0.246 |
| RASSF5 | 3.801 | 0.051 |
| SHROOM3 | 17.620 | <0.0001 |
| FKBP5 | 3.525 | 0.060 |
| RANK | 16.501 | <0.0001 |
| RANKL | 9.158 | 0.002 |
| SPC2 | 0.412 | 0.521 |
| EAF2 | 1.490 | 0.222 |
| SEC14L2 | 0.459 | 0.498 |
| ZBTB16 | 1.271 | 0.260 |
| GPRC5A | 6.090 | 0.014 |
| ELOVL5 | 3.788 | 0.052 |
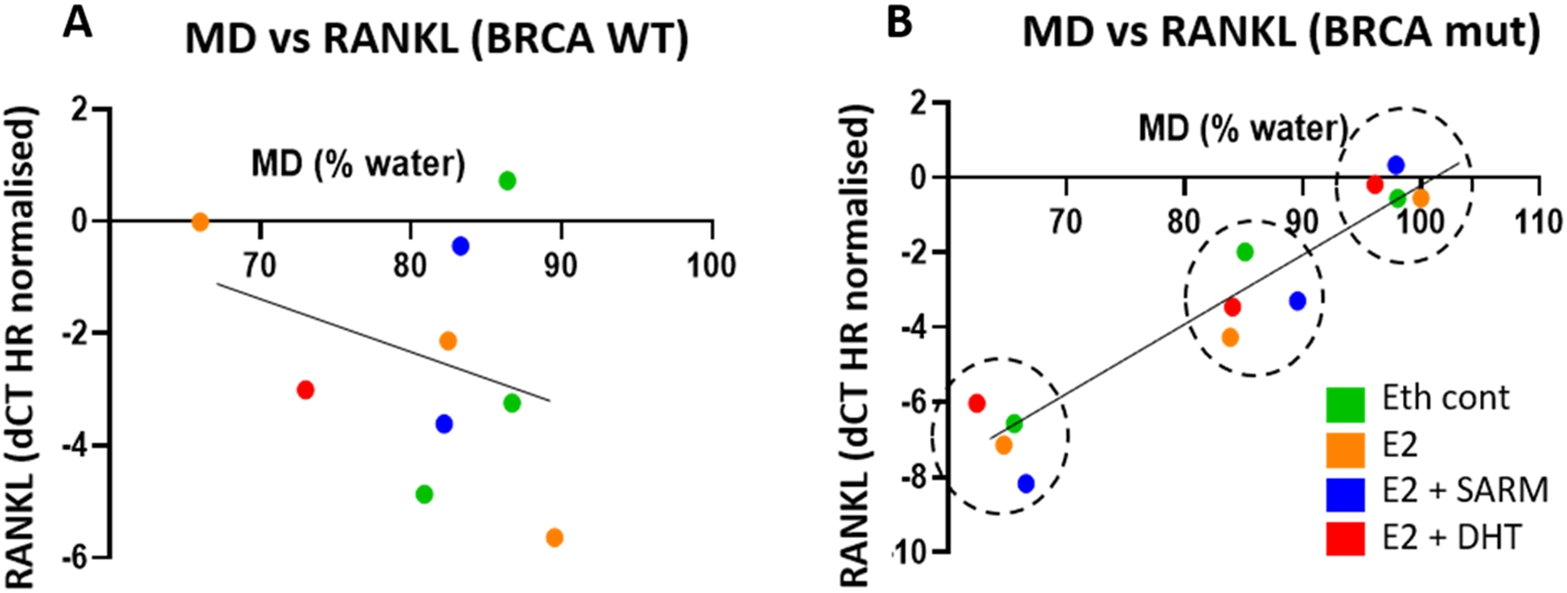
3.7.Positive correlations between RANK/RANKL and MD exist only in BRCA 1 AND BRCA 2-mutated patients
We investigated these MD-negative or positively associated genes further to see if BRCA mutation status influenced the strength of association. This involved separating samples by BRCA 1 and BRCA 2 pathogenic variant status versus WT. In this study, 3 out of 6 cases were BRCA 1 and/or BRCA 2-mutated. RANK receptor and its ligand RANKL both displayed a strengthened correlation when the BRCA-WT patient data was removed, while the relationship of RANK/RANKL and MD disappeared when only BRCA-WT data was considered. This data is shown in Table 4. We report a similar pattern for SHROOM3 (Supplementary Table 8).
To study the influence of hormone treatments on these relationships, generalised estimated equation analysis was applied to PDEs with the same treatment (E2 or E2 plus AR agonists). The Wald Chi-Square values generated from explants with different hormone treatments did not differ (p = 0.151), indicating RANK/RANKL were positively correlated with MD in BRCA 1 and BRCA 2 mutated tissues regardless of whether RANK/RANKL signalling was modulated. The correlations are shown in Fig. 6 with colour coding according to treatment.
Table 4
Generalised estimated equations of RANK/RANKL expression versus MD separated by BRCA 1 and BRCA 2 mutation status. The correlation was analysed among all treated explants
| Gene | BRCA mutated | BRCA WT | ||
| Wald chi-square | p value | Wald chi-square | p value | |
| RANK | 28.821 | <0.001 | 0.85 | 0.771 |
| RANKL | 604.944 | <0.001 | 2.314 | 0.128 |
Fig. 6.
Plots of MD and RANKL expression levels from 3 patient samples classified as WT (A) or BRCA 1 and BRCA 2 (B) pathogenic variant (mut), with RANKL expression data normalized using hormone receptor of respective treatments. Each colour represents one treatment, and each of the 3 clusters (groups of red, green, orange and blue, graphs B and D) represents one of the 3 different BRCA 1 and BRCA 2 mutated gene subjects.
4.Discussion
We have previously pioneered the use of single-sided Portable NMR for quantitative measurement of MD in human breast tissue and demonstrated a strong linear correlation between tissue water content measured from Portable NMR and %MD obtained from MicroCT (
We observed modest relative MD increases, within a range of 1.03%–2.03%, in 6 out of 9 mammary tissue explants from premenopausal women (considering cases from this and the previous study), treated with E2 alone compared to ETH control. In comparison, although the numbers were small, oestrogen reduced density in the explant issues from two postmenopausal women. This is consistent with studies that report that MHT containing oestrogen only does not increase MD or BC risk in postmenopausal women [20,21]. The first of its kind, our pilot study provides a tissue-specific direct assessment of the effect of E2 on MD, quantitatively assessed using Portable NMR, in pre-menopausal normal breast tissues. Our data suggest that E2 may promote MD in this demographic, and further follow-up studies will be particularly informative in regards to breast cancer risk in pre-menopausal women, dictated by E2 exposure.
A downward trend in MD was seen in 4 out of 5 explants treated with E2 plus AR agonists in comparison with E2 alone, providing insights into the effect of AR agonism on MD in our physiologically relevant PDE model. With the treatment of E2 plus AR agonists (DHT or Enobosarm), 4 samples showed a consistent decrease in MD in the range of −0.44% to −6.24%, compared to E2 treatment alone. PAH043M was the only outlier that responded differently to combination treatments of E2 and AR agonists from the other four samples. Interestingly, the original ER and AR levels in this sample were prominently higher (Fig. 2), which may account for the observed divergent response. Further study is needed to determine the prevalence and implications of such high hormone receptor levels.
Circulating free testosterone has been negatively associated with MD [5,38], although testosterone therapy was found to have no effect on MD among both MHT users and non-users [15,27]. In addition to metabolism to the most potent androgen, DHT, testosterone can also be converted to oestrogen via aromatase activity in breast adipose tissue, which is a major source of oestrogen in postmenopausal women [51]. This aromatization possibly accounts for the lack of effect of testosterone on MD in the studies referred to previously [15,27]. In our study, the PDEs were treated with DHT or Enobosarm, direct agonists of AR, in the presence of E2, and evoked a downward trend on MD consistent with an anti-estrogenic effect. Indeed, the repressive effect of the estrogen signalling molecule TFF1 in explants treated with AR agonists was indicative of this effect (Fig. 5B).
Associations were observed between ER positivity levels by immunohistochemistry in the normal mammary epithelium and MD, with a comparatively diminished association seen with PR and MD (Fig. 3A). This data has been colour coded to illustrate that the association of ER and PR in regards to MD change may not be driven by one patient but is perhaps a phenomenon observed in explants from all patients. The relationship with ER, though the sample size is small, is consistent with what is normally observed in ER signalling, where the ER becomes degraded following transcriptional activation [45]. Similarly, PR is associated with ER signalling [35] therefore it is interesting that we observed a positive association with MD in our small case set. While AR levels in the donor tissue did not correlate with MD, treatment with an AR agonist appeared to somewhat reduce MD in PDEs (Figs 1B, 1C). This finding is consistent with previous work showing that AR agonists oppose ER signalling in normal and malignant breast tissues [25], however requires further investigation in mammary tissue from more cases.
ERGs, PRGs and ARGs were differentially regulated in the PDEs treated with the various hormones. ERGs were increased in E2-treated explants but decreased in patient-matched explants co-treated with an AR agonist. Anti-estrogenic effects of androgen / AR signalling in normal and malignant breast tissues involves AR-mediated reprogramming of ER and its co-activators p300 and SRC-3 on DNA to down-regulate ER target genes and up-regulate AR target genes [25]. The AR-mediated down regulation of ERGs, especially TFF1 (Fig. 5B), in the current study suggest that the observed effect of AR agonists in decreasing MD in the small number of cases we examined, may be via ER modulation and inhibition of the ER signalling pathway.
Among the ERGs, expression of GREB1 and CLIC6 were significantly altered by both E2 alone and E2 in combination with Enobosarm, showing good sensitivity to ER signalling regulation. During the menstrual cycle, GREB1 expression has been shown to be upregulated along with increased MD in the late follicular and luteal phases of the menstrual cycle, which corresponds to intermediate to high oestrogen milieu [22,57]. As an ER-regulated gene, GREB1 was also required for oestrogen-stimulated proliferation of breast cancer cells, and appears to regulate proliferation via PI3K/Akt/mTOP signalling [11]. CLIC6 is an intracellular chloride channel, of which SNPs within this gene has been linked to the onset of breast cancer [37]. Our data also showed a positive correlation between GREB1 expression and MD at endpoint, but not for CLIC6 (Table 3). Taken together, our data suggest that ERGs, particularly GREB1, may be better predictors of ER activity and potentially MD change than traditional approaches dependent on ESR1 mRNA or ER IHC levels.
The potential significance of RANK receptor expression and signalling in association with MD has been highlighted in this study. We found that RANK expression was significantly reduced by Enobosarm (Fig. 5 and Supplementary Table 4). Furthermore, RANK and RANKL appeared to positively correlate with MD in the small number of cases that we examined, regardless of what the PDE was treated with, which we found to be specific to BRCA 1 and BRCA 2-mutated explants. Toriola et al also reported similar correlations with MD, although that study did not take BRCA 1 and BRCA 2 pathogenic variant carrier status into account [52,53]. They found that circulating RANK was positively associated with volumetric percent density in premenopausal women, while women with higher circulating soluble RANKL and RANKL mRNA levels in breast tissue had higher volumetric percent density, indicating a possible regulatory role of RANKL signalling on MD. Although requiring further investigation, we observed a correlation between RANKL expression and MD in PDEs from women with BRCA 1 and BRCA 2 pathogenic variations (Table 4), which appeared to be consistent even when RANK/RANKL expression varied with different hormonal treatments. Following further study of more cases, this data may indicate that the expression level of RANKL could be a strong marker of MD and a putative a predictor for MD. RANKL/RANK is a mediator of cancer formation in BRCA 1 and BRCA 2 pathogenic variant carriers [50], where RANK positive, tumorigenic luminal progenitor cells abound in BRCA 1 and BRCA 2 mutated breast tissue [42]. Our finding that RANK/RANKL associated with high MD in our small number of BRCA 1 and BRCA 2 pathogenic variant carriers provides impetus for further study to determine whether interplay between MD and luminal progenitor cell abundance exists. Indeed, a clinical trial is underway to test whether the RANK pathway inhibitor Denosumab can induce the incidence of breast cancer in BRCA1 mutation positive women, and changes in mammographic density are being used as indicators of efficacy (Geoff Lindeman, NBCF).
Future work. The statistical sample used in the present study (6 patients, 22 treated PDEs) is small and does not allow us to confidently analyse the effects of patient-specific factors on the tissue response to treatment. Such factors include (but are not limited to) patient age, menstrual status, BRCA1/2 status, and breast density (BI-RADS category). Therefore, the present results call for a more expansive study on a larger patient cohort that would include several patients for each combination of these parameters. Younger women are known to have higher levels of MD than older women. Similarly, postmenopausal status is known to be associated with a relatively low MD compared to an equivalent pre-menopausal cohort. Therefore, it would be valuable to determine whether age, menstrual status, number of childbirths, breast-feeding and other similar factors affect only the “baseline” MD values, or whether they potentially can have an effect on the change in MD in response to a treatment. Furthermore, our latest results suggest that the precision and accuracy of Portable NMR MD quantification in tissue explants are not uniform but influenced by the tissue fat and water contents. Therefore, an investigation of the relationship between baseline tissue composition and treatment response would also be important and topical.
Summary. Our investigation of the effects of oestrogen alone or in combination with an AR agonist on MD via ex vivo culture of normal breast PDEs support the efficacy of this model in further investigations of the effect of AR agonism on MD. Initial clinical indications have demonstrated that combining testosterone with an aromatase inhibitor can result in significant reduction in mammographic breast density by enhancing intramammary DHT (personal communication by Dr Stephen Birrell, Havah Therapeutics Pty Ltd). Indeed, commercial development of androgenic products to reduce mammographic density is currently underway (Birrell SN 2016, Methods of reducing mammographic breast density and/or breast cancer risk, USTPO US 9,351,977 B2). Given that the AR has been found to be a tumour suppressor in ER-driven breast cancers, our preliminary data suggests that activation of this pathway has the potential to be used for BC prevention via reducing MD and subsequently decrease BC risk. Further investigation is needed to determine if this is indeed the case.
5.Conclusions
The present study further demonstrates the utility of single-sided Portable NMR for quantitative measurement of the dynamics of Mammographic Density in explanted human mammary tissue in response to exogenous hormonal treatments. The study suggests that androgen receptor agonism can reduce MD, and therefore may be a novel means by which to reduce the risk of breast cancer associated with high MD.
Acknowledgements
The authors wish to thank the Ms Gillian Jagger at the Princess Alexandra Hospital Radiology Department, for her important support of the project, and pathologists at the Princess Alexandra Hospital Anatomical Pathology Department, Drs Linda Chen and Simone Birch, for their assistance in providing us with the breast tissue slices that we used in this study. We also gratefully acknowledge Dr Stephen Birrell, Birrell Havah Therapeutics Pty Ltd, for advice on androgen therapy, and Dr Dimitrios Vagenas, Research Methods Group, QUT, for statistical advice.
Author contributions
XH performed all experiments contained within this manuscript, GR provided assistance with explanting of human tissue, KIM developed the measurement procedure and performed the analysis of raw Portable NMR data, TL viewed the patient in-life and slice mammograms to determine BI-RADS density and regions of HMD versus LMD, respectively, WDT and TEH provided the ER, PR and AR gene signatures and provided expert input in the interpretation of data, CES performed AR, PR and ER IHC of human tissue specimens, EWT and HJH equally provided expert guidance, helped conceive the study and directly influenced its direction, with HJH directly providing assistance for XH in human tissue accruals and experimentation. All authors provided intellectual input into the interpretation of data and reviewed and edited the manuscript.
Conflict of interest
The authors declare no conflict of interest.
Funding
This study was funded by the Princess Alexandra Research Foundation Research Innovation Award. The Translational Research Institute receives support from the Australian Government.
Research ethics
Informed consent was obtained from all subjects involved in the study.
References
[1] | E.J. Aiello, S.S. Tworoger, Y. Yasui, F.Z. Stanczyk, J. Potter, C.M. Ulrich, M. Irwin and A. McTiernan, Associations among circulating sex hormones, insulin-like growth factor, lipids, and mammographic density in postmenopausal women, Cancer Epidemiol Biomarkers Prev 14: ((2005) ), 1411–1417. doi:10.1158/1055-9965.EPI-04-0920. |
[2] | T.S. Ali, M.C. Tourell, H.J. Hugo, C. Pyke, S. Yang, T. Lloyd, E.W. Thompson and K.I. Momot, Transverse relaxation-based assessment of mammographic density and breast tissue composition by single-sided portable NMR, Magn Reson Med 82: ((2019) ), 1199–1213. doi:10.1002/mrm.27781. |
[3] | M. Alqurashi, K.I. Momot, A. Aamry, H. Almohammed, H. Aamri, Y.H. Johary, F.A. Abolaban and A. Sulieman, Sensing mammographic density using single-sided portable nuclear magnetic resonance, Saudi Journal of Biological Sciences 29: ((2022) ), 2447–2454. doi:10.1016/j.sjbs.2021.12.022. |
[4] | S. Azam, T. Lange, S. Huynh, A.R. Aro, M. von Euler-Chelpin, I. Vejborg, A. Tjonneland, E. Lynge and Z.J. Andersen, Hormone replacement therapy, mammographic density, and breast cancer risk: A cohort study, Cancer Causes Control 29: ((2018) ), 495–505. doi:10.1007/s10552-018-1033-0. |
[5] | K.A. Bertrand, A.H. Eliassen, S.E. Hankinson, B.A. Rosner and R.M. Tamimi, Circulating hormones and mammographic density in premenopausal women, Horm Cancer 9: ((2018) ), 117–127. doi:10.1007/s12672-017-0321-6. |
[6] | N.F. Boyd, H. Guo, L.J. Martin, L. Sun, J. Stone, E. Fishell, R.A. Jong, G. Hislop, A. Chiarelli, S. Minkin and M.J. Yaffe, Mammographic density and the risk and detection of breast cancer, N Engl J Med 356: ((2007) ), 227–236. doi:10.1056/NEJMoa062790. |
[7] | L. Brizi, M. Barbieri, F. Baruffaldi, V. Bortolotti, C. Fersini, H. Liu, M. Nogueira d’Eurydice, S. Obruchkov, F. Zong, P. Galvosas and P. Fantazzini, Bone volume-to-total volume ratio measured in trabecular bone by single-sided NMR devices, Magn Reson Med 79: ((2018) ), 501–510. doi:10.1002/mrm.26697. |
[8] | D.S. Buist, E.J. Aiello, D.L. Miglioretti and E. White, Mammographic breast density, dense area, and breast area differences by phase in the menstrual cycle, Cancer Epidemiol Biomarkers Prev 15: ((2006) ), 2303–2306. doi:10.1158/1055-9965.EPI-06-0475. |
[9] | A. Burton, G. Maskarinec, B. Perez-Gomez, C. Vachon, H. Miao, M. Lajous, R. Lopez-Ridaura, M. Rice, A. Pereira, M.L. Garmendia, R.M. Tamimi, K. Bertrand, A. Kwong, G. Ursin, E. Lee, S.A. Qureshi, H. Ma, S. Vinnicombe, S. Moss, S. Allen, R. Ndumia, S. Vinayak, S.H. Teo, S. Mariapun, F. Fadzli, B. Peplonska, A. Bukowska, C. Nagata, J. Stone, J. Hopper, G. Giles, V. Ozmen, M.E. Aribal, J. Schuz, C.H. Van Gils, J.O.P. Wanders, R. Sirous, M. Sirous, J. Hipwell, J. Kim, J.W. Lee, C. Dickens, M. Hartman, K.S. Chia, C. Scott, A.M. Chiarelli, L. Linton, M. Pollan, A.A. Flugelman, D. Salem, R. Kamal, N. Boyd, I. Dos-Santos-Silva and V. McCormack, Mammographic density and ageing: A collaborative pooled analysis of cross-sectional data from 22 countries worldwide, PLoS Med 14: ((2017) ), e1002335. doi:10.1371/journal.pmed.1002335. |
[10] | C. Byrne, G. Ursin, C.F. Martin, J.D. Peck, E.B. Cole, D. Zeng, E. Kim, M.D. Yaffe, N.F. Boyd, G. Heiss, A. McTiernan, R.T. Chlebowski, D.S. Lane, J.E. Manson, J. Wactawski-Wende and E.D. Pisano, Mammographic density change with estrogen and progestin therapy and breast cancer risk, J Natl Cancer Inst 109: ((2017) ). |
[11] | C.N. Haines, H.D. Klingensmith, M. Komara and C.J. Burd, GREB1 regulates PI3K/Akt signaling to control hormone-sensitive breast cancer proliferation, Carcinogenesis ((2020) ). |
[12] | M.M. Centenera, T.E. Hickey, S. Jindal, N.K. Ryan, P. Ravindranathan, H. Mohammed, J.L. Robinson, M.J. Schiewer, S. Ma, P. Kapur, P.D. Sutherland, C.E. Hoffmann, C.G. Roehrborn, L.G. Gomella, J.S. Carroll, S.N. Birrell, K.E. Knudsen, G.V. Raj, L.M. Butler and W.D. Tilley, A patient-derived explant (PDE) model of hormone-dependent cancer, Mol Oncol 12: ((2018) ), 1608–1622. doi:10.1002/1878-0261.12354. |
[13] | T. Cil, E. Fishell, W. Hanna, P. Sun, E. Rawlinson, S.A. Narod and D.R. McCready, Mammographic density and the risk of breast cancer recurrence after breast-conserving surgery, Cancer 115: ((2009) ), 5780–5787. doi:10.1002/cncr.24638. |
[14] | J. Crawford, C.M. Prado, M.A. Johnston, R.J. Gralla, R.P. Taylor, M.L. Hancock and J.T. Dalton, Study design and rationale for the phase 3 clinical development program of enobosarm, a selective androgen receptor modulator, for the prevention and treatment of muscle wasting in cancer patients (POWER trials), Curr Oncol Rep 18: ((2016) ), 37. doi:10.1007/s11912-016-0522-0. |
[15] | S.R. Davis, A.L. Hirschberg, L.K. Wagner, I. Lodhi and B. von Schoultz, The effect of transdermal testosterone on mammographic density in postmenopausal women not receiving systemic estrogen therapy, J Clin Endocrinol Metab 94: ((2009) ), 4907–4913. doi:10.1210/jc.2009-1523. |
[16] | R. Denholm, B.L. De Stavola, J.H. Hipwell, S.J. Doran, J.M.P. Holly, E. Folkerd, M. Dowsett, M.O. Leach, D.J. Hawkes and I. Dos-Santos-Silva, Circulating growth and sex hormone levels and breast tissue composition in young nulliparous women, Cancer Epidemiol Biomarkers Prev 27: ((2018) ), 1500–1508. doi:10.1158/1055-9965.EPI-18-0036. |
[17] | C. Dimitrakakis and C. Bondy, Androgens and the breast, Breast Cancer Res 11: ((2009) ), 212. doi:10.1186/bcr2413. |
[18] | S.W. Duffy, O.W.E. Morrish, P.C. Allgood, R. Black, M.G.C. Gillan, P. Willsher, J. Cooke, K.A. Duncan, M.J. Michell, H.M. Dobson, R. Maroni, Y.Y. Lim, H.N. Purushothaman, T. Suaris, S.M. Astley, K.C. Young, L. Tucker and F.J. Gilbert, Mammographic density and breast cancer risk in breast screening assessment cases and women with a family history of breast cancer, Eur J Cancer 88: ((2018) ), 48–56. doi:10.1016/j.ejca.2017.10.022. |
[19] | S. Elsamany, A. Alzahrani, W.N. Abozeed, A. Rasmy, M.U. Farooq, M.A. Elbiomy, E. Rawah, K. Alsaleh and N.M. Abdel-Aziz, Mammographic breast density: Predictive value for pathological response to neoadjuvant chemotherapy in breast cancer patients, Breast 24: ((2015) ), 576–581. doi:10.1016/j.breast.2015.05.007. |
[20] | M. Gabrielson, S. Azam, E. Hardell, M. Holm, K.A. Ubhayasekera, M. Eriksson, M. Backlund, J. Bergquist, K. Czene and P. Hall, Hormonal determinants of mammographic density and density change, Breast Cancer Res 22: ((2020) ), 95. doi:10.1186/s13058-020-01332-4. |
[21] | G.A. Greendale, B.A. Reboussin, A. Sie, H.R. Singh, L.K. Olson, O. Gatewood, L.W. Bassett, C. Wasilauskas, T. Bush and E. Barrett-Connor, Effects of estrogen and estrogen-progestin on mammographic parenchymal density. Postmenopausal estrogen/progestin interventions (PEPI) investigators, Ann Intern Med 130: ((1999) ), 262–269. |
[22] | B.P. Haynes, O. Ginsburg, Q. Gao, E. Folkerd, M. Afentakis, R. Buus, L.H. Quang, P. Thi Han, P.H. Khoa, N.V. Dinh, T.V. To, M. Clemons, C. Holcombe, C. Osborne, A. Evans, A. Skene, M. Sibbering, C. Rogers, S. Laws, L. Noor, I.E. Smith and M. Dowsett, Menstrual cycle associated changes in hormone-related gene expression in oestrogen receptor positive breast cancer, NPJ Breast Cancer 5: ((2019) ), 42. doi:10.1038/s41523-019-0138-2. |
[23] | S.L. Heller, L.L. Young Lin, A.N. Melsaether, L. Moy and Y. Gao, Hormonal effects on breast density, fibroglandular tissue, and background parenchymal enhancement, Radiographics 38: ((2018) ), 983–996. doi:10.1148/rg.2018180035. |
[24] | T.E. Hickey, J.L. Robinson, J.S. Carroll and W.D. Tilley, Minireview: The androgen receptor in breast tissues: Growth inhibitor, tumor suppressor, oncogene?, Mol Endocrinol 26: ((2012) ), 1252–1267. doi:10.1210/me.2012-1107. |
[25] | T.E. Hickey, L.A. Selth, K.M. Chia, G. Laven-Law, H.H. Milioli, D. Roden, S. Jindal, M. Hui, J. Finlay-Schultz, E. Ebrahimie, S.N. Birrell, S. Stelloo, R. Iggo, S. Alexandrou, C.E. Caldon, T.M. Abdel-Fatah, I.O. Ellis, W. Zwart, C. Palmieri, C.A. Sartorius, A. Swarbrick, E. Lim, J.S. Carroll and W.D. Tilley, The androgen receptor is a tumor suppressor in estrogen receptor-positive breast cancer, Nat Med ((2021) ). |
[26] | A.L. Hirschberg, E. Tani, K. Brismar and E. Lundstrom, Effects of drospirenone and norethisterone acetate combined with estradiol on mammographic density and proliferation of breast epithelial cells-A prospective randomized trial, Maturitas 126: ((2019) ), 18–24. doi:10.1016/j.maturitas.2019.04.205. |
[27] | M. Hofling, E. Lundstrom, E. Azavedo, G. Svane, A.L. Hirschberg and B. von Schoultz, Testosterone addition during menopausal hormone therapy: Effects on mammographic breast density, Climacteric 10: ((2007) ), 155–163. doi:10.1080/13697130701258812. |
[28] | J.L. Hopper, Odds per adjusted standard deviation: Comparing strengths of associations for risk factors measured on different scales and across diseases and populations, Am J Epidemiol 182: ((2015) ), 863–867. doi:10.1093/aje/kwv193. |
[29] | J.L. Hopper, T.L. Nguyen, D.F. Schmidt, E. Makalic, Y.M. Song, J. Sung, G.S. Dite, J.G. Dowty and S. Li, Going beyond conventional mammographic density to discover novel mammogram-based predictors of breast cancer risk, J Clin Med 9: ((2020) ). |
[30] | G. Hovhannisyan, L. Chow, A. Schlosser, M.J. Yaffe, N.F. Boyd and L.J. Martin, Differences in measured mammographic density in the menstrual cycle, Cancer Epidemiol Biomarkers Prev 18: ((2009) ), 1993–1999. doi:10.1158/1055-9965.EPI-09-0074. |
[31] | D.G. Hu, L.A. Selth, G.A. Tarulli, R. Meech, D. Wijayakumara, A. Chanawong, R. Russell, C. Caldas, J.L. Robinson, J.S. Carroll, W.D. Tilley, P.I. Mackenzie and T.E. Hickey, Androgen and estrogen receptors in breast cancer coregulate human UDP-glucuronosyltransferases 2B15 and 2B17, Cancer Res 76: ((2016) ), 5881–5893. doi:10.1158/0008-5472.CAN-15-3372. |
[32] | X. Huang, T.S. Ali, T. Nano, T. Blick, B.W. Tse, K. Sokolowski, M.C. Tourell, T. Lloyd, E.W. Thompson, K.I. Momot and H.J. Hugo, Quantification of breast tissue density: Correlation between single-sided portable NMR and micro-CT measurements, Magn Reson Imaging 62: ((2019) ), 111–120. doi:10.1016/j.mri.2019.06.006. |
[33] | X. Huang, G. Reye, K.I. Momot, T. Blick, T. Lloyd, W.D. Tilley, T.E. Hickey, C.E. Snell, R.K. Okolicsanyi, L.M. Haupt, V. Ferro, E.W. Thompson and H.J. Hugo, Heparanase promotes syndecan-1 expression to mediate fibrillar collagen and mammographic density in human breast tissue cultured ex vivo, Front Cell Dev Biol 8: ((2020) ), 599. doi:10.3389/fcell.2020.00599. |
[34] | H.J. Hugo, L. Pereira, R. Suryadinata, Y. Drabsch, T.J. Gonda, N.P. Gunasinghe, C. Pinto, E.T. Soo, B.J. van Denderen, P. Hill, R.G. Ramsay, B. Sarcevic, D.F. Newgreen and E.W. Thompson, Direct repression of MYB by ZEB1 suppresses proliferation and epithelial gene expression during epithelial-to-mesenchymal transition of breast cancer cells, Breast Cancer Res 15: ((2013) ), R113. doi:10.1186/bcr3580. |
[35] | Y.J. Lee and J. Gorski, Estrogen-induced transcription of the progesterone receptor gene does not parallel estrogen receptor occupancy, Proc Natl Acad Sci U S A 93: ((1996) ), 15180–15184. doi:10.1073/pnas.93.26.15180. |
[36] | J. Li, L. Eriksson, K. Humphreys, K. Czene, J. Liu, R.M. Tamimi, S. Lindstrom, D.J. Hunter, C.M. Vachon, F.J. Couch, C.G. Scott, P. Lagiou and P. Hall, Genetic variation in the estrogen metabolic pathway and mammographic density as an intermediate phenotype of breast cancer, Breast Cancer Res 12: ((2010) ), R19. doi:10.1186/bcr2488. |
[37] | S.K. Low, Y.M. Chin, H. Ito, K. Matsuo, C. Tanikawa, K. Matsuda, H. Saito, M. Sakurai-Yageta, N. Nakaya, A. Shimizu, S.S. Nishizuka, T. Yamaji, N. Sawada, M. Iwasaki, S. Tsugane, T. Takezaki, S. Suzuki, M. Naito, K. Wakai, Y. Kamatani, Y. Momozawa, Y. Murakami, J. Inazawa, Y. Nakamura, M. Kubo, T. Katagiri and Y. Miki, Identification of two novel breast cancer loci through large-scale genome-wide association study in the Japanese population, Sci Rep 9: ((2019) ), 17332. doi:10.1038/s41598-019-53654-9. |
[38] | E. Lundstrom, K. Carlstrom, S. Naessen and G. Soderqvist, Dehydroepiandrosterone and/or its metabolites: Possible androgen receptor antagonistic effects on digitized mammographic breast density in normal breast tissue of postmenopausal women, Horm Mol Biol Clin Investig 35: ((2018) ). |
[39] | V.A. McCormack and I. dos Santos Silva, Breast density and parenchymal patterns as markers of breast cancer risk: A meta-analysis, Cancer Epidemiol Biomarkers Prev 15: ((2006) ), 1159–1169. doi:10.1158/1055-9965.EPI-06-0034. |
[40] | N.D. McKay-Parry, T. Blick, S. Foongkajornkiat, T. Lloyd, E.W. Thompson, H.J. Hugo and K.I. Momot, Portable NMR for quantification of breast density in vivo: Proof-of-concept measurements and comparison with quantitative MRI, Magnetic Resonance Imaging 92: ((2022) ), 212–223. doi:10.1016/j.mri.2022.07.004. |
[41] | K.M. McNamara, N.L. Moore, T.E. Hickey, H. Sasano and W.D. Tilley, Complexities of androgen receptor signalling in breast cancer, Endocr Relat Cancer 21: ((2014) ), T161–T181. doi:10.1530/ERC-14-0243. |
[42] | E. Nolan, G.J. Lindeman and J.E. Visvader, Out-RANKing BRCA1 in mutation carriers, Cancer Res 77: ((2017) ), 595–600. doi:10.1158/0008-5472.CAN-16-2025. |
[43] | S. Ponnusamy, S. Asemota, L.S. Schwartzberg, F. Guestini, K.M. McNamara, M. Pierobon, A. Font-Tello, X. Qiu, Y. Xie, P.K. Rao, T. Thiyagarajan, B. Grimes, D.L. Johnson, M.D. Fleming, F.E. Pritchard, M.P. Berry, R. Oswaks, R.E. Fine, M. Brown, H. Sasano, E.F. Petricoin, H.W. Long and R. Narayanan, Androgen receptor is a non-canonical inhibitor of wild-type and mutant estrogen receptors in hormone receptor-positive breast cancers, iScience 21: ((2019) ), 341–358. doi:10.1016/j.isci.2019.10.038. |
[44] | C. Recchione, E. Venturelli, A. Manzari, A. Cavalleri, A. Martinetti and G. Secreto, Testosterone, dihydrotestosterone and oestradiol levels in postmenopausal breast cancer tissues, J Steroid Biochem Mol Biol 52: ((1995) ), 541–546. doi:10.1016/0960-0760(95)00017-T. |
[45] | G. Reid, M.R. Hubner, R. Metivier, H. Brand, S. Denger, D. Manu, J. Beaudouin, J. Ellenberg and F. Gannon, Cyclic, proteasome-mediated turnover of unliganded and liganded ERalpha on responsive promoters is an integral feature of estrogen signaling, Mol Cell 11: ((2003) ), 695–707. doi:10.1016/S1097-2765(03)00090-X. |
[46] | C.M. Rutter, M.T. Mandelson, M.B. Laya, D.J. Seger and S. Taplin, Changes in breast density associated with initiation, discontinuation, and continuing use of hormone replacement therapy, JAMA 285: ((2001) ), 171–176. doi:10.1001/jama.285.2.171. |
[47] | M. Safran, N. Rosen, M. Twik, R. BarShir, T.I. Stein, D. Dahary, S. Fishilevich and D. Lancet, The GeneCards suite, in: Practical Guide to Life Science Databases, I. Abugessaisa and T. Kasukawa, eds, Springer Nature Singapore, Singapore, (2021) , pp. 27–56. doi:10.1007/978-981-16-5812-9_2. |
[48] | H. Sartor, S. Zackrisson, K. Elebro, L. Hartman and S. Borgquist, Mammographic density in relation to tumor biomarkers, molecular subtypes, and mode of detection in breast cancer, Cancer Causes Control 26: ((2015) ), 931–939. doi:10.1007/s10552-015-0576-6. |
[49] | A.M. Sieuwerts, G. De Napoli, A. van Galen, H.J. Kloosterboer, V. de Weerd, H. Zhang, J.W. Martens, J.A. Foekens and C. De Geyter, Hormone replacement therapy dependent changes in breast cancer-related gene expression in breast tissue of healthy postmenopausal women, Mol Oncol 5: ((2011) ), 504–516. doi:10.1016/j.molonc.2011.09.003. |
[50] | V. Sigl, K. Owusu-Boaitey, P.A. Joshi, A. Kavirayani, G. Wirnsberger, M. Novatchkova, I. Kozieradzki, D. Schramek, N. Edokobi, J. Hersl, A. Sampson, A. Odai-Afotey, C. Lazaro, E. Gonzalez-Suarez, M.A. Pujana, F. Cimba, H. Heyn, E. Vidal, J. Cruickshank, H. Berman, R. Sarao, M. Ticevic, I. Uribesalgo, L. Tortola, S. Rao, Y. Tan, G. Pfeiler, E.Y. Lee, Z. Bago-Horvath, L. Kenner, H. Popper, C. Singer, R. Khokha, L.P. Jones and J.M. Penninger, RANKL/RANK control Brca1 mutation, Cell Res 26: ((2016) ), 761–774. doi:10.1038/cr.2016.69. |
[51] | E.R. Simpson, Aromatization of androgens in women: Current concepts and findings, Fertil Steril 77: (Suppl 4) ((2002) ), S6–S10. doi:10.1016/S0015-0282(02)02984-9. |
[52] | A.T. Toriola, C.M. Appleton, X. Zong, J. Luo, K. Weilbaecher, R.M. Tamimi and G.A. Colditz, Circulating receptor activator of nuclear factor-kappaB (RANK), RANK ligand (RANKL), and mammographic density in premenopausal women, Cancer Prev Res (Phila) 11: ((2018) ), 789–796. doi:10.1158/1940-6207.CAPR-18-0199. |
[53] | A.T. Toriola, H.X. Dang, I.S. Hagemann, C.M. Appleton, G.A. Colditz, J. Luo and C.A. Maher, Increased breast tissue receptor activator of nuclear factor-kappaB ligand (RANKL) gene expression is associated with higher mammographic density in premenopausal women, Oncotarget 8: ((2017) ), 73787–73792. doi:10.18632/oncotarget.17909. |
[54] | M.C. Tourell, T.S. Ali, H.J. Hugo, C. Pyke, S. Yang, T. Lloyd, E.W. Thompson and K.I. Momot, T1-based sensing of mammographic density using single-sided portable NMR, Magn Reson Med 80: ((2018) ), 1243–1251. doi:10.1002/mrm.27098. |
[55] | V.J. Tuominen, S. Ruotoistenmaki, A. Viitanen, M. Jumppanen and J. Isola, ImmunoRatio: A publicly available web application for quantitative image analysis of estrogen receptor (ER), progesterone receptor (PR), and Ki-67, Breast Cancer Res 12: ((2010) ), R56. doi:10.1186/bcr2615. |
[56] | M. Van Landeghem, E. Danieli, J. Perlo, B. Blumich and F. Casanova, Low-gradient single-sided NMR sensor for one-shot profiling of human skin, J Magn Reson 215: ((2012) ), 74–84. doi:10.1016/j.jmr.2011.12.010. |
[57] | E. White, P. Velentgas, M.T. Mandelson, C.D. Lehman, J.G. Elmore, P. Porter, Y. Yasui and S.H. Taplin, Variation in mammographic breast density by time in menstrual cycle among women aged 40–49 years, J Natl Cancer Inst 90: ((1998) ), 906–910. doi:10.1093/jnci/90.12.906. |


