
Novel application of confocal Raman microscopy to determine the microstructure of fermented dairy products including the spatial distribution of proteins, lipids and carbohydrates
Abstract
Background:
The distribution of components in fermented dairy products forms the microstructure which influences final product texture and taste. Confocal Raman microscopy may provide new molecular information on product structure not possible with other advanced microscopy techniques.
Objective:
Dairy products including non-fat and full fat yoghurt, Camembert and Cheddar cheese samples were surveyed and the product microstructure observed using confocal Raman microscopy in order to determine the applicability of the technique to dairy product analysis.
Methods:
Confocal Raman microscopy provided spatially resolved chemical information on the components of fermented dairy products. In conjunction with component analysis and exploratory data analysis, spatially resolved chemical information on the components of fermented dairy products was obtained and compared.
Results:
Yoghurts with differing fat levels displayed different microstructures, consistent with other techniques. The influence of different molecular structures on the Camembert cheese centre and surface was revealed and Raman microscopy also gave new insights on the chemical structures within Cheddar cheese.
Conclusions:
The method provides a new technique for observing the contribution of different components to the product microstructure that may be used to monitor product quality and guide product development.
1.Introduction
Raman spectroscopy has been applied to study various food systems as a non-destructive method to assess chemical information. As Raman scattering is stronger for non-polar bonds, the technique has traditionally found more applications in lipids and fat-rich products and has been applied to foods such as potato chips as a rapid technique for determining fat content [29], to beef in order to predict sensory quality properties [42] and to determine interactions and migration between food components and packaging [28]. Raman spectroscopy has also been applied to lipid-rich dairy products. Primarily studies have focussed on detecting adulteration with non-dairy ingredients of products such as milk [2,34], dairy powders and infant formula [35,39] or dairy cream [31]. However, some studies have also applied the technique to detect structural changes on heating or freezing in anhydrous milk fat [21] and semi-hard cheese [13]. Chemometric techniques such as multivariate data analysis are often used with Raman spectroscopic data to enable discrimination of datasets.
Fermented dairy products such as cheese and yoghurt consist of complex ingredient interactions that influence the product structure and texture [10]. The microstructure of dairy products containing polysaccharides has been examined by confocal laser scanning microscopy (CLSM) [4], however structural information is limited to those components that can be fluorescently stained and sample preparation can be complicated. Often studies employ CLSM to observe the protein network, which can be easily imaged, and draw conclusions on ingredient interactions based on the protein structural information [8,40]. This method has some limitations, as the unstained ingredients are not directly observed and thus their contribution to the structure is inferred from the stained, usually protein, components.
Spatially resolved information is possible when Raman spectroscopy is combined with a microscope. Raman microscopy can provide label-free data on the molecular structure of components such as lipids, proteins and carbohydrates in a sample with minimal sample preparation. The microscopy technique has found applications to detect differences in ingredient distribution in processed cheese [38] and Cheddar cheese [18] as well as lipid composition in milk fat globules [14]. However, these studies were limited to visual observations of component intensity maps and spectral information as they did not employ chemometrics to interpret the data. When Raman spectroscopic data is combined with chemometric techniques, detection and quantification of components at low concentration in spreadable cheese was possible [36], highlighting the potential of the technique.
The global production of milk and subsequent dairy products is gradually increasing [12]. In particular, the European Union contributes approximately one third of the 2.57 million tonnes of cheese that were exported globally in 2018 [12]. Dairy products are a diverse range of foods that have varying composition, production and final product uses that make their characterisation important for manufacturing and consumer acceptability. Raman microscopy has the potential to provide new direct molecular information on components in fermented dairy products that is not possible through other microscopy techniques without complex sample preparation. The technique may be applied to understand chemical structure and interactions to assist the development of novel structures and textures in dairy products.
In the present study, the distribution of ingredients in fermented dairy products was assessed using Raman microscopy. Greek style full fat yoghurt and non-fat yoghurt were compared as well as Camembert and Cheddar cheese. Variation in components such as lipids, proteins, water and carbohydrates was monitored to obtain spatially resolved structural information. Chemometric techniques were applied to establish differences in molecular information in dairy products and show the potential of the confocal Raman microscopy technique for structural characterisation.
2.Materials and methods
2.1.Dairy samples and sample preparation
Cheese and yoghurt samples were purchased at a local supermarket in Ireland. Two different types of yoghurt were obtained; Greek style full fat and non-fat. A Camembert cheese and a mature Cheddar cheese were also purchased. The composition of the dairy products are summarised in Table 1. Samples were stored at 4°C until immediately prior to analysis.
Table 1
Composition of dairy samples used for confocal Raman microscopic analysis
| Sample | Fat (%) | Protein (%) | Carbohydrates (%) |
| Greek style full fat yoghurt | 9.5 | 4.8 | 6.4 |
| Non-fat yoghurt | <0.5 | 4.8 | 7.8 |
| Camembert cheese | 22 | 19 | <0.5 |
| Cheddar cheese | 35 | 25 | <0.5 |
2.2.Confocal Raman microscopy of dairy samples
Confocal Raman microscopy measurements were performed using a WITec alpha300R (Ulm, Germany) system equipped with a thermoelectrically cooled CCD detector. A 532 nm laser was used for excitation at 30 mW power. WITec Control 5.0 software was used to operate the system and collect data.
Samples were prepared with a surgical blade to approximately 5 × 5 × 2 mm and transferred to a glass slide immediately prior to imaging. A 50× objective (NA = 0.55) was used to acquire spatially-resolved spectral data of the samples with a calculated spatial resolution of 0.6 μm according to the Rayleigh criterion.
The data collection and imaging parameters were slightly different for the various samples. The sampled area of yoghurts and Cheddar cheese was 25 × 25 μm with 75 × 75 spectra collected to give 5625 spectra per sample and a measurement time of approximately 20 minutes. The Camembert sampled area was 60 × 60 μm with 200 × 200 spectra collected to give 40000 spectra per sample with a measurement time of approximately 130 minutes. The Raman spectrum was collected in the range 3600–40 cm−1 with an integration time of 0.2 seconds. Samples did not appear to experience drying out in the time taken to collect the data. Each sample was measured in duplicate to give two spectral maps per sample with one representative sample shown.
2.3.Data processing and multivariate data analysis
After data collection, cosmic ray removal (filter size 3, dynamic factor 8) and background subtraction (shape size 250, noise factor 1) was conducted using Project Plus software (WITec).
The True Component Analysis package (WITec) was employed to characterise the key regions of interest in each sample and generate component intensity maps as well averaged spectra representative of each component. For yoghurt and Cheddar cheese samples three components were applied to represent the sampled area. For Camembert cheese samples two components were deemed adequate to represent the sampled area.
The averaged component spectra for each sample were extracted and imported into the Unscrambler® 10.1 software (CAMO Software AS., Oslo, Norway). Principal Component Analysis (PCA) using the spectral range 3600–400 cm−1 was used to explore differences between paired samples; the surface and centre of Camembert cheese and the Greek style full fat and non-fat yoghurts as well as to examine differences within Cheddar cheese samples. Further data processing was not deemed necessary in the present case due to the clear observation of spectral features possible in the minimally processed data.
2.4.Cryo scanning electron microscopy of yoghurt samples
The Greek style full fat and non-fat yoghurts were analysed by cryo scanning electron microscopy (cryo-SEM) following a previously published method [37]. Yoghurt microstructure was observed using a scanning electron microscope (SEM; Zeiss Supra 40VP field emission, Carl Zeiss AG, Darmstadt, Germany) with a cryo sample preparation system (Gatan Alto 2500, Gatan UK). Fresh samples were rapidly immersed in liquid nitrogen slush (−210°C) and transferred under vacuum to the cryo-preparation chamber maintained at −140°C. The samples were fractured with a scalpel blade and followed by etching at −95°C. Sputter coating was conducted at −140°C and the sample transferred to the SEM cold stage maintained at −140°C. Cryo-SEM micrographs were collected over a range of magnifications with one representative image shown per sample. The yoghurt microstructure observed by cryo-SEM was used as a comparison to that observed using confocal Raman microscopy.
3.Results and discussion
3.1.Confocal Raman microscopy of yoghurt samples
Confocal Raman microscopy images of two yoghurt samples with differing fat contents were collected and compared. Both the Greek style full fat and the non-fat yoghurts contained several characteristic peaks representing the pyranose ring of carbohydrates at 476 cm−1 [38] and associated with proteins at ∼1456 cm−1 and carotenoids at 1520–1530 cm−1 [30] (Fig. 1). The peak at 2432 cm−1 was tentatively assigned to atmospheric CO2 [15].
Fig. 1.
Confocal Raman images showing the distribution of three components for Greek style full fat (a–c) and non-fat (e–g) yoghurt. Light areas indicate high component intensity and dark areas indicate low component intensity. The combined overlay images are also shown for full fat (d) and non-fat (h) yoghurt. The average spectra for each of the identified components are shown for full fat (i) and non-fat (j) yoghurt samples. The scale bars are 5 μm in length in all images. Each set of images is representative of two collected datasets. The colour version is available online.
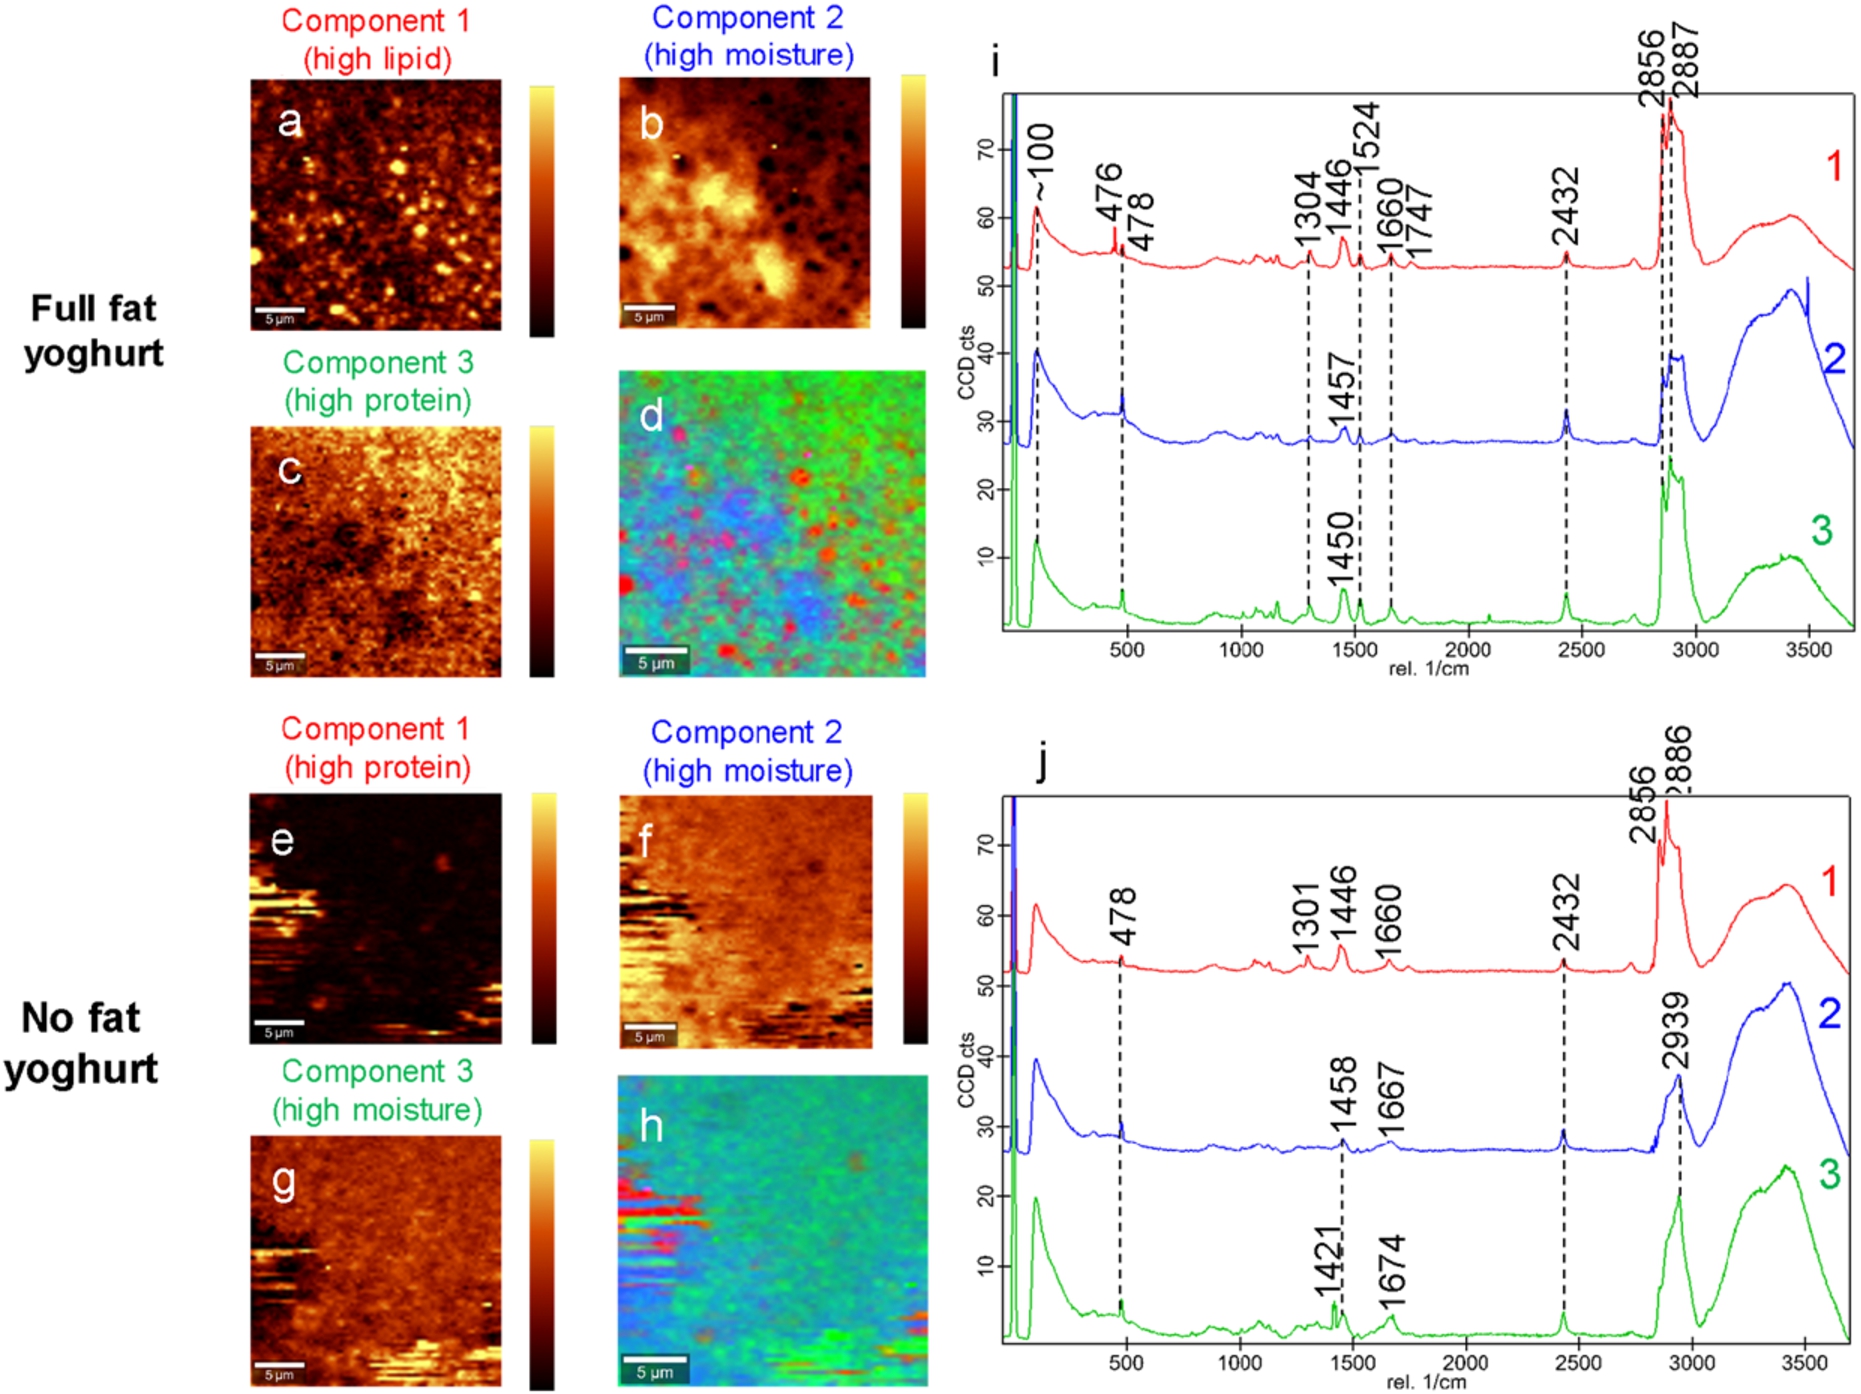
In addition, the Greek style full fat yoghurt samples had characteristic peaks associated with lipids that were not present in the non-fat yoghurt sample, namely at 1660 cm−1 assigned to lipids as well as amide I proteins [30], at ∼1750 cm−1 and 2856 cm−1 associated with lipids and at ∼2887 cm−1 associated with proteins and lipids [30].
Using the True Component software, the two different yoghurt samples were both described by three components each (Fig. 1). In the full fat yoghurt, the first component tended to describe lipids in the sample, as supported by the lipid peaks at ∼1750 cm−1 and 2856 cm−1 with peaks at 1660 cm−1 and ∼2887 cm−1 covering both lipids and protein absorbance (Fig. 1a). The second component tended to describe moisture or water, as evidenced by the broad OH band at 3600-3300 cm−1 (Fig. 1b). The third component described mostly protein in the sample, with some peaks also associated with lipids here (Fig. 1c). All components in the full fat yoghurt also had peaks associated with carbohydrates (478 cm−1) and atmospheric CO2 (2432 cm−1).
For the non-fat yoghurt, the first component tended to describe proteins and residual lipids in the sample (Fig. 1e). The second and third components both contained a large amount of moisture as well as peaks associated with proteins and lipids such as at 1421 cm−1, 1458 cm−1 and ∼1670 cm−1 (Fig. 1f–g). All components in the non-fat yoghurt had peaks associated with carbohydrates (478 cm−1) and atmospheric CO2 (2432 cm−1). As noted in the non-fat yoghurt composition (Table 1), residual lipids of less than 0.5% were likely present in the sample and may account for the presence of lipid related peaks in the Raman spectra.
In order to confirm the microstructure of yoghurt samples observed by confocal Raman microscopy, cryo-scanning electron microscopy (cryo-SEM) was also employed. The microstructure of Greek style full fat yoghurt contained a dense protein network that appeared well interconnected (Fig. 2a). The compact protein network in the Greek style full fat yoghurt contained small serum pores and was interspersed with fat globules. In contrast, the non-fat yoghurt structure appeared relatively open and porous (Fig. 2b). The non-fat yoghurt contained comparatively larger protein strands with correspondingly larger serum pores and likely fewer connections or cross-linking of protein strands. These microstructures are consistent with the literature [32,33].
Fig. 2.
Cryo-SEM micrographs of Greek style full fat (a) and non-fat (b) yoghurts. Orange arrows indicate individual fat globules. Images were taken at approximately 4000× magnification with scale bars 2 μm in length. The colour version is available online.
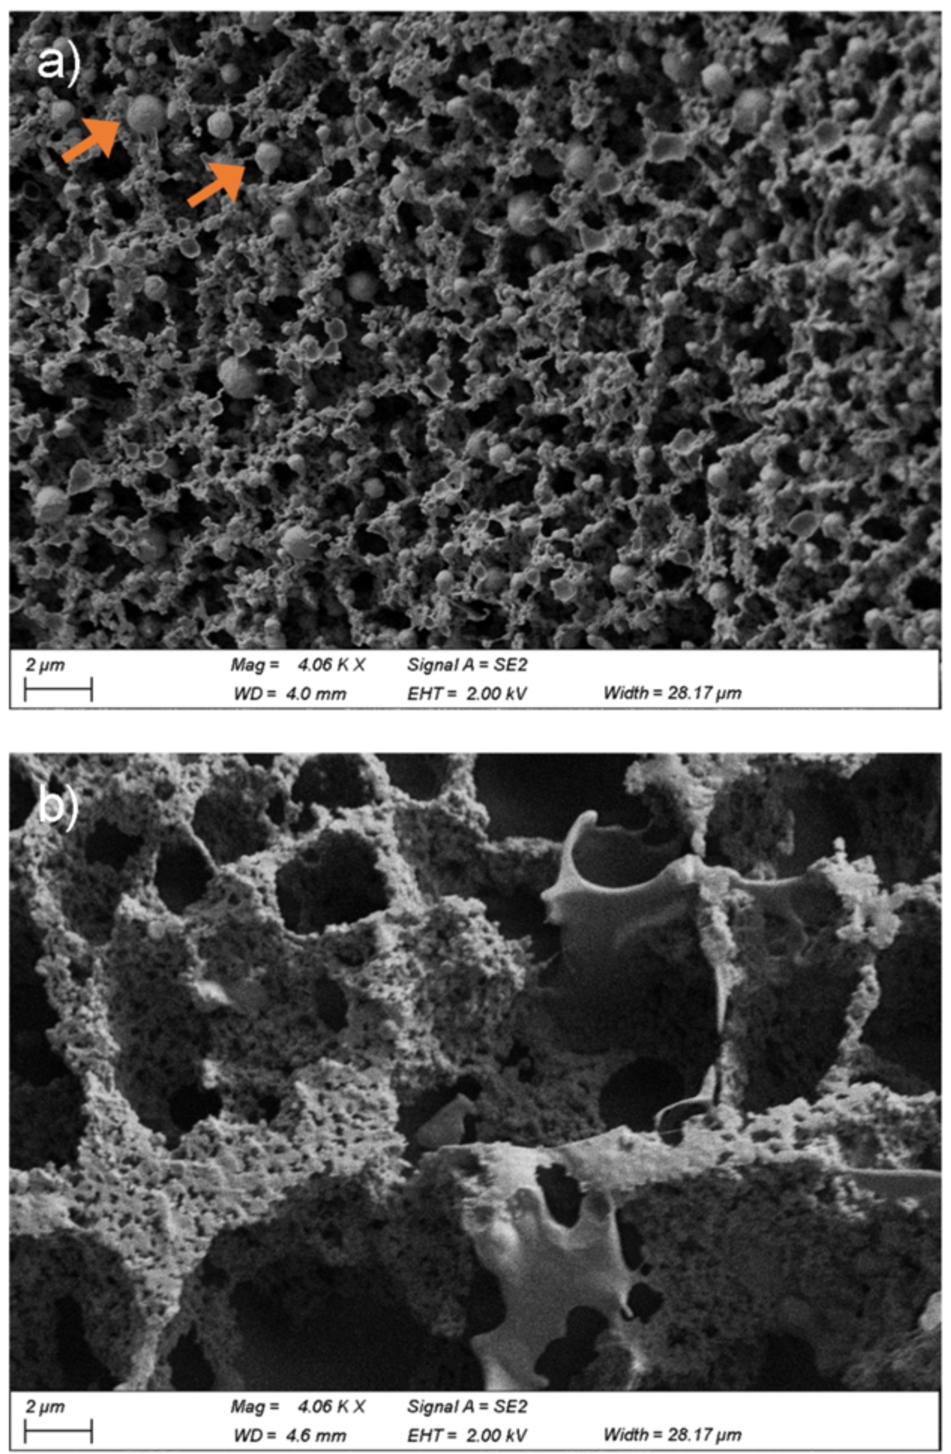
The microstructure observed by cryo-SEM is consistent with that observed by Raman microscopy for the Greek style yoghurt, including the presence of individual fat globules. In the case of the non-fat yoghurt, the structural similarity was not as pronounced and it appears that the optical tweezers effect has occurred whilst imaging the sample [25]. The optical tweezers effect occurs where a laser beam provides, in this case, an attractive force to particles that can cause them to be physically moved at a microscopic level [41].
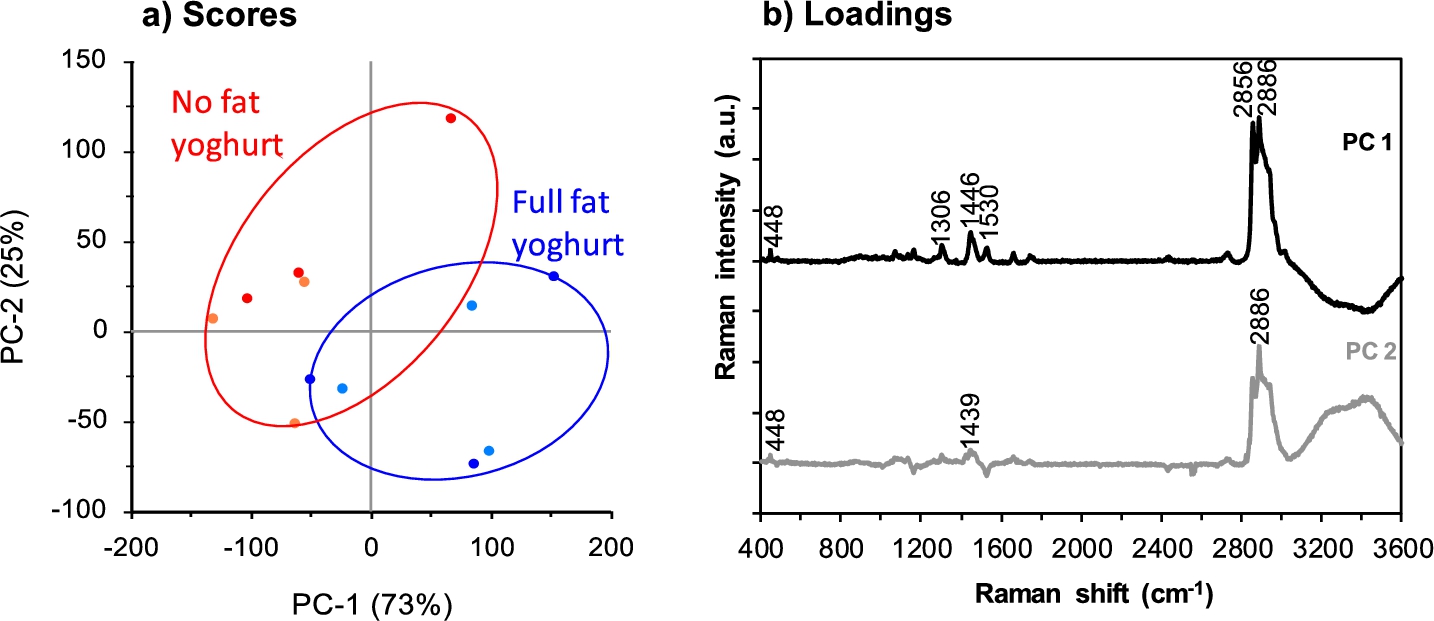
PCA was applied to the spectral region 3600–400 cm−1 to explore differences between samples based on their averaged component spectra. The Greek style full fat yoghurt was clearly distinct from the non-fat yoghurt (Fig. 3a). The two types of yoghurt were separated in PC1 due to lipid related peaks, which described 73% of variation between points and accounted mostly for the variation within the spectra for each yoghurt type (Fig. 3b). The lipid peaks identified in PC1 were 2856 cm−1 and ∼1446 cm−1 as well as the protein dominant peak at ∼2886 cm−1 with lesser contributions from the peak associated with carotenoids at 1530 cm−1 [30,38]. The variation within each yoghurt type was also accounted for in PC2, which described 25% of the variation between data points and the spread between each sample type. The differences in PC2 were mainly attributed to the large protein dominant peak at ∼2886 cm−1.
Fig. 3.
PCA scores (a) and loadings plots (b) for spectra in the collected region 3600–400 cm−1 for Greek style full fat (two replicate samples shown in dark blue and light blue) and non-fat (two replicate samples shown in red and orange) yoghurt samples. Three spectra were used to represent each sample based on the True Component Analysis. The colour version is available online.
The combination of the spectral data and exploratory data analysis like PCA provides a way to explore similar samples that does not rely on visual observation of micrographs. Here, the Greek style full fat yoghurt observed by confocal Raman microscopy had a microstructure similar to that observed by other microscopy techniques. Despite some difficulties imaging non-fat yoghurt, likely due to the optical tweezers effect, at a similar length scale the features, such as some high protein areas, are largely similar to that observed by other microscopy techniques. The reduction in protein network detail and a coarser protein network with lower fat content in yoghurts is in agreement with previous studies [17,19]. The protein network structure is likely important in determining the final yoghurt viscosity and consistency, with a less coarse protein network leading to a smoother product.
3.2.Raman microscopy of Camembert cheese
Confocal Raman microscopy allowed the chemical structure of Camembert cheese to be spatially mapped. Both the centre and the surface of the Camembert cheese had some common features, with key differences in some peaks as would be expected due to the differing compositions in these sections of the cheese [1,27]. In particular, the presence of the lactose and monosaccharides peak at 1162 cm−1 in the centre of Camembert cheese only is consistent with prior observations that lactose and related monosaccharides are consumed faster on the surface due to microbial activity and remain present in the centre of the cheese with up to four weeks of ripening [11,22]. Key peaks present in both sections of Camembert were associated with lipids and proteins at 1662 cm−1, carotenoids at 1525 cm−1 and proteins at 1457 cm−1 [24,30,38]. The peak at 479 cm−1 associated with the pyranose ring of carbohydrates [38] was also present in both Camembert sections. The peak at 2432 cm−1 is likely associated with atmospheric CO2 [15].
The structure of the surface of the Camembert cheese (Fig. 4a–c) displayed the characteristic fungal strands or hyphae that would be expected for a white mould cheese that contains the filamentous Penicillium camemberti and Geotrichum candidum species [7,26]. A previous study that used SEM observed hyphae that were 10 μm after an initial ripening period, consistent with the features seen here in Fig. 4a–c [26]. The first component identified on the surface of Camembert cheese was mainly associated with protein peaks (Fig. 4a). The second component also contained many of the same peaks, with the difference being an increase in the peaks associated with CO2 and moisture (Fig. 4b). There were several peaks identified in both surface components, discussed together here. A sharp peak at 2940 cm−1 associated with methyl stretching of proteins and lipids [30] was a key feature of the surface of the cheese sample (Fig. 4g). There was a protein peak located at 1589 cm−1 attributed to phenylalanine [6]. The surface of Camembert cheese also contained lipid peaks that were not in the centre section of the cheese at 1130 cm−1 and 1314 cm−1 as well as a CO2 peak at ∼2300 cm−1 [25] in addition to the one at 2432 cm−1 present in all other Camembert spectra.
Fig. 4.
Confocal Raman images showing the distribution of two components for the Camembert cheese surface (a–b) and centre (d–e). Light areas indicate high component intensity and dark areas indicate low component intensity. The combined overlay images are also shown for the surface (c) and centre (f) of Camembert cheese. The average spectra for each of the identified components are also shown for the Camembert surface (g) and centre (h). The scale bars are 10 μm in length in all images. Each set of images is representative of two collected datasets. The colour version is available online.
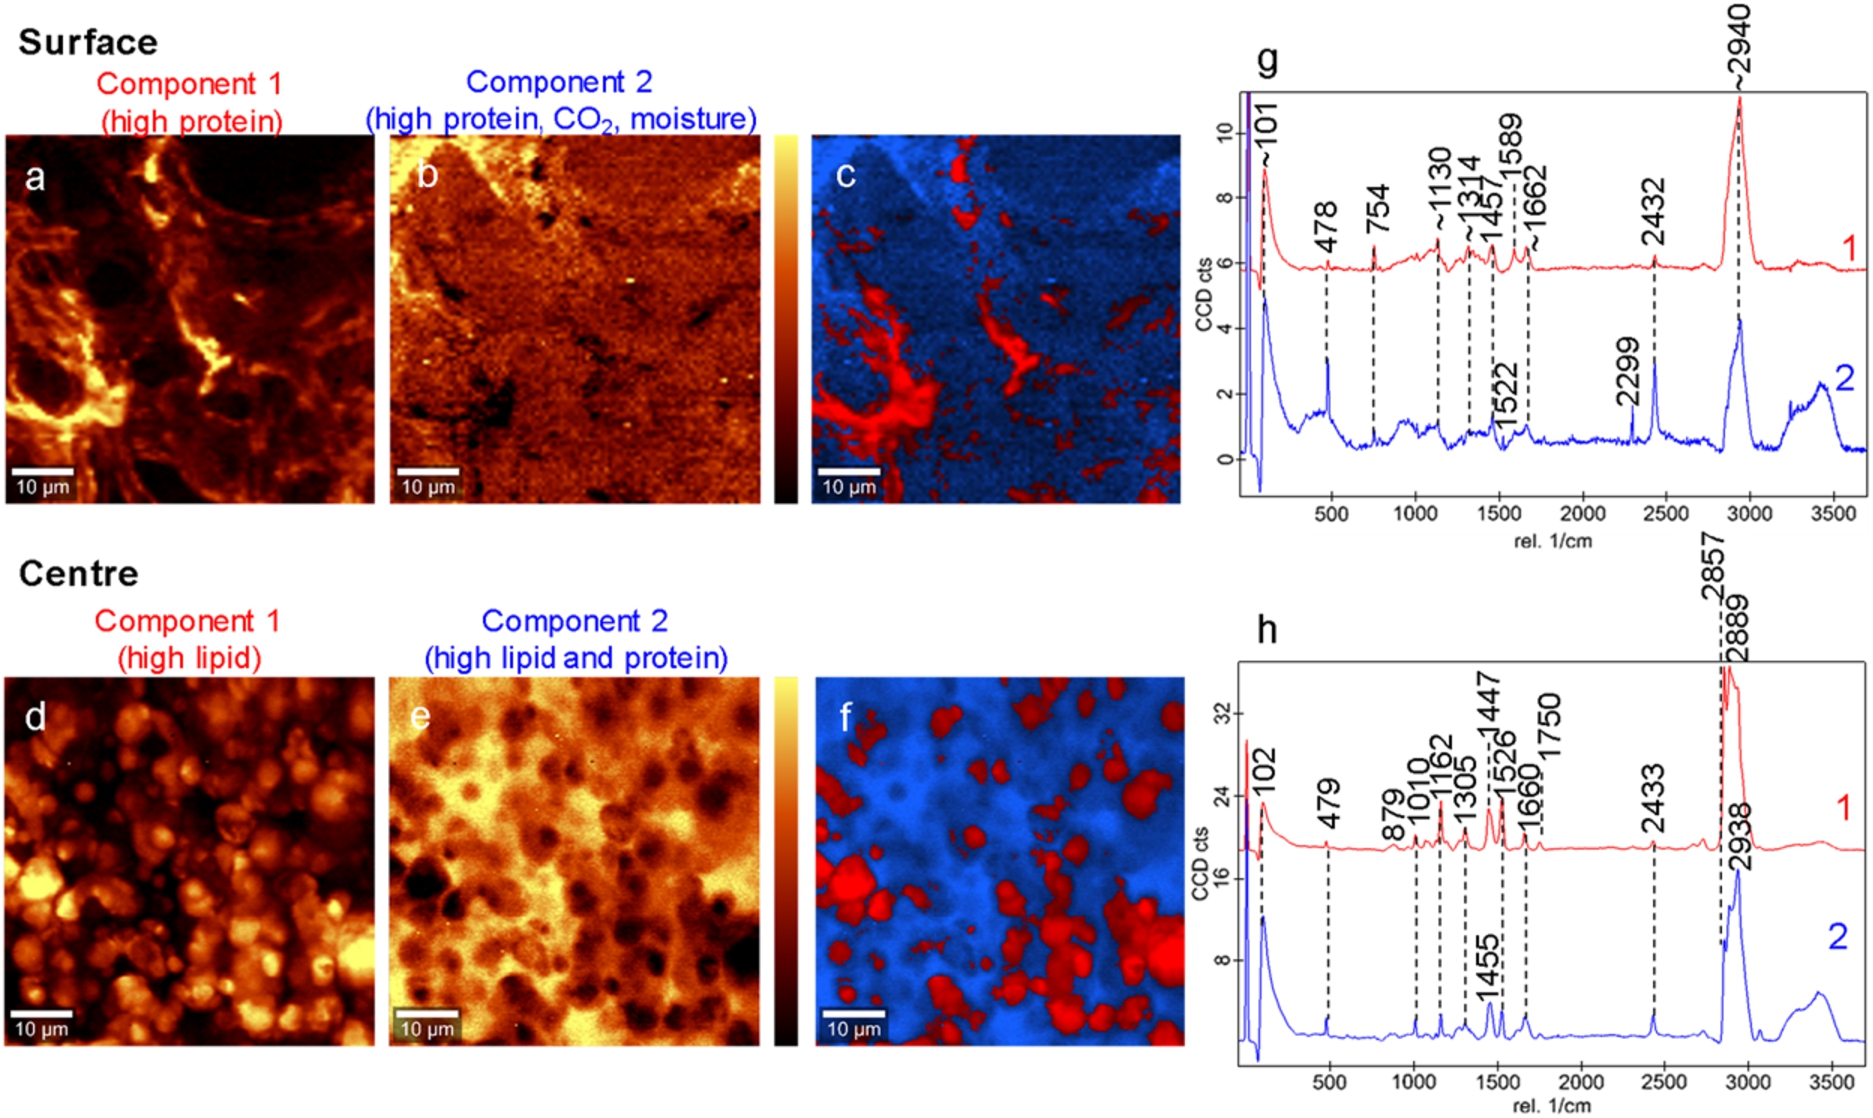
The two components that described the centre of the Camembert cheese also contained similar peaks, with some variation in concentrations. The first component contained a number of peaks associated with lipids (Fig. 4d). The second component contained similar peaks to the first component, but with a proportion of peaks also associated with proteins, such as at 1455 cm−1 and ∼2940 cm−1 (Fig. 4e). The centre of the Camembert cheese also had several peaks identified only in the centre portion and not on the surface of the cheese. These include the peak at 2857 cm−1 associated with lipids and proteins, the lipid only peak at 1750 cm−1, two peaks associated with proteins attributed to the amino acid tryptophan at 1010 cm−1 and 879 cm−1 [30] and the peak at 1161 cm−1 attributed to lactose and monosaccharides [27].
The centre of Camembert cheese also displays a characteristic microstructure that is porous and includes large fat globules within a heterogeneous protein network [5]. It is known that ammonia and sulphur compounds are released with the growth of these fungal species, however Raman studies of ammonia and water mixtures have found limited bands without overlap with other compounds, which is also an issue here [3]. The quantification of microbial growth in cheese remains limited to bulk values, as there is no technique as yet able to quantify each species individually [3,23].
It is well known that microorganisms such as the P. camemberti and G. candidum present here require phosphorus to grow. In cheese systems such as Camembert, the calcium and phosphorus migrate to the surface of the cheese as a function of ripening [11]. As such, it would be expected to observe some absorbance bands related to phosphorus on the cheese surface that are not present in the centre of the cheese. The peak at 754 cm−1 observed on the surface of Camembert cheese here (Fig. 4g) may be tentatively assigned to phosphorus related bonds, as other studies have shown oxygen-phosphorus and other phosphorus bonds have a strong absorbance at that range [16].
PCA highlighted differences between the averaged component spectra of Camembert centre and surface samples within the range 3600–400 cm−1 (Fig. 5). The different cheese sections were clearly separated in PC1, which accounted for 97% of the variation between points (Fig. 5a). PC1 also described the variation between the average component spectra of the centre portions of Camembert cheese. Separation in PC1 was associated with absorbance peaks relating to lipids and proteins at 2857 cm−1, 1657 cm−1, 1525 cm−1 and 1446 cm−1, as well as lipids only at 1306 cm−1 and lactose or other monosaccharides at 1163 cm−1 (Fig. 5b).
Fig. 5.
PCA scores (a) and loadings plots (b) for spectra in the collected region 3600–400 cm−1 for Camembert cheese surface (two replicate samples shown in red and orange) and centre (two replicate samples shown in dark blue and light blue) sections. Two spectra were used to represent each sample based on the True Component Analysis. The colour version is available online.
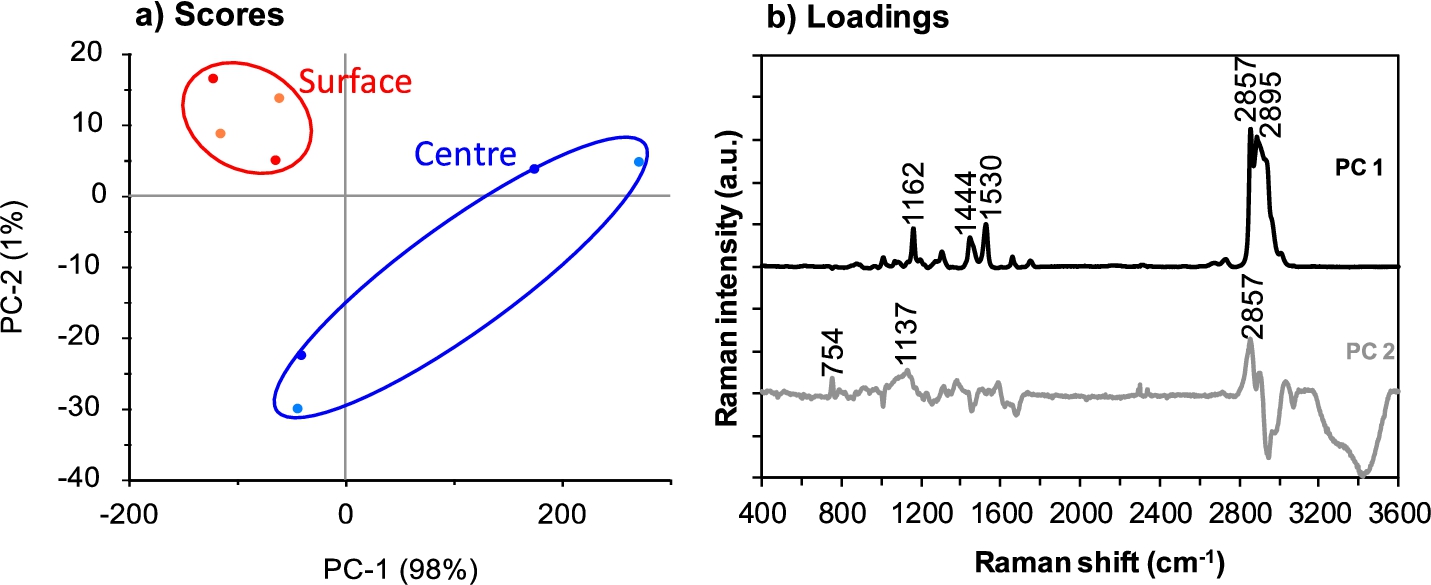
The surface and centre sections of Camembert cheese were also separated in PC2, which described 2% of the variation. The spread between data points of both sample sections was also accounted for in PC2. Variation in PC2 was mostly due to the peak at 2857 cm−1 associated with lipids and proteins.
These results highlight the potential of the technique to differentiate between different sections of the sample that may be used to develop a tool to monitor and predict ripening stages. Prior studies have also demonstrated other spectroscopic methods to validate mould-ripened cheese ripening [27]. The advantage of the techniques described here are that the spatial distribution of components is also possible at a resolution where individual features may be visualised. The structural alterations that were observed between cheese sections may also be used to develop structure-function relationships.
3.3.Raman microscopy of Cheddar cheese
Confocal Raman microscopy was successfully applied to observe the chemical microstructure of Cheddar cheese, a harder and lower moisture cheese than Camembert. Absorbance peaks were identified that are associated with lipids and proteins at 2856 cm−1, 1659 cm−1, 1445 cm−1, lipids only at 1748 cm−1, carotenoids at 1525 cm−1, lactose and monosaccharides at 1161 cm−1 and the pyranose ring of carbohydrates at 478 cm−1 [27,30,38].
Employing True Component Analysis software (WITec) indicated that the cheese sample could be explained by three components (Fig. 6). The first component tended to describe mostly lipids with a little influence from the proteins in the sample (Fig. 6a). The second component explained moisture and protein in the sample whilst the third component tended to cover lipid-related absorbance in the sample (Fig. 6b–c). All components contained peaks associated with lipids, proteins and carbohydrates due to the both the small size of structural features and the sampling depth of the method.
Fig. 6.
Confocal Raman images showing the distribution of three components for mature Cheddar cheese (a–c). Light areas indicate high component intensity and dark areas indicate low component intensity. The combined overlay image is also shown (d). The average spectra for each of the identified components is shown in (e). The scale bars are 5 μm in length in all images. Each set of images is representative of two collected datasets. The colour version is available online.
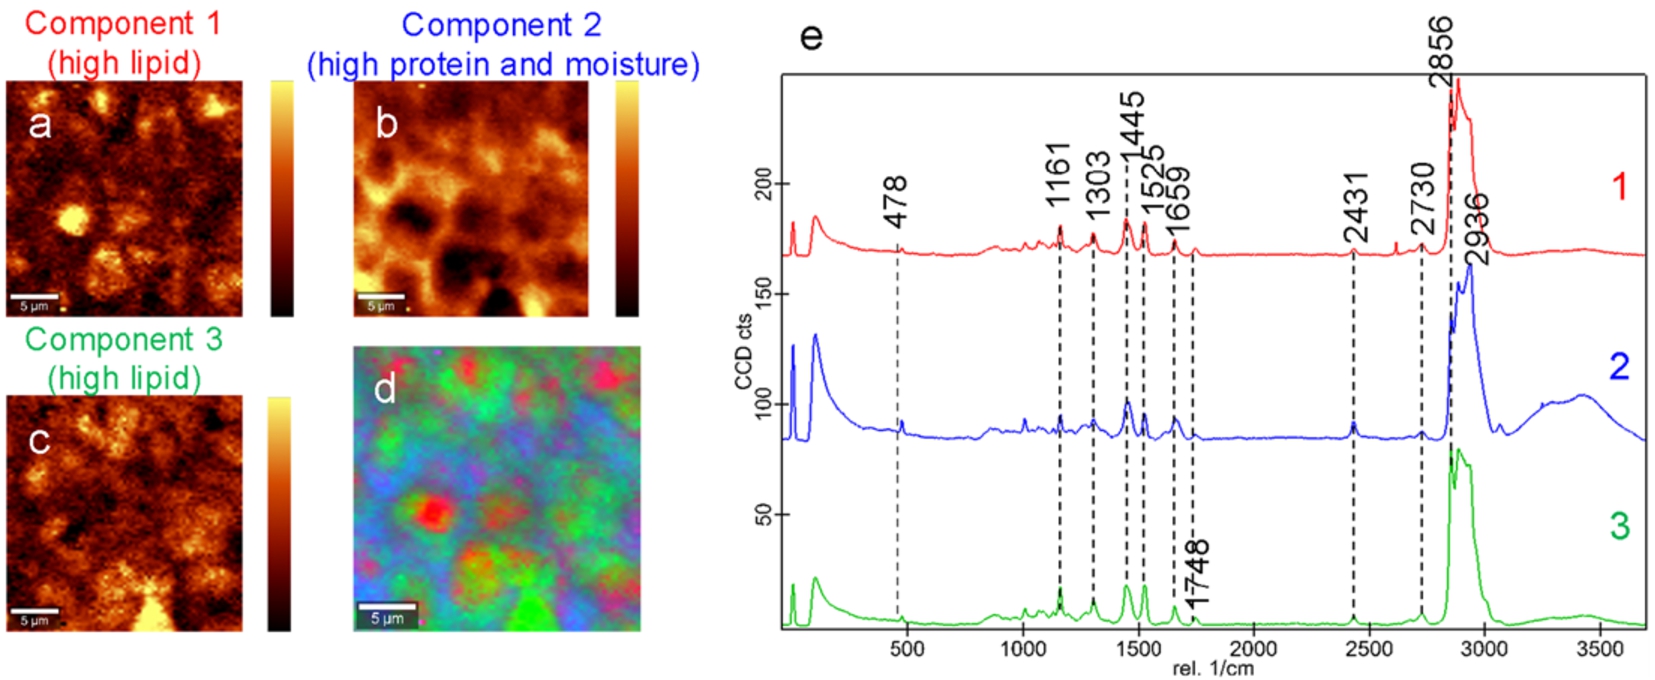
In comparison to the yoghurt and camembert cheese discussed in Sections 3.1 and 3.2, the Cheddar cheese had a distinctly smaller water related band, consistent with the lower water content of this cheese (Fig. 6e).
Molecular information of proteins and lipids that form the Cheddar cheese microstructure is not possible through techniques such as SEM or CLSM. Prior studies have highlighted the potential of spectroscopic techniques as a quality tool to assess cheese ripening, texture and sensory properties [9,13,20]. The Raman technique employed here offers the advantage of minimal sample preparation and imaging time. Detailed information on the product microstructure is also possible with confocal Raman microscopy at a resolution where individual features such as fat globules may be observed.
4.Conclusions
Confocal Raman microscopy was applied to identify the protein, lipid and carbohydrate structures and their spatial distribution in a number of fermented dairy products. As expected, lipid related absorbance dominated spectral features across all samples, however components of high protein or high moisture were also able to be identified. Peaks associated with carbohydrates such as lactose were also clearly identified in yoghurt samples, suggesting future potential of the technique to map carbohydrate based ingredients. The spatial resolution allowed the identification of small features in yoghurt and Cheddar cheese samples, such as individual fat globules, and clearly revealed the structural heterogeneity that occurs between the centre and surface of mould-ripened cheese such as Camembert. Examining the surface of Camembert cheese with its high mould concentration has revealed some spectral features that may be associated with microbial growth. Future refinement of the technique may enable identification of growth markers or metabolites for microbes. The diverse products surveyed here highlight the applicability of confocal Raman microscopy to fermented dairy structure analysis. The current method may be applied as a tool to assist with correlating product structure and function in dairy and other food products.
Acknowledgements
This project has received funding from the European Union’s Horizon 2020 research and innovation programme under the Marie Skłodowska-Curie grant agreement No [713654].
Conflict of interest
The authors have no conflict of interest to report.
References
[1] | J.M. Aguilera and D.W. Stanley, Microstructural aspects of a fluid food: Milk, in: Microstructural Principles of Food Processing and Engineering, 2nd edn, Aspen Publishers, Gaithersburg, MD, (1999) . |
[2] | R. Alves da Rocha, I.M. Paiva, V. Anjos, M.A.M. Furtado and M.J.V. Bell, Quantification of whey in fluid milk using confocal Raman microscopy and artificial neural network, J. Dairy Sci. 98: ((2015) ), 3559–3567. doi:10.3168/jds.2014-8548. |
[3] | A. Amrane and Y. Prigent, Growth of Geotrichum candidum and Penicillium camemberti cultivated on liquid media correlated with ammonia and methanethiol emission, Acta Biotechnol. 21: ((2001) ), 283–290. doi:10.1002/1521-3846(200108)21:3<283::AID-ABIO283>3.0.CO;2-8. |
[4] | D. Arltoft, F. Madsen and R. Ipsen, Relating the microstructure of pectin and carrageenan in dairy desserts to rheological and sensory characteristics, Food Hydrocoll. 22: ((2008) ), 660–673. doi:10.1016/j.foodhyd.2007.01.025. |
[5] | W. Błaszczak and J. Fornal, Lipids in food structure, in: Chemical, Biological, and Functional Aspects of Food Lipids, Z.E. Sikorski and A. Kolakowska, eds, 2nd edn, CRC Press, New York, (2011) . |
[6] | I.H. Boyaci, H.T. Temiz, H.E. Geniş, E. Acar Soykut, N.N. Yazgan, B. Güven, R.S. Uysal, A.G. Bozkurt, K. İlaslan, O. Torun and F.C. Dudak Şeker, Dispersive and FT-Raman spectroscopic methods in food analysis, RSC Adv. 5: ((2015) ), 56606–56624. doi:10.1039/C4RA12463D. |
[7] | J.E. Button and R.J. Dutton, Cheese microbes, Curr. Biol. 22: ((2012) ), R587–R589. doi:10.1016/j.cub.2012.06.014. |
[8] | E. Çakir, S.A. Khan and E.A. Foegeding, The effect of pH on gel structures produced using protein-polysaccharide phase separation and network inversion, Int. Dairy J. 27: ((2012) ), 99–102. doi:10.1016/j.idairyj.2012.03.013. |
[9] | M. Chen, J. Irudayaraj and D.J. McMahon, Examination of full fat and reduced fat Cheddar cheese during ripening by Fourier transform infrared spectroscopy, J. Dairy Sci. 81: ((1998) ), 2791–2797. doi:10.3168/jds.S0022-0302(98)75837-0. |
[10] | M. Corredig, N. Sharafbafi and E. Kristo, Polysaccharide-protein interactions in dairy matrices, control and design of structures, Food Hydrocoll. 25: ((2011) ), 1833–1841. doi:10.1016/j.foodhyd.2011.05.014. |
[11] | E. Engel, C. Tournier, C. Salles and J.L. Le Quéré, Evolution of the composition of a selected bitter Camembert cheese during ripening: Release and migration of taste-active compounds, J. Agric. Food Chem. 49: ((2001) ), 2940–2947. doi:10.1021/jf000966u. |
[12] | FAO, Dairy market review, March, 2019, Rome, 2019. |
[13] | J. Fontecha, J. Bellanato and M. Juarez, Infrared and Raman spectroscopic study of casein in cheese: Effect of freezing and frozen storage, J. Dairy Sci. 76: ((1993) ), 3303–3309. doi:10.3168/jds.S0022-0302(93)77667-5. |
[14] | S. Gallier, K.C. Gordon, R. Jimenez-Flores and D.W. Everett, Composition of bovine milk fat globules by confocal Raman microscopy, Int. Dairy J. 21: ((2011) ), 402–412. doi:10.1016/j.idairyj.2011.01.008. |
[15] | M.J. Genge, A.P. Jones and G.D. Price, An infrared and Raman study of carbonate glasses: Implications for the structure of carbonatite magmas, Geochim. Cosmochim. Acta. 59: ((1995) ), 927–937. doi:10.1016/0016-7037(95)00010-0. |
[16] | Y. Guan, C.J. Wurrey and G.J. Thomas, Vibrational analysis of nucleic acids. I. The phosphodiester group in dimethyl phosphate model compounds: (CH3O)2PO2−, (CD3O)2PO2−, and (13CH3O)2PO2−, Biophys. J. 66: ((1994) ), 225–235. doi:10.1016/S0006-3495(94)80767-2. |
[17] | D. Guggisberg, J. Cuthbert-Steven, P. Piccinali, U. Bütikofer and P. Eberhard, Rheological, microstructural and sensory characterization of low-fat and whole milk set yoghurt as influenced by inulin addition, Int. Dairy J. 19: ((2009) ), 107–115. doi:10.1016/j.idairyj.2008.07.009. |
[18] | C.D. Hickey, B.W.K. Diehl, M. Nuzzo, A. Millqvist-Feurby, M.G. Wilkinson and J.J. Sheehan, Influence of buttermilk powder or buttermilk addition on phospholipid content, chemical and bio-chemical composition and bacterial viability in Cheddar style-cheese, Food Res. Int. 102: ((2017) ), 748–758. doi:10.1016/j.foodres.2017.09.067. |
[19] | D. Huc, C. Michon, C. Bedoussac and V. Bosc, Design of a multi-scale texture study of yoghurts using rheology, and tribology mimicking the eating process and microstructure characterisation, Int. Dairy J. 61: ((2016) ), 126–134. doi:10.1016/j.idairyj.2016.05.003. |
[20] | H. Kraggerud, T. Næs and R.K. Abrahamsen, Prediction of sensory quality of cheese during ripening from chemical and spectroscopy measurements, Int. Dairy J. 34: ((2014) ), 6–18. doi:10.1016/j.idairyj.2013.07.008. |
[21] | A. Lambert, F. Bougrioua, O. Abbas, M. Courty, M. El Marssi, V. Faivre and S. Bresson, Temperature dependent Raman and X-ray diffraction studies of anhydrous milk fat, Food Chem. 267: ((2018) ), 187–195. doi:10.1016/j.foodchem.2017.09.006. |
[22] | M.N. Leclercq-Perlat, F. Buono, D. Lambert, E. Latrille, H.E. Spinnler and G. Corrieu, Controlled production of Camembert-type cheeses. Part I: Microbiological and physicochemical evolutions, J. Dairy Res. 71: ((2004) ), 346–354. doi:10.1017/S0022029904000196. |
[23] | M.H. Lessard, G. Bélanger, D. St-Gelais and S. Labrie, The composition of Camembert cheese-ripening cultures modulates both mycelial growth and appearance, Appl. Environ. Microbiol. 78: ((2012) ), 1813–1819. doi:10.1128/AEM.06645-11. |
[24] | E.C.Y. Li-Chan, Vibrational spectroscopy applied to the study of milk proteins, Dairy Sci. Technol. 87: ((2007) ), 443–458. doi:10.1051/lait:2007023. |
[25] | M. Lisicki and G. Nägele, Colloidal hydrodynamics and interfacial effects, in: Soft Matter at Aqueous Interfaces, P.R. Lang and Y. Liu, eds, Lect. Notes Phys., Vol. 917: , Springer International Publishing, Cham, (2016) , p. 313–386. doi:10.1007/978-3-319-24502-7_10. |
[26] | S.N. Marcellino and D.R. Benson, Scanning electron and light microscopic study of microbial succession on Bethlehem St. Nectaire cheese, Appl. Environ. Microbiol. 58: ((1992) ), 3448–3454. doi:10.1128/AEM.58.11.3448-3454.1992. |
[27] | S.T. Martín-del-Campo, D. Picque, R. Cosío-Ramírez and G. Corrieu, Middle infrared spectroscopy characterization of ripening stages of Camembert-type cheeses, Int. Dairy J. 17: ((2007) ), 835–845. doi:10.1016/j.idairyj.2006.10.003. |
[28] | M. Mauricio-Iglesias, V. Guillard, N. Gontard and S. Peyron, Application of FTIR and Raman microspectroscopy to the study of food/packaging interactions, Food Addit. Contam. 26: ((2009) ), 1515–1523. doi:10.1080/02652030903148306. |
[29] | S. Mazurek, R. Szostak and A. Kita, Application of infrared reflection and Raman spectroscopy for quantitative determination of fat in potato chips, J. Mol. Struct. 1126: ((2016) ), 213–218. doi:10.1016/j.molstruc.2016.01.064. |
[30] | Z. Movasaghi, S. Rehman and I.U. Rehman, Raman spectroscopy of biological tissues, Appl. Spectrosc. Rev. 42: ((2007) ), 493–541. doi:10.1080/05704920701551530. |
[31] | A. Nedeljkovic, I. Tomasevic, J. Miocinovic and P. Pudja, Feasibility of discrimination of dairy creams and cream-like analogues using Raman spectroscopy and chemometric analysis, Food Chem. 232: ((2017) ), 487–492. doi:10.1016/j.foodchem.2017.03.165. |
[32] | S.B.X. Ng, P.T.M. Nguyen, B. Bhandari and S. Prakash, Influence of different functional ingredients on physical properties, rheology, tribology, and oral perceptions of no fat stirred yoghurt, J. Texture Stud. 49: ((2018) ), 274–285. doi:10.1111/jtxs.12307. |
[33] | H.T.H. Nguyen, S. Afsar and L. Day, Differences in the microstructure and rheological properties of low-fat yoghurts from goat, sheep and cow milk, Food Res. Int. 108: ((2018) ), 423–429. doi:10.1016/j.foodres.2018.03.040. |
[34] | M.K. Nieuwoudt, S.E. Holroyd, C.M. McGoverin, M.C. Simpson and D.E. Williams, Raman spectroscopy as an effective screening method for detecting adulteration of milk with small nitrogen-rich molecules and sucrose, J. Dairy Sci. 99: ((2016) ), 2520–2536. doi:10.3168/jds.2015-10342. |
[35] | S. Okazaki, M. Hiramatsu, K. Gonmori, O. Suzuki and A.T. Tu, Rapid nondestructive screening for melamine in dried milk by Raman spectroscopy, Forensic Toxicol. 27: ((2009) ), 94–97. doi:10.1007/s11419-009-0072-3. |
[36] | K.de S. Oliveira, L.de S. Callegaro, R. Stephani, M.R. Almeida and L.F.C. de Oliveira, Analysis of spreadable cheese by Raman spectroscopy and chemometric tools, Food Chem. 194: ((2016) ), 441–446. doi:10.1016/j.foodchem.2015.08.039. |
[37] | L. Ong, R.R. Dagastine, S.E. Kentish and S.L. Gras, Microstructure of milk gel and cheese curd observed using cryo scanning electron microscopy and confocal microscopy, LWT – Food Sci. Technol. 44: ((2011) ), 1291–1302. doi:10.1016/j.lwt.2010.12.026. |
[38] | G.P.S. Smith, S.E. Holroyd, D.C.W. Reid and K.C. Gordon, Raman imaging processed cheese and its components, J. Raman Spectrosc. 48: ((2017) ), 374–383. doi:10.1002/jrs.5054. |
[39] | X. Wang, C. Esquerre, G. Downey, L. Henihan, D. O’Callaghan and C. O’Donnell, Assessment of infant formula quality and composition using vis-NIR, MIR and Raman process analytical technologies, Talanta 183: ((2018) ), 320–328. doi:10.1016/j.talanta.2018.02.080. |
[40] | M.S.M. Wee, R. Yusoff, L. Lin and Y.Y. Xu, Effect of polysaccharide concentration and charge density on acid-induced soy protein isolate-polysaccharide gels using HCl, Food Struct. 13: ((2017) ), 45–55. doi:10.1016/j.foostr.2016.08.001. |
[41] | N. Yang, R. Lv, J. Jia, K. Nishinari and Y. Fang, Application of microrheology in food science, Annu. Rev. Food Sci. Technol. 8: ((2017) ), 493–521. doi:10.1146/annurev-food-030216-025859. |
[42] | M. Zhao, Y. Nian, P. Allen, G. Downey, J.P. Kerry and C.P. O’Donnell, Application of Raman spectroscopy and chemometric techniques to assess sensory characteristics of young dairy bull beef, Food Res. Int. 107: ((2018) ), 27–40. doi:10.1016/j.foodres.2018.02.007. |

