
Application of tunable quantum cascade lasers to monitor dynamics of bacteriorhodopsin in the mid-IR spectral range
Abstract
The function of membrane proteins is highly impacted by their membrane environment. One suitable approach to get insights into the interaction-induced dynamics of membrane proteins and lipid membranes is time-resolved infrared (IR) spectroscopy. Conclusions about environmental influences to the system can be drawn by correlating the observed kinetics to the well-characterized photocycles of light-driven transmembrane proton pumps like bacteriorhodopsin (BR). For the investigation of photoreceptor-membrane interactions, also minor changes in the absorption spectra must be resolved. Therefore, we applied IR laser spectroscopy using tunable quantum cascade lasers (QCLs) as IR light source. Several QCLs were implemented in a home-built spectrometer and provide a tunability in a broad spectral region covering protein, chromophore and lipid vibrational modes. Kinetics of the BR photocycle were monitored at single wavenumbers. This study demonstrates the high potential of QCL-based spectroscopy for the application to membrane protein studies.
Abbreviations
BR: | bacteriorhodopsin |
FTIR: | Fourier-transform infrared |
QCL: | quantum cascade laser |
1.Background
The light driven proton pump BR became one of the most investigated membrane proteins [3,5,14] since its discovery more than four decades ago [15]. BR consists of 7 transmembrane α-helices and the retinal chromophore linked by a protonated Schiff base to a lysine residue. After light excitation, a photocycle is initiated and BR passes through different intermediate steps. K, L, M, N, and O are photocycle intermediates [6,14] and describe the state of the protein and the chromphore, including individual steps of the proton translocation. Variations from this well characterized BR photocycle facilitate a deeper understanding of the interaction with specific membrane environments. BR was reconstituted into artificial membranes composed by lipids with specific physico-chemical properties and step-scan Fourier-transform infrared (FTIR) spectroscopy was applied. First insights were obtained to dissect the effect of the membrane composition on the proton transfer and conformational dynamics of membrane photoreceptors [9,10].
For further investigations of the interaction-induced dynamics of membrane proteins and lipid membranes, it is highly desirable that also minor changes in absorption are resolved. Since their introduction [2], the development of QCL proceeds and has become a suitable tool in various scientific branches [4,18,21]. The application in mid-IR spectroscopy succeeded with the opportunity of gapless tuning over broad spectral regions. This enables single wavenumber measurements at precisely selected IR bands or even scanning whole spectra. In comparison to thermal IR sources used in FTIR setups, QCLs offer a higher signal-to-noise ratio [1]. To observe membrane and protein dynamics [9,10], QCLs with appropriate spectral specifications are required. Application of a QCL setup for time-resolved spectroscopy of BR dynamics in the spectral region between ∼1700–1800 cm−1 has been reported before [17]. Here, we present an extension of our home-built spectrometer with multiple implemented QCLs providing a nearly gapless tunability in a broad spectral region from ∼1150–2250 cm−1. Successful application is shown by time-resolved measurements of BR at various single wavenumbers representing proton transfer as well as protein conformational dynamics.
2.Objective
Aim of this study is the implementation of multiple QCLs into a home-built IR spectrometer for time-resolved protein dynamics measurements at single wavenumbers using the photoreaction of BR as an example.
3.Methods
The isolation of purple membrane from Halobacterium salinarium was performed following to D. Oesterhelt and W. Stoeckenius [16]. In the sample preparation for IR measurements, BR in purple membrane was dried as film (∼150 μg) on a calcium fluoride cuvette with 10 μm optical path length. The film was rehydrated (∼1 μl water) and sealed with a calcium fluoride window to prevent dehydration.
Fig. 1.
Home-built QCL-spectrometer containing four different laser heads. The QCL probe beam is power controlled by two polarizers (Pol1/Pol2). For controlling the focus spot size, a beam expander is implemented consisting of a convex (M3) and concave (M4) mirror pair and an iris diaphragm (ID1). Focusing before (OAP1) and collimating behind (OAP2) the sample as well as focusing onto the mercury cadmium telluride (MCT) detector (OAP3) are accomplished with off-axis parabolic mirrors. In front of the detector there is a long pass filter for the mid-IR (LPmir) and a band pass filter (BPQCL) that is adapted to the respective wavenumber. The whole setup is constantly flushed with dry air for humidity control. The second harmonic Nd:YAG pump beam is widened by a convex (Lconvex)–concave (Lconcave) lens pair and homogenized with an iris diaphragm (ID2). After excitation of the sample, the pump beam is blocked by a beam dump (BD). Deflected is the pump beam by silver coated mirrors (M9/M10), the QCL pathway by gold coating based mirrors (M1–M8).
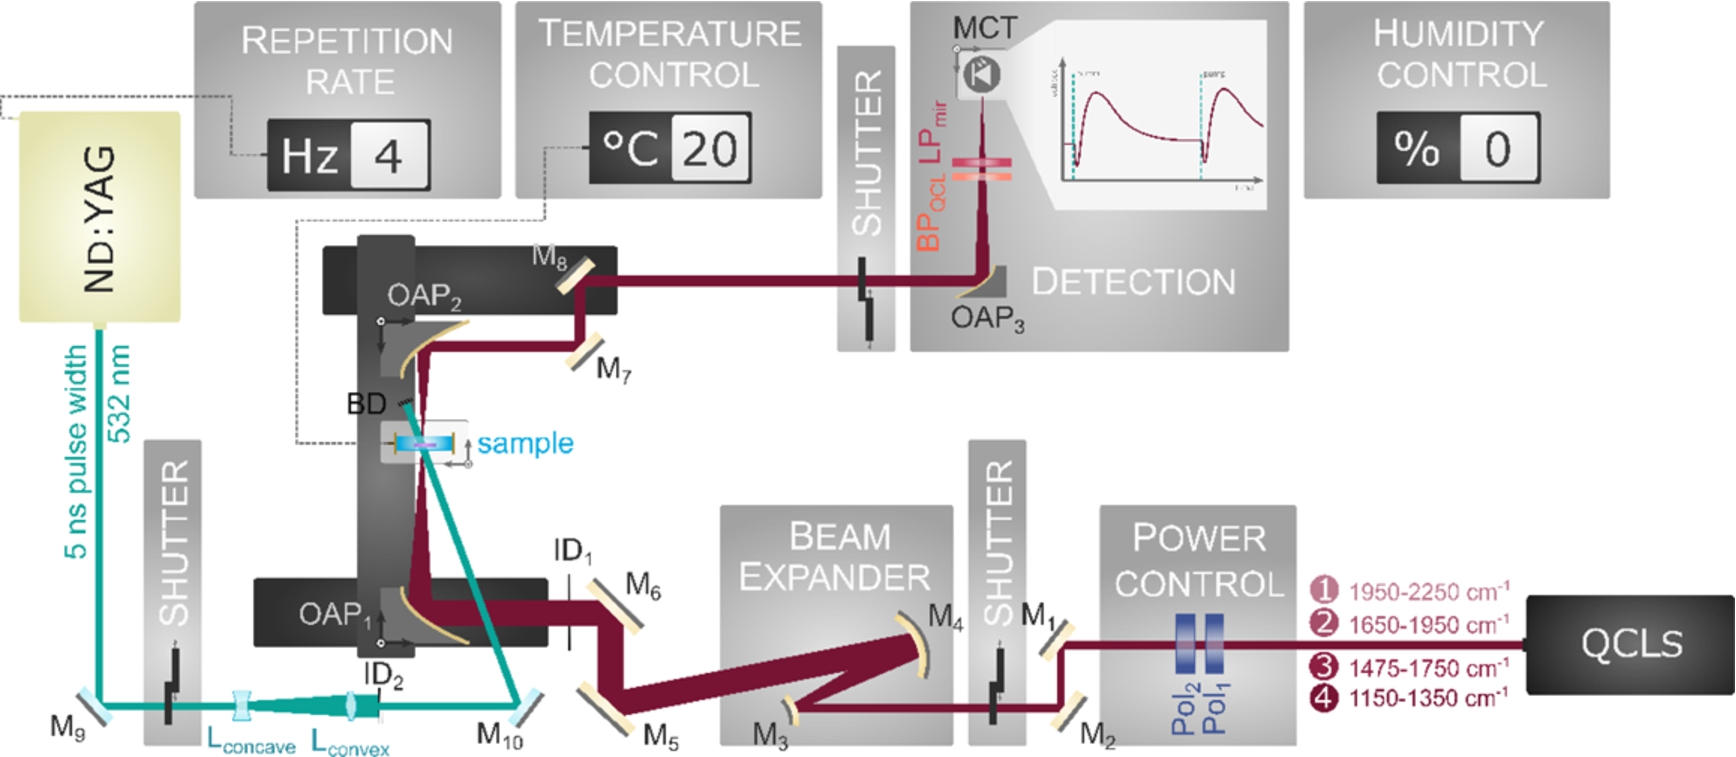
The home-built QCL spectrometer setup is shown in Fig. 1. The laser source consists of four laser heads (QCL 1–4) allowing gapless tuning between 1475 cm−1 and 2250 cm−1 (QCL 1: 1950 cm−1 to 2250 cm−1; QCL 2: 1650 cm−1 to 1950 cm−1; QCL 3: 1475 cm−1 to 1750 cm−1) and, with a small gap, also from 1150 cm−1 to 1350 cm−1 (QCL 4). The beam power on the sample and at the detector is controlled by polarizers. The beam expander is built out of a convex-concave mirror pair [7], and the iris diaphragm defines the focused spot size at the sample. In front of the sample the probe beam is focused (f = 190.5 mm), and it is collimated (f = 101.6 mm) after the sample with off axis parabolic mirrors (OAP). An OAP of 76.2 mm focal length is used to focus the beam onto the mercury cadmium telluride (MCT) detector (Kolmar Technologies, Inc.). For reduction of interfering signals a long pass filter (cut-on wavelength = 3 μm) and a band pass filter corresponding to the probe wavenumber is installed in front of the detector. The sample is temperature controlled at 20°C and the laser setup is constantly flushed by dried air.
The photoexcitation was initiated by 5 ns laser pulses of the second harmonic (532 nm) of a Q-switched Nd:YAG laser (Minilite, Continuum Electro-Optics, Inc.). For a spatially more homogeneous excitation of the probed area, the pump beam is widened by a pair of concave (f = −50 mm) and convex (f = 200 mm) lenses and trimmed with an iris diaphragm. The excitation energy density is 2 mJ cm−1.
The data were recorded with a 16 bit transient recorder board (M3i.4841, Spectrum Instrumentation) in the range of ±200 mV by 105 MS s−1 in AC-mode. 2000 transients were averaged. A reference signal measured without the pump beam was subtracted in the analysis. Subsequently the absorbance difference was calculated by
4.Results and discussion
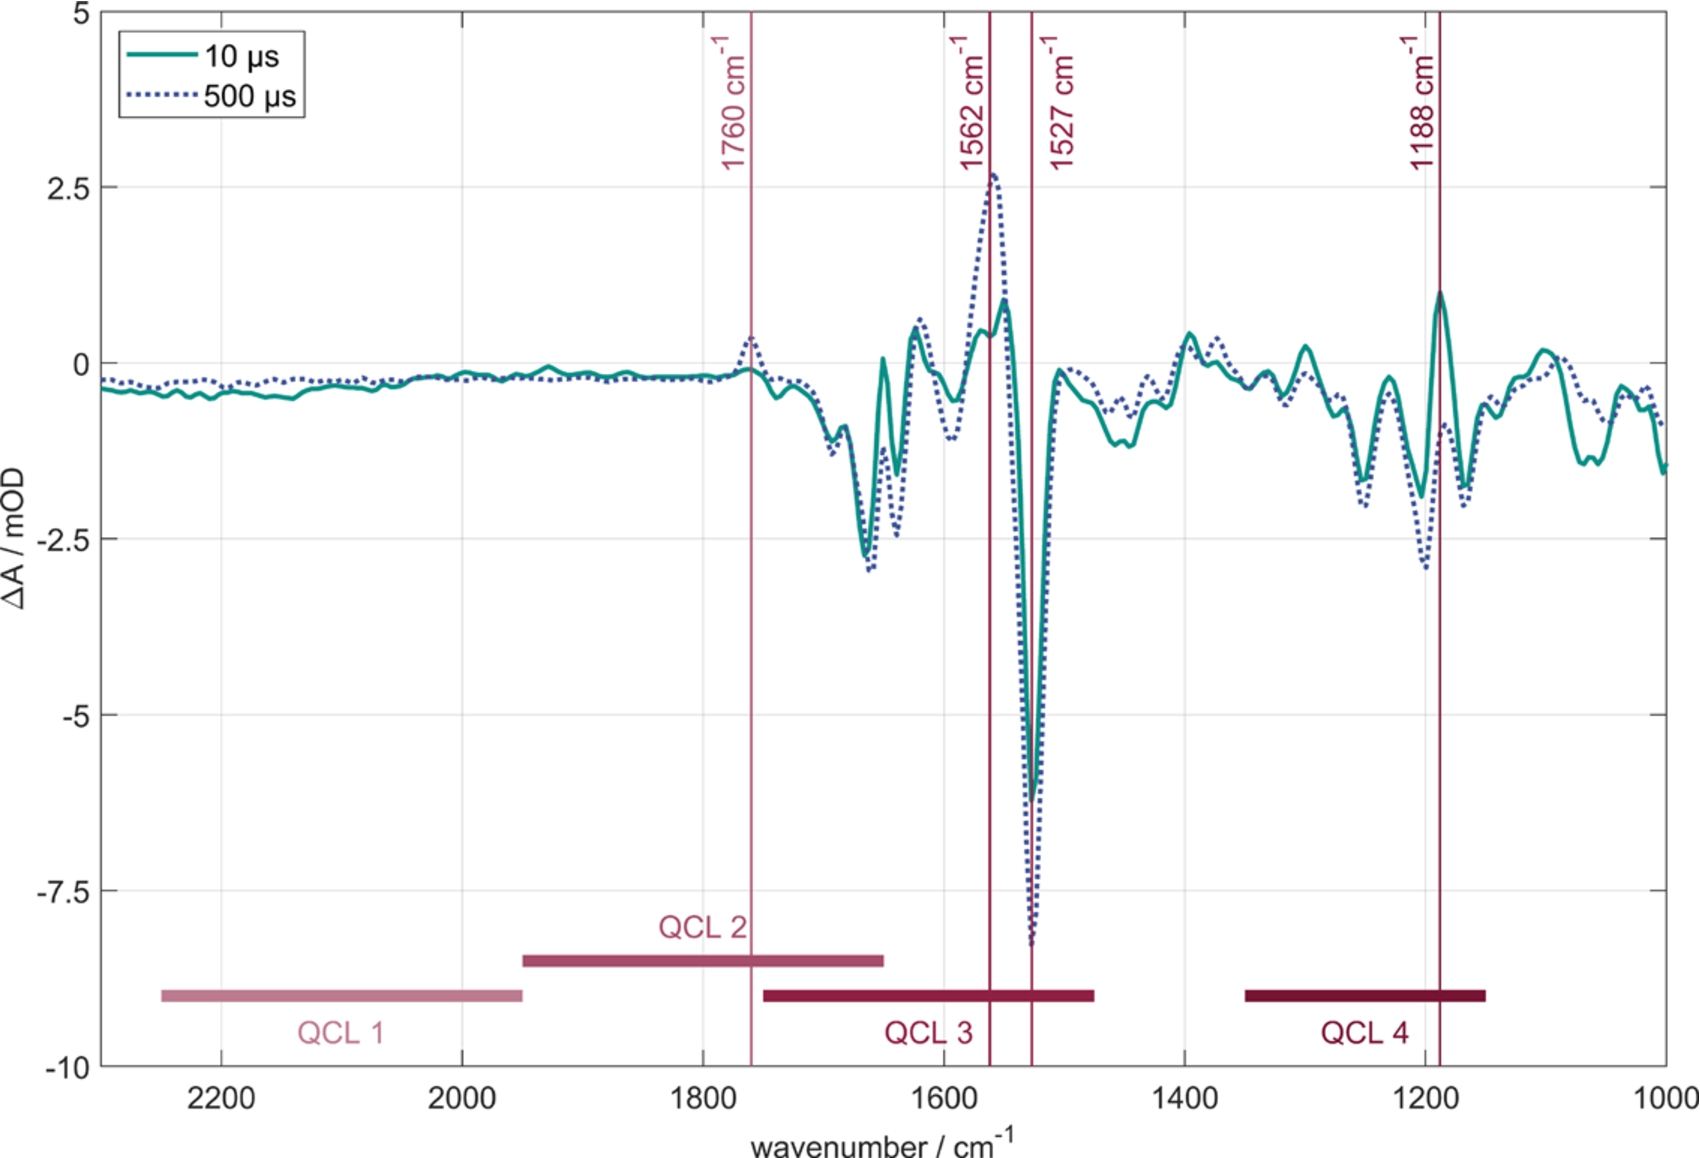
Two step-scan FTIR spectra of BR in two different states after photoexcitation are shown in Fig. 2, 10 μs (grey line) and 500 μs (dashed line). The spectra reveal the protein dynamics of the photoreaction, including conformational changes of the protein, differences in the isomerization state of the chromophore as well as protonation and deprotonation processes occurring inside the protein during the proton transfer reaction across the membrane. Amide I conformational changes of the protein are monitored between 1600 cm−1 and 1700 cm−1, the amide II conformational changes in the area of 1500 cm−1 and 1600 cm−1. The C–C single bond stretching of the retinal occurs between 1150 cm−1 and 1280 cm−1. Depending on the state of the photocycle, the stretching vibration of the retinal C=C double bonds is observed to shift between ∼1500 cm−1 and 1560 cm−1 [6]. Between 1700 cm−1 and 1800 cm−1 the protonation of carboxylic amino acid side chains can be monitored. In the lower part of Fig. 2, the regions of spectral tunability of the four QCL heads are displayed.
Fig. 2.
Time-resolved FTIR difference spectra of BR in purple membrane at 10 μs (grey line) and 500 μs (dashed line) after photoexcitation. Marked by vertical lines are the four probe wavenumbers for the QCL measurements. Corresponding transients are shown in Fig. 3. The spectral ranges of the four QCL-heads are displayed by horizontal lines.
Four representative probe wavenumbers were selected from the emission spectra of QCL 2–4. Transients of these measurements are shown in Fig. 3. Horizontal lines mark the same states as in Fig. 2, 10 μs (grey line) and 500 μs (dashed line).
Fig. 3.
Transients of absorption changes measured by the home-built QCL-spectrometer. Vertical lines mark 10 μs (grey line) and 500 μs (dashed line) corresponding to Fig. 2. (A) The strong absorbance change at ∼1527 cm−1 is used as an IR marker for BR. (B) The absorbance change at 1562 cm−1 contains several contributions as indicated in the text. (C) The protonation dynamics is monitored at 1760 cm−1 for the primary proton acceptor Asp85 and (D) at 1188 cm−1 for the corresponding deprotonation of the Schiff base.
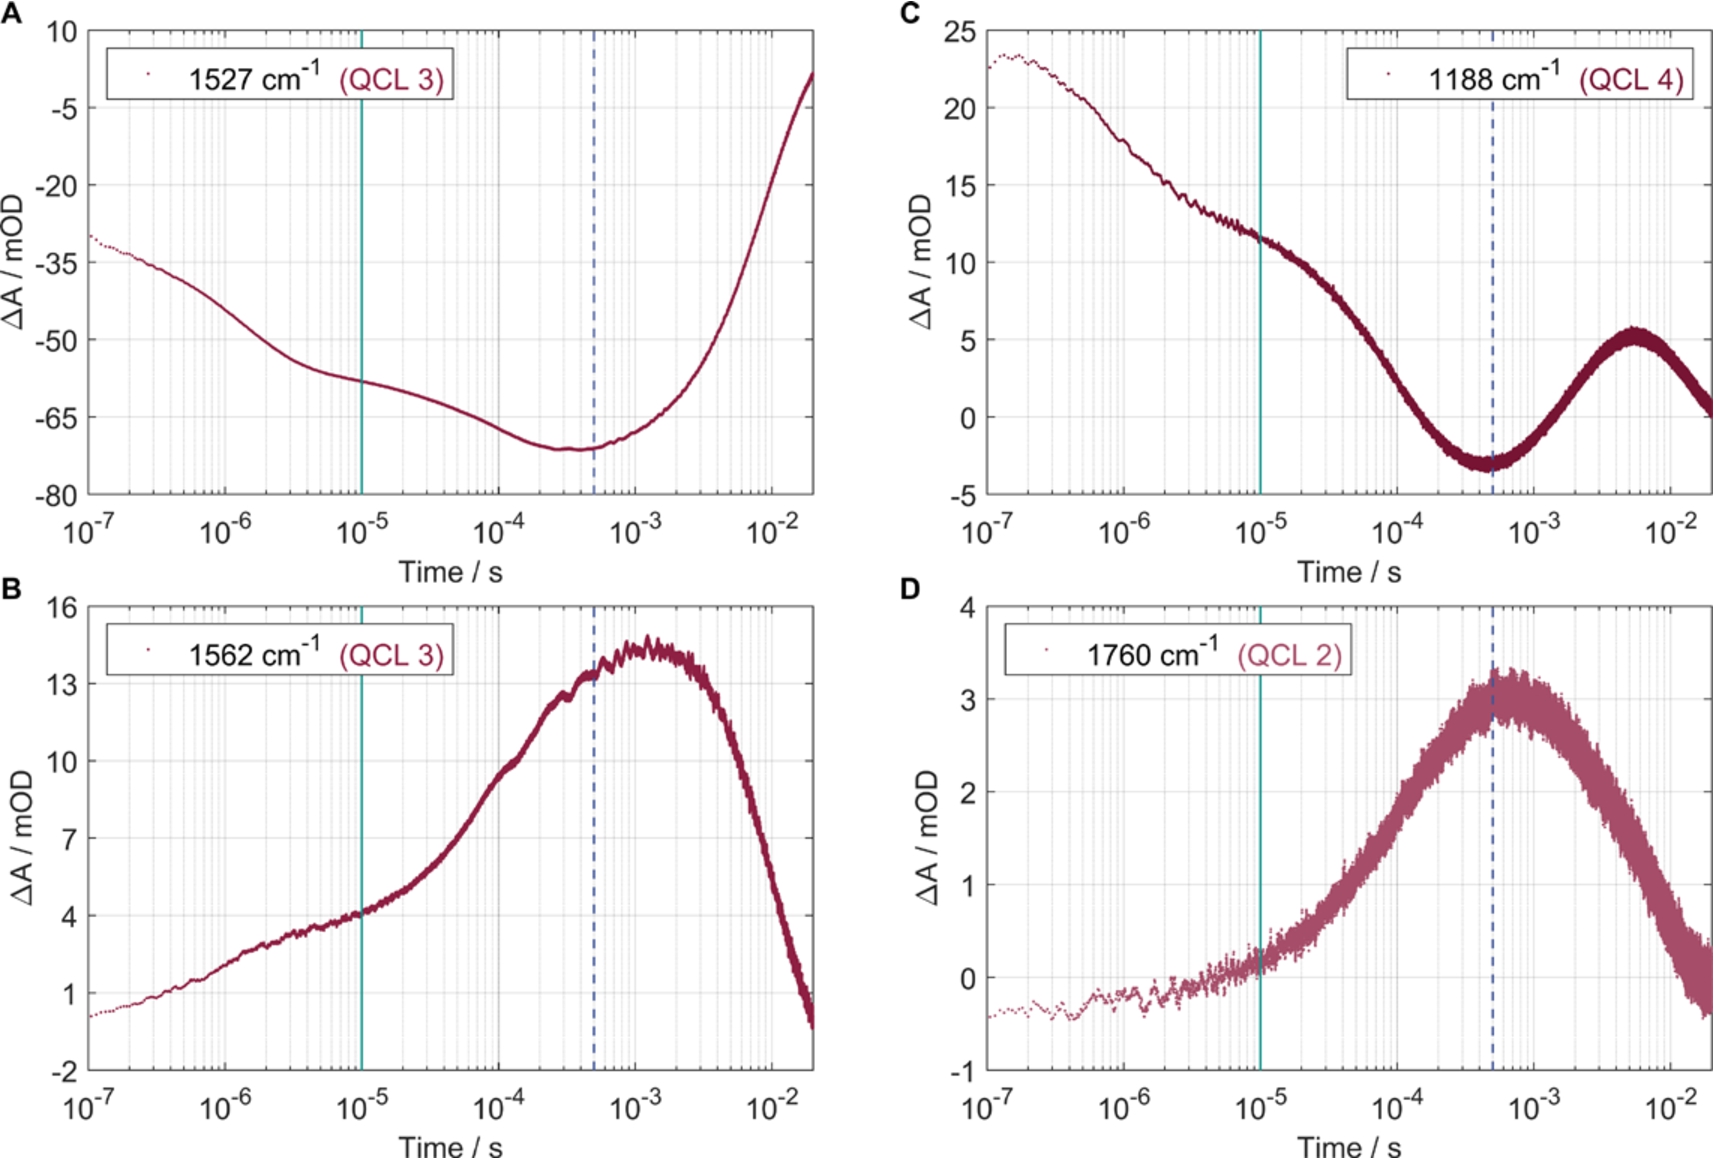
The strong absorbance change at ∼1527 cm−1 (Fig. 2) is caused by the C=C retinal stretching vibrations in the ground state [13]. Due to its signal strength it is often used as an IR marker of BR [8]. This huge change in absorbance after photoexcitation is also reflected in the transient measured with QCL 3, shown in Fig. 3A. The resulting negative band, which reaches its minimum shortly before 500 μs and then approaches zero again, is consistent with other measurements [8,12].
The C=C retinal stretching vibrations in the N intermediate occur at 1553 cm−1 and contribute to the band probed at 1562 cm−1 band together with the amide II conformational changes. The amide II band reaches a maximum in intensity in the N intermediate after ∼2 ms [6,8]. Additionally, it is suggested that the Arg82 protonation plays a critical role in the proton release and is also observed at 1562 cm−1 [5,8,19,20]. Measuring this band by single wavenumber detection, Fig. 3B shows a consistent time trace towards the N intermediate.
The first proton transfer step can be observed at the wavenumber 1188 cm−1 and 1760 cm−1. After the initiation of the proton pump process by light excitation, the proton passes from the Schiff base to Asp85. This process is completed after ∼500 μs (M intermediate) [8]. The deprotonation dynamics of the Schiff base (1188 cm−1) are described by a declining transient during this period. Correspondingly, a rising absorption change indicates the protonation dynamics of the primary proton acceptor Asp85 (1760 cm−1). Figure 3D shows time-resolved QCL measurements of the Asp85 protonation at 1760 cm−1, as was already reported before [17]. Complementarily, we selected the band of the Schiff base deprotonation at 1188 cm−1 (Fig. 3C). Considering both transients in Fig. 3C and 3D, the simultaneous change in absorption up to ∼500 μs (dashed line) is striking. These kinetic traces are also consistent with previous FTIR measurements [10]. In the subsequent period starting at 500 μs, the curve in Fig. 3C first describes the reprotonation of the Schiff base and then converges towards zero due to the photocycle relaxation, in agreement with the literature [12]. During the same interval from 500 μs, the declining curve in Fig. 3D illustrates the deprotonation of Asp85 without further interference.
Comparing the relative signal strength of the absorbance difference between 10 μs and 500 μs, it matches the expected values measured by time-resolved FTIR shown in Fig. 2. The FTIR difference spectra reveal a decrease in intensity of the negative band at 1188 cm−1 and of the positive band at 1527 cm−1 with a similar absorbance change. This similar decrease in intensity between 10 and 500 μs is nicely reproduced in the QCL measurements (Fig. 3A and 3C). The bands at 1562 cm−1 and 1760 cm−1 show an increase in intensity in the FTIR spectra between 10 and 500 μs, with a stronger absorbance change for 1562 cm−1 as for 1730 cm−1. The same behavior was again reproduced in the QCL measurements (Fig. 3B and 3D).
The measurements of the M and N intermediates (Fig. 3B–D) demonstrated the consistency of our data with the literature. Furthermore, the comparison of the simultaneously occuring processes, the deprotonation of the Schiff base (Fig. 3B), and the protonation of the primary proton acceptor Asp85 (Fig. 3D) showed the coherence within the QCL single wavenumber measurements. The observed changes in absorption correspond to those obtained with our step-scan FTIR measurements.
Although the measurements at 1188 cm−1 and 1527 cm−1 are in a spectral region where the lasers provide the lowest power, lack of power at the detector presents no issue. The pointing stability depending on the wavenumber, especially within the individual laser heads, is considerably less than the 2 mrad given in the datasheet and is therefore in a manageable range. Here the signal-to-noise ratio (SNR) is calculated by
Our QCL spectrometer provides acceess to studying protein-membrane interaction. Lipid bands are located in the area of 3000–2800 cm−1, but overlap with a strong water band. By deuterating the lipids, the bands get red-shifted into a spectral silent window between 2250 cm−1 and 1950 cm−1 [11]. This spectral region is covered by an additional QCL (QCL 1) which has already been implemented into the spectrometer. Thus, the home-built spectrometer is suited to analyze both lipid and protein dynamics.
5.Conclusions and outlook
The presented data show the application of a home-built QCL-spectrometer to monitor dynamics of BR with several QCLs tunable in a wide spectral region in the mid-IR. Different transient states of the BR photocycle were consistently resolved with nanosecond time-resolution and high signal-to-noise ratio. For future studies on lipid-induced dynamics, we will use deuterated lipids in biomimetic membranes. The associated bands shift into a spectral silent window accessible by our QCL spectrometer.
Acknowledgements
The authors thank Jessica Dröden for the expression and purification of BR. Financial support by the Deutsche Forschungsgemeinschaft (SFB 969, A2) is gratefully acknowledged.
Conflict of interest
The authors have no conflict of interest to report.
References
[1] | D.T.D. Childs et al., Sensitivity advantage of QCL tunable-laser mid-infrared spectroscopy over FTIR spectroscopy, Applied Spectroscopy Reviews 50: (10) ((2015) ), 822–839. doi:10.1080/05704928.2015.1075208. |
[2] | J. Faist et al., Quantum cascade laser, Science 264: ((1994) ), 553–556. |
[3] | N. Hasegawa et al., X-ray structure analysis of bacteriorhodopsin at 1.3 Å resolution, Sci. Rep. 8: (1) ((2018) ), 13123. doi:10.1038/s41598-018-31370-0. |
[4] | K. Hauser et al., Enhanced sensitivity to local dynamics in peptides by use of temperature-jump IR-spectroscopy and isotope labeling, Chemistry ((2019) ). doi:10.1002/chem.201904497. |
[5] | J. Heberle, Proton transfer reactions across bacteriorhodopsin and along the membrane, Biochimica et Biophysica Acta (BBA) – Bioenergetics 1458: (1) ((2000) ), 135–147. doi:10.1016/S0005-2728(00)00064-5. |
[6] | J. Heberle et al., Bacteriorhodopsin: The functional details of a molecular machine are being resolved, Biophysical Chemistry 85: (2–3) ((2000) ), 229–248. |
[7] | P. Hello and C.N. Man, Design of a low-loss off-axis beam expander, Appl. Opt. 35: ((1996) ), 2534–2536. doi:10.1364/AO.35.002534. |
[8] | R.W. Hendler et al., Infrared and visible absolute and difference spectra of bacteriorhodopsin photocycle intermediates, Appl. Spectrosc. 65: (9) ((2011) ), 1029–1045. doi:10.1366/11-06302. |
[9] | M. Jawurek et al., Impact of the lipid environment on the protonation dynamics of bacteriorhodopsin studied with time-resolved step-scan FTIR spectroscopy, Biomedical Spectroscopy and Imaging 5: (2) ((2016) ), 167–174. doi:10.3233/BSI-160135. |
[10] | M. Jawurek et al., Lipid-induced dynamics of photoreceptors monitored by time-resolved step-scan FTIR spectroscopy, Chemical Physics 512: ((2018) ), 53–61. |
[11] | M. Jawurek, P. Stritt and K. Hauser, Time-resolved infrared spectroscopy to analyze dynamic interactions of photoreceptors with biomimetic membranes, European Biophysics Journal with Biophysics Letters 48: (Suppl. 1) ((2019) ), S241. |
[12] | V.A. Lorenz-Fonfria, H. Kandori and E. Padros, Probing specific molecular processes and intermediates by time-resolved Fourier transform infrared spectroscopy: Application to the bacteriorhodopsin photocycle, J. Phys. Chem. B 115: (24) ((2011) ), 7972–7985. doi:10.1021/jp201739w. |
[13] | A. Maeda, Application of FTIR spectroscopy to the structural study on the function of bacteriorhodopsin, Israel Journal of Chemistry 35: (3–4) ((1995) ), 387–400. |
[14] | G. Nass Kovacs et al., Three-dimensional view of ultrafast dynamics in photoexcited bacteriorhodopsin, Nat. Commun. 10: (1) ((2019) ), 3177. doi:10.1038/s41467-019-10758-0. |
[15] | D. Oesterhelt and W. Stoeckenius, Functions of a new photoreceptor membrane, Proc. Natl. Acad. Sci. USA 70: (10) ((1973) ), 2853–2857. doi:10.1073/pnas.70.10.2853. |
[16] | D. Oesterhelt and W. Stoeckenius, Isolation of the cell membrane of Halobacterium halobium and its fractionation into red and purple membrane, Methods in Enzymology 31: ((1974) ), 667–678. doi:10.1016/0076-6879(74)31072-5. |
[17] | B.J. Schultz et al., Protein dynamics observed by tunable mid-IR quantum cascade lasers across the time range from 10 ns to 1 s, Spectrochim. Acta A Mol. Biomol. Spectrosc. 188: ((2018) ), 666–674. doi:10.1016/j.saa.2017.01.010. |
[18] | M.S. Vitiello et al., Quantum cascade lasers: 20 years of challenges, Opt. Express 23: (4) ((2015) ), 5167–5182. doi:10.1364/OE.23.005167. |
[19] | Y. Xiao et al., Role of arginine-82 in fast proton release during the bacteriorhodopsin photocycle: A time-resolved FT-IR study of purple membranes containing 15N-labeled arginine, Biochemistry 43: ((2004) ), 12809–12818. |
[20] | Y. Xiao and M. Braiman, Modeling amino acid side chains in proteins: 15N NMR spectra of guanidino groups in nonpolar environments, J. Phys. Chem. B 109: (35) ((2005) ), 16953–16958. doi:10.1021/jp051279e. |
[21] | Y. Yao, A.J. Hoffman and C.F. Gmachl, Mid-infrared quantum cascade lasers, Nature Photonics 6: (7) ((2012) ), 432–439. doi:10.1038/nphoton.2012.143. |

