
Looking beyond the mammogram to assess mammographic density: A narrative review
Abstract
MD – the white areas on a mammogram (also known as breast density), has long been recognised as an indicator of breast cancer (BC) risk and mammographic masking. Recent legislation in 32 American states has mandated the inclusion of mammography density information in reports for women in the higher two MD quartiles, and it is a growing consideration world-wide. While the mammogram is currently the only means of estimating MD, it suffers from a number of limitations. These are related to the accumulation of low dose ionising radiation used in mammography that limits its repeated use, particularly in young women, women with previous radiation exposure, those having undergone prior surgery, or those with radio-sensitising gene mutations. This review compares and contrasts the variety of emerging technologies that can provide a quantitative and true volumetric analysis of breast density, without the use of ionising radiation.
Abbreviations
ADC | Apparent diffusion coefficient |
AGD | Average glandular dose |
BC | Breast cancer |
BI-RADs | Breast Imaging-Reporting and Data System |
BMI | Body mass index |
BPE | Background parenchymal enhancement |
DBCT | Dedicated Breast Computed Tomography |
DBT | Digital breast tomosynthesis |
DCE | Dynamic-Contrast Enhanced |
DXA | Dual energy X-ray absorptiometry |
ECM | Extracellular matrix |
FC | Fuzzy clustering |
FGT | Fibroglandular tissue |
HRT | Hormone replacement therapy |
MD | Mammographic Density |
MRE | MRI-based elastography |
MRI | Magnetic Resonance Imaging |
NAC | Neoadjuvant chemotherapy |
NIR | Near infrared |
OPERA | Odds PER Adjusted standard deviation |
PMD | Percent mammographic density |
ULR | Univariate linear regression |
US | Ultrasound |
VGF | Volumetric Glandular Fraction |
WHO | World Health Organisation |
Highlights
Mammographic Density (MD), also known as breast density, is a significant breast cancer risk factor when adjusted for age and body mass index (BMI)
MD reduces the sensitivity of mammography to detect cancer due to masking
MD is ∼60% genomically encoded, and closely linked to oestrogen exposure
Low ionising and non-radiation alternatives vary in their ability to measure MD
% Fibroglandular tissue (FGT) determined by non-contrast magnetic resonance imaging (MRI) associates with MD
1.Introduction
MD, also known as breast density, refers to the degree of radio-opaque appearance of the mammogram, the whiter the mammogram the higher the density [80]. It is an indicator of tissue composition, and has important consequences for BC risk and mammographic efficacy in detecting signs of malignancy. An Australian woman’s lifetime risk of BC is ∼1 in 8 (12.5%) [3], which is comparable to the UK (12.5%) and America (12%) [20,83]. There are ∼500,000 deaths annually from BC worldwide from ∼14 million BCs detected, indicating the severity of BC (World Health Organisation [WHO]; www.who.int/cancer/detection/breastcancer/en/index1.html). Recent studies have shown that MD can also directly impact the progression and dissemination of BC cells [2,25,36,37,91].
Risk factors for BC include increasing age, high post-menopausal BMI, a family history of the disease, menarche at an early age (<11) and high MD [16,27,115]. In terms of predicting which women will develop BC on a population basis, MD adjusted for age and BMI is as strong a risk factor as all the genetic risk factors identified in the last two decades, including mutations in the BRCA1 and BRCA2 genes [53]. An accurate estimation of an individual’s MD is therefore an important determinant of BC risk and prognosis. This review summarises the current understanding of MD and MD-associated BC risk and progression, and evaluates current and emerging alternative technologies to accurately determine MD and analogous – MD measures.
This narrative review used a PubMed search of original and review articles from 1970 to 2017 with the following terms (Title/Abstract search of: mammographic density; MD; mammography ± alternative measure or volumetric or fibroglandular or MRI or BC risk or background parenchymal enhancement [BPE] or estrogen) to formulate an evidence-based overview of current and experimental approaches to determine MD. 143 articles were retrieved and based on analysis of abstracts and text, 128 were used as a basis for this review.
2.Composition of dense breast tissue, it’s association with increased BC risk, and factors influencing amount of dense tissue in the breast
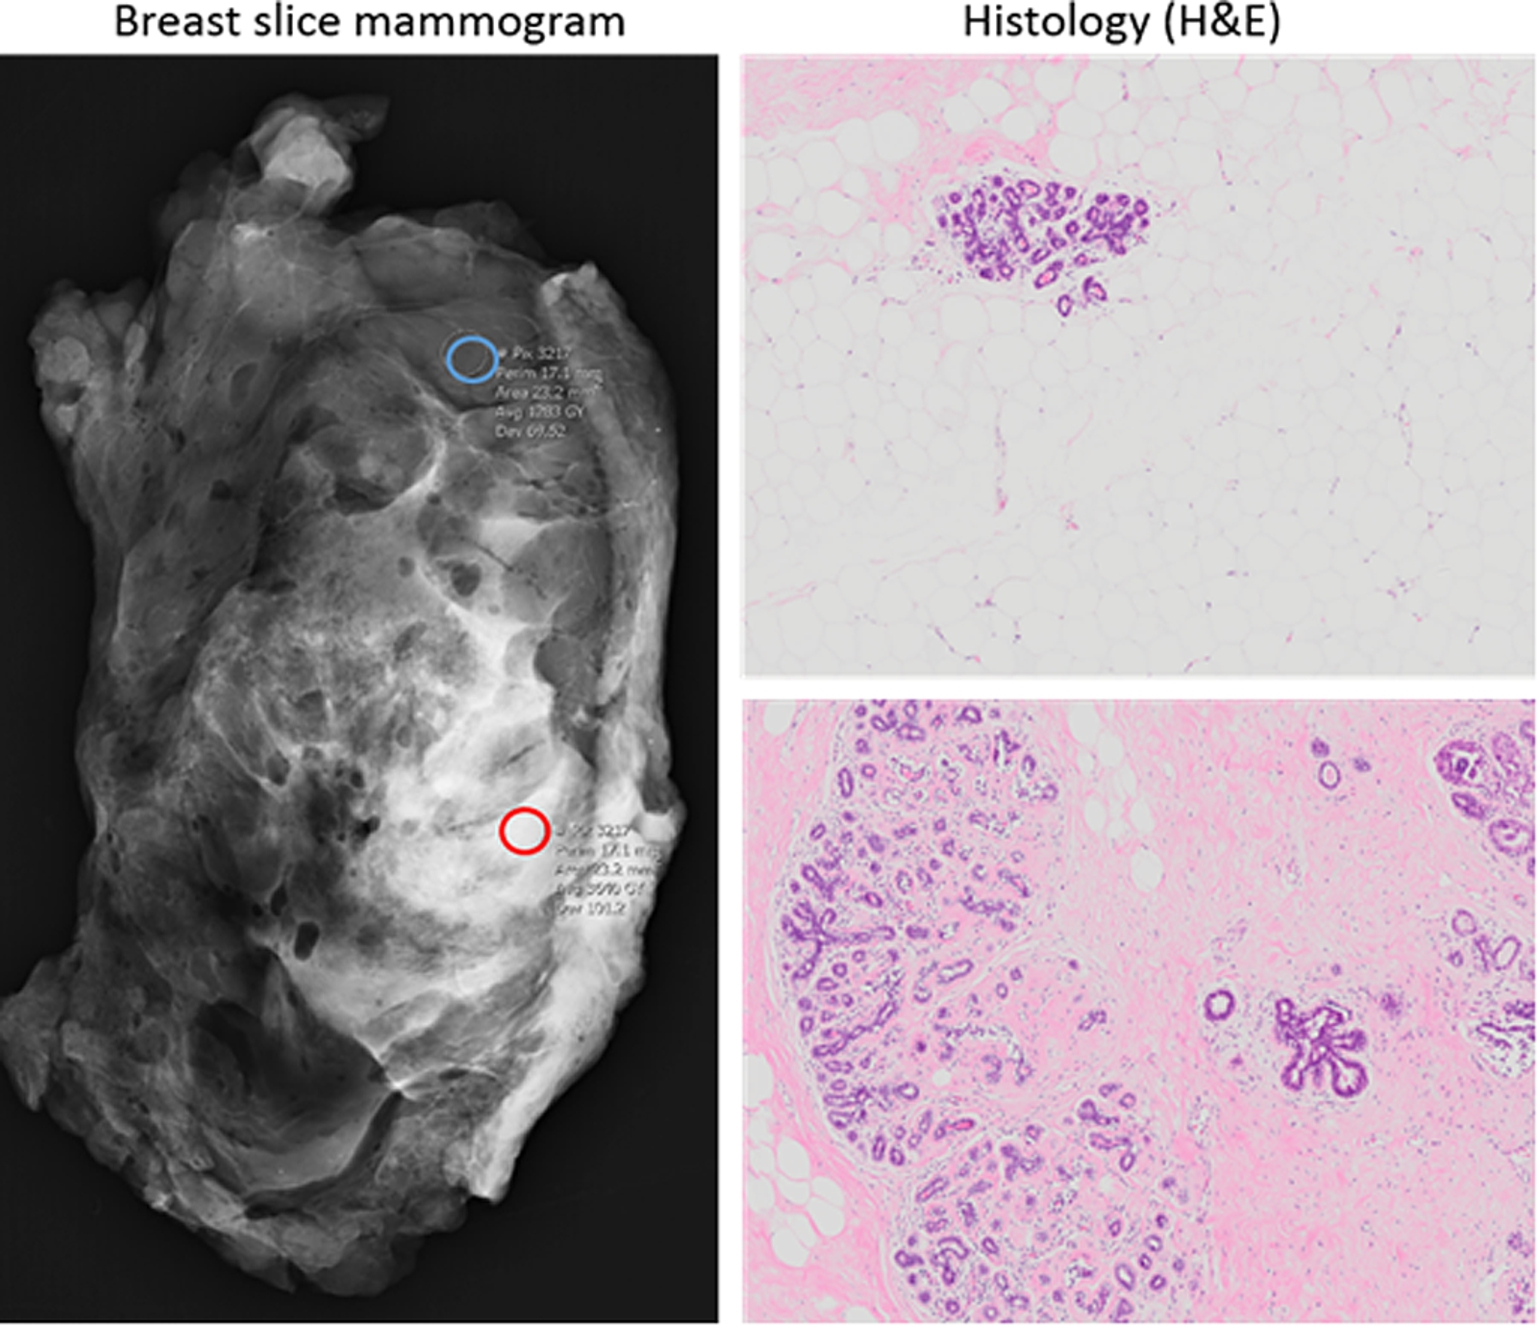
On a mammogram, radio-dense regions, or regions of high MD, correlate to FGT or collagenous stroma and appear white, whilst radio-lucent regions, or regions of low MD, are rich in adipose tissue and appear dark (Fig. 1). Histological studies from our laboratory and others has revealed that high MD areas have increased dense connective tissue, lower adipose content, and modest but significantly increased proportions of epithelial tissue, which show less complex glandular structures [18,40,47,56]. These findings strongly support the hypothesis that the glandular and/or stromal compartments, and corresponding extracellular matrix (ECM) such as collagens and proteoglycans [56,99], are major determinants of MD.
Fig. 1.
Left panel: Mammogram of breast slice indicating regions of high (red circle) and low (blue circle) mammographically dense tissue. Right panel: Haematoxylin and eosin (H&E) stain of representative low-MD (top) and high-MD (bottom) regions following histological processing (4X objective).
MD is an established risk factor for BC in women. Women in the highest MD quartile as determined by BI-RADs have a 4–6 times increased risk of BC compared to those in the lowest quartile [15,116]. Although also associated with increased BC risk [80,128], percent MD (PMD), which is the proportion of MD area as a function of the total breast area, was recently shown to better predict masking of interval cancers [72]. Higher brightness thresholding using the Cumulus software resulted in better risk prediction with successively higher brightness thresholds, dubbed Altocumulus and Cirrocumulus [84–86]. When adjusted for other risk factor interactions using OPERA, the risk associated with MD is similar to, or higher than that seen with known gene mutations and family history [53].
Various factors have been suggested to influence the amount of dense tissue in the breast. MD status has been associated with a range of single nucleotide polymorphisms [105], with estrogen fluctuations (reviewed in [105]) during the menstrual cycle, although this is equivocal [1,124], and with menopause (decrease, [106]). Combined hormone replacement therapy (HRT), which increased the risk of BCs in the Women’s Health Initiative trial [95], causes a dramatic increase in MD [44], and this was recently shown to account for the associated increase in BC risk [19]. Conversely parity, which is known to protect against BC [75] decreases MD [126], with higher numbers of live births correlating with larger decreases. More recently, selective oestrogen receptor modulators such as tamoxifen (TAM) have been shown substantially reduce BC incidence in high risk women [39], and to reduce MD concordantly [17,98]. MD reduction in women treated with TAM correlated with reduced initial BC risk in the preventative setting [29] as well as reduced risk of BC relapse [29,62,70,73]. Additionally, MD is affected by life choices such as diet [74], alcohol (increases [114]), physical activity (reduces; [114]) or lack of parity (increases; [126]). Importantly, these latter influences, along with the HRT and Tamoxifen data above, suggest that MD is dynamic throughout a woman’s life, and to some extent it is possible that MD- associated BC risk can be deliberately modified. As a result, repeated measurements for the longitudinal monitoring of MD may be necessary to dynamically assess patient specific MD-associated BC risk.
Although less described, MD may also be a risk factor for BC in men. In Australia, less than 1% of all BCs occur in men and most will present at late stage [7]. High circulating estrogen leading to gynecomastia is associated with the development of BC in men, as evidenced in men with Klinefelter’s syndrome (testicular failure shortly after puberty) who have 58-fold higher risk of developing BC than normal males [107]. Screening mammography is not recommended for males, due to the lack of mammary tissues, and mammography in males is restricted to the diagnostic setting [93]. The pathologic classification of diffuse glandular gynecomastia presents as high MD on a mammogram and is also associated with higher levels of circulating hormones [6]. It is possible that MD in this context in men similarly leads to both masking and an increase in BC risk due to the tumour-promoting effects of hormone use on the breast tissue, however implications of MD in men is not well documented.
3.How is MD estimated in the clinic?
Despite the emergence of alternative technologies (reviewed in Section 4), the mammogram is still the quickest and most cost-effective method of screening for BC, and presently the only method for estimating MD, as occurs routinely in many states of the United States. In the UK, in a move to develop risk-stratified approaches to population-based breast screening, a trial was conducted in which MD was included to estimate a woman’s overall BC risk, and for determining whether women would want to know this information [38]. This kind of “Breast Composition” categorical assessment (as opposed to “Assessment” which determines presence and severity of breast atypia) is standardised in the BI-RADs (Breast Imaging-Reporting and Data System) scale. Four categories are distinguished: the breast tissue (I) is almost entirely fatty, (II) contains scattered areas of fibroglandular density, (III) is heterogeneously dense, which may obscure small masses or, (IV) is extremely dense, which lowers the sensitivity of mammography [100].
The interpretation of mammography and assessment of MD into one of the four BI-RADs categories has evolved from subjective and qualitative to objective and quantitative. Inter-observer variability has largely been minimised with the advent of computerised approaches to estimate MD using applications such as the semi-automated, user-set thresholding computer program Cumulus [52], its similar but improved alternative AutoDensity [87], and Volpara (Volpara Solutions, Wellington, New Zealand), which is fully automated and provides volumetric data on the breast [103]. These technologies, which standardise MD assessment, have been successfully applied to compare MD in retrospective cohorts [21,32,117]. Machine learning approaches have also identified X-ray ‘textural’ features that overlap only partially with overall MD, and are also strongly associated with BC risk [54,76,112].
While mammography is currently the cheapest and easiest way to determine MD, there are several reasons to develop alternatives. Mammography is not an option for all women – the use of ionising radiation renders mammography unsuitable for young women, women with previous radiation exposure, or those having undergone a partial mastectomy. Low-dose ionising radiation from a chest X-ray has been shown to increase the risk of BC significantly among BRCA1 and BRCA2 mutation carriers [5] and a strong association (odds ratio (OR) 3.21) between CHEK2*1100delC carrier status, BC risk and a history of chest X-rays has been found [10]. Additionally, the use of ionising radiation sets an upper limit on exposure and measurement frequency. As a result, accruing longitudinal data for assessment of changes in MD due to hormonal or lifestyle changes using mammography is not ideal. Alternative MD assessment modalities, such as those mentioned below, may be very helpful in terms of providing refined information on MD-regulatory scenarios. These alternative methods may also add to the understanding of MD through the structural characteristics that they interrogate.
4.Which alternative technologies to the mammogram have been used to define MD?
How can MD be best defined in a routine manner in the clinic, given the array of new technologies available? It could be argued that the strengths of a mammogram-alternate approach to detect MD would lie in its ability to (i) sensitively detect the equivalent of MD in the chosen modality in a true volumetric (i.e. not 3D-extrapolated) manner, (ii) not expose the patient to ionising radiation, (iii) cause minimal discomfort to the patient, and (iv) satisfy cost benefit criteria. Aspects of portability and simplicity of use would be considered secondary to these important issues.
Several alternative technologies have been developed that exploit the various qualities of mammographically dense versus non-dense breast tissue with their “density” concordance to MD summarised in Table 1 and the advantages and disadvantages of each of these alternative techniques summarised in Table 2.
Table 1
How non-mammographic methods compare with mammogram in estimating MD. Where possible, the Spearman’s (
| Approach | Correlation with MD determined by mammogram (MD; automated and/or BI-RADs manual assessment) | Ref. |
| Digital breast tomosynthesis | [8 ,108] | |
| Duel energy X-ray absorptiometry | [78] | |
| Transillumination Spectroscopy | 80–90% prediction with MD; | [11,101,102] |
| Bioimpedance | [79] | |
| US Tomography, B-Mode US | [42,58] | |
| US Elastography | [58] | |
| Diffusion Weighted MRI | Increased MD strongly associated with increased ADC ( | [81 ,90] |
| [60,68,81,111,120,127] |
Table 2
Advantages (denoted by a tick) and disadvantages (denoted by a cross) of various approaches to estimate MD
| Volumetric | Low cost | No ionising radiation | No breast compression | Simplicity of use | Portability | |
| Digital breast tomosynthesis | ✓ | ✗ | ✗ | ✗ | ✗ | ✗ |
| Duel energy X-ray absorptiometry | ✓ | ✗ | ✗ | ✓ | ✗ | ✗ |
| Transillumination Spectroscopy | ✓ | ✓ | ✓ | ✓ | ✓ | ✓ |
| Bioimpedance | ✗ | ✓ | ✓ | ✓ | ✓ | ✓ |
| US Tomography | ✓ | ✓ | ✓ | ✓ | ✓ | ✗ |
| B-Mode US | ✓ | ✓ | ✓ | ✓ | ✓ | ✓ |
| US Elastography | ✓ | ✓ | ✓ | ✗ | ✗ | ✓ |
| Diffusion Weighted MRI | ✓ | ✗ | ✓ | ✓ | ✗ | ✗ |
| ✓ | ✗ | ✓ | ✓ | ✗ | ✗ |
4.1.Approaches which employ ionising radiation
Digital breast tomosynthesis (DBT) is an extension of conventional 2D mammography, where ionising radiation is used to acquire multiple 2D projection images of the compressed breast from many angles [109]. Reconstruction algorithms combine these images to provide a tomographic/sectional and 3D volumetric view of the breast, with the aim of reducing artefacts and false readings that occur in 2D mammography. Despite the similarities between the two techniques and the image refinement, MD measured by DBT has been shown to be underestimated compared to MD measured by conventional mammogram [108]. Correlation between MD measured by DBT and MD measured by mammogram has ranged from moderate (
Dedicated Breast Computed Tomography (DBCT) uses a cone-beam system to perform a true tomographic scan capable of achieving near isotropic resolution in any plane with less noise than DBT and without breast compression [89], and has been demonstrated to be 21.5% more sensitive than mammography in detecting breast lesions [125]. Still in the innovation stages, current prototypes position the patient prone over a breast aperture enabling exclusion of the thorax and body from radiation exposure. It is able to capture images with high signal-to-noise ratio at a similar Average Glandular Dose (AGD) to two-view mammography [14] and less than DBT [89]. The sensitivity of various DBCT prototypes in detecting malignant features and monitoring response to chemotherapy is an ongoing field of research from which improvement in the technology has been derived [89,118]. Studies comparing volumetric density measures between mammography and DBCT have not been reported. However, a study using DBCT to measure Volumetric Glandular Fraction (VGF) in 137 breasts found statistically significant comparison between BI-RADs score and VGF [119].
Dual energy X-ray absorptiometry (DXA) is a technique characterised by low level doses of ionising radiation compared to mammogram and does not require breast compression. Images of the breast using two different X-ray energies are obtained and the difference in attenuation coefficients for fatty tissue and FGT at those two energies can be used, with the aid of a calibration phantom, to calculate the relative portion of each tissue type in the image voxel. Fibroglandular volume (FGV) measured by DXA has showed relatively good agreement with MD from mammogram measurements (
4.2.Approaches which do not employ ionising radiation – transillumination spectroscopy, bioimpedance and photoacoustics
The inherent disadvantage of methods which rely on ionising radiation is the upper limit set on exposure, and in turn measurement frequency, in accordance with patient safety. Conversely, methods which do not rely on ionising radiation have the potential to be used as frequently as required to determine a baseline density, including systematic fluctuations, and monitor longitudinal changes in breast tissue density.
One such technique is Transillumination Spectroscopy, which measures the transmission (the result of absorption and scattering) of non-ionising, optical wavelength radiation (light) through the breast [12,13]. Absorption and scattering of the light as it passes through the breast tissue provides information on tissue composition. Water, haemoglobin and fat have distinctive absorption peaks in the near infrared (NIR) spectrum; 978, 760 and 930 nm respectively [13]. FGT is therefore distinguished from adipose tissue by increased water- and haemoglobin-associated absorption and decreased fat-associated absorption. Additionally, FGT has increased signal attenuation compared to fatty tissue due of the dense cellular and collagen environment, the result of a higher scattering efficiency. MD estimations using this technique have shown good concordance with that of the mammogram (80–90% prediction with MD,
Bioimpedance is another low-cost technique that measures the electrical impedance of a tissue when placed between two electrodes. Because the impedance of fat is higher than that of stromal tissue, measurements of bioimpedance can be used to estimate breast tissue density [30]. Unlike the other techniques mentioned here, which show positive correlations with MD, impedance-based resistance values are lower in dense breasts, such that quantification may present difficulties. Such measurements have been shown to be somewhat inversely correlated with MD determined by mammogram in young women (
Photoacoustics is a hybrid modality combining optical and US imaging techniques to achieve high-resolution imaging. Similar to transillumination spectroscopy, short laser pulses of determined wavelength are delivered to tissue where molecules, such as fat, water and haemoglobin, have different absorption properties. In contrast to transillumination spectroscopy, the recorded signal is generated by the thermoelastic expansion associated with this optical absorption. This expansion propagates US waves which are then detected by a transducer [77]. Heijblom et al. developed a “Photoacoustic Mammoscope” able to differentiate malignant lesions in 30 (out of 31) breasts but with low specificity [50]. Their study also compared the average photoacoustic contrast value for each breast with its BI-RADs category. Their technique, which only used a single wavelength of pulsed laser, was not sensitive to MD [51], however it is theoretically possible that a multi-wavelength investigation may find a photoacoustic contrast-density dependence [50].
4.3.Ultrasound (US) based approaches
Unlike mammography, the above two techniques are non-imaging and provide limited spatial resolution in terms locating regions of high and low density in the breast. Soft tissue imaging techniques such as US allow for a spatially resolved analysis of breast tissue density without exposure to ionising radiation. US transmission tomography exploits the difference in the speed of sound in tissues of various densities, where the speed of sound in dense FGT is faster than in adipose tissue. In US tomography, images are acquired from many different angles around the breast and, from these images the speed of sound map is generated. A strong, positive but non-linear relationship has been shown between the average speed of sound in the breast and MD measured by mammogram (
Conversely, B-Mode US is highly portable and low cost, but generally not quantitative for MD. It is a single-sided, pulse-echo technique that produces an image of the breast where voxel grey-level is related to the relative acoustic impedance of different tissue types. Although the volume of B-Mode-US may be used to obtain a quantitative measure of a breast lesion, B-Mode US cannot measure an analogous-MD quantity, although it has been shown that B-mode US is able to predict MD measured by mammogram based on the distribution of grey-level values in the US image (
4.4.MRI
Like US, MRI techniques provide spatially resolved, volumetric analysis of breast tissue density. Several MRI approaches can be taken to determine breast tissue density, with varying agreement with mammography. Perhaps the mostly frequently utilised method of assessing MD is based on the
Quantitative Diffusion Weighted MRI (DW-MRI) provides unique information relating to the microscopic movement of water molecules in their molecular environment and has been shown to be effective in detecting breast lesions [23]. DW-MRI measures the apparent diffusion coefficient (ADC) of protons as a result of their net displacement during the MRI sequence. Because the protons contributing to the fat signal are relatively stationary, and the water protons within the FGT relatively mobile, the average ADC over the volume of the breast gives an indication of the amount of FGT. Increased MD has been shown to be strongly associated with increased ADC [81]. However, in the application of this technique to BRCA1/2 carriers, the measured ADC showed a relatively weak correlation with MD than other techniques (
MRI-based elastography (MRE) may also have the potential to estimate breast tissue density. Like US elastography, compression (through mechanical and acoustic shear waves) induces tissue displacement. From the amount of displacement, the shear modulus (stiffness) of the tissue can be calculated, with stiffer tissues (like FGT) undergoing less displacement than softer tissue (like fat). This technique has successfully been applied to the identification of breast lesions [104]. Mean stiffness of the breast measured by MRE has been shown to distinguish between fatty (BI-RADs I and II assessed by anatomical MR images) and non-fatty (BI-RADs III and IV) breasts (
Finally, our recent work (Tourell et al.) has pioneered application of single-sided portable-NMR techniques to characterisation of MD [113], demonstrating for the first time the ability of the
5.BPE as a complementary BC risk indicator
BPE occurs during Dynamic-Contrast Enhanced (DCE) MRI. DCE-MRI is commonly used to detect breast tumours, where enhancement is achieved through the intravenous administration of a gadolinium-based contrast agent. As a result, DCE-MRI can detect kinetic features indicative of BC biology, such as neovascularity and vascular permeability [129]. In addition to enhancement of tumour tissue, FGT can also enhance, a phenomenon known as BPE. BPE appears as diffuse white background signal, similar to high mammographically dense tissue on a mammogram.
Similar to MD, BPE is also affected by the amount of circulating estrogen, as best shown in studies examining the effect of menopausal status on BPE, and BPE estimation following anti-estrogen therapy (Table 3). In this latter context, BPE was reduced after estrogen reduction, as has been previously observed for MD assessed by mammogram [98]. However, in the studies shown in Table 3, BPE was shown to be more sensitive to the changing hormonal environment than MRI-FGT and MD [64–66].
Also similar to MD, moderate or marked BPE, in the absence of malignancy, has been associated in several studies with an increase in BC risk ([4,31,55], detailed in Table 4). The target populations in these studies varied, however a major theme was a MRI scan of normal breast tissue, with approximately 1-year follow-up. Generally, BPE was measured by at least two observers and rated on the BI-RADs scale (BPE: minimal/mild/moderate/marked) and a conclusion on risk was made by considering patient outcome at follow-up. Curiously, one study found higher BPE (along with MRI-FGT and MD) in women at risk of developing BC compared to women with BC, however this study did not take into account menopausal status, weight, and details of hormonal therapies, which could reduce BPE [4].
Table 3
BPE more than FGT was found to be maintained by estrogen signalling
| Study/ref. | Population studied | Years | Stats | n | Result | Interpretation |
| [64] | Postmenopausal women with BC, MRI findings of the contralateral unaffected breast, before and during 6–12 months of AI treatment (anastrozole, letrozole, or exemestane) | Aug 1999–Jun 2010 | Sign test | 149 | Anastrazole tx: BPE decreased 37/ 109 (33.9%) vs FGT only decreased 6/ 109 (5.5%) Letrozole tx: BPE decreased 15/ 33 (46%), FGT decreased 1/33 (3%) | BPE more sensitive than FGT to detect reduction |
| [66] | Women with BC, breast MRI both before and during adjuvant tamoxifen therapy | 2002–2008 | Sign test | 88 | BPE + FGT decreased in 68% (60/88), 38% (33/88), and 40% (35/88) ( | BPE was more sensitive than FGT in response to tamoxifen treatment, but FGT was more long-lasting |
| [65] | Women scanned by MRI pre-, then post-menopausal (median interval 49 months) | July–Nov 2010 | Sign test | 28 | FGT and BPE were reduced, BPE more so: unchanged: 39% women BPE reduced: 61% women | BPE more sensitive than FGT to detect reduction |
Table 4
Moderate to marked BPE predicted BC risk in three independent cohorts of women
| Study/ref. | Population studied | Years | Stats | n | Results | Interpretation |
| [31] | Women ⩾18 yrs, high risk but no family history of BC | Jan 2006–Dec 2011 | Conditional logistic regression analysis to estimate odds-ratio (OR) | 23 | Mild, moderate, or marked BPE versus minimal BPE ( | Mild-marked BPE = nine times more likely to develop ca in followup interval compared with minimal BPE |
| [55] | Women who had undergone MBI (MRI) | Feb 2004–Feb 2014 | Conditional logistic regression analysis to estimate odds-ratio (OR) | 3027 | Moderate: 3.4-fold (95% CI 1.6–7.3). Marked BPE: 4.8-fold (95% CI 2.1–10.8) | Moderate-marked BPE 3.4–4.8 fold increased risk of breast cancer |
| [4] | Women who underwent mammography and MRI | 2010–2015 | Pearson’s Chi Square Test | 403 (85% BC, 15% at risk) | BPE ( | MD, FGT and BPE are higher in women at risk of BC |
Interestingly, similar to the ability of high MD regions to obstruct lesion detection by mammogram, BPE also appears to have a confounding effect on the accurate determination of breast lesions by MRI [71,110]. In 2013, MRI measurement of BPE was updated and incorporated into the 5th Edition of the BI-RADs Lexicon [82]. Assessment using BI-RADs with BPE, as defined in this new edition, is subject to variability [45], however computer derived applications are being developed to minimise this source of error [129].
Triple negative BCs (TNBCs) are defined as being negative for the three common types of receptors known to fuel most breast cancer growth – estrogen receptor, progesterone receptor and HER-2/erbB2/neu. Studying the patterns of BPE in MR images of TNBCs has proved informative and has been predictive for recurrence of these cancers [92,121]. High BPE prior to neoadjuvant chemotherapy (NAC) for pre-identified lesions has also been significantly associated with a poorer recurrence-free survival, where high BPE on pre-NAC MRI (
The appearance of BPE determined by DCE-MRI thus exhibits several parallels to MD: BPE can obscure the detection of breast tumours, it has its own BI-RADs category classification, it is affected by estrogen, and numerous studies support the independent associations of BPE and MD with increased BC risk. MD has been shown to have a correlation with FGT as assessed on MRI however BPE appears to be an independent risk factor for BC. According to the literature, BPE and MD do not generally correlate. One study reports a good correlation between these indices [63], whereas several other studies conclude that no direct correlation can be made [28,48,59,69]. Further research is needed to understand exactly why these measures of breast parenchyma do not correlate. It is likely that such work will uncover aspects of this tissue that contribute to BC growth, and hence BC risk, as will a greater understanding of the tissue environments that are responsible for MD.
6.Conclusion
Characterisation of the biophysical make-up of dense breast tissue is advancing, and studies aimed at understanding the contribution of mammographically dense breast tissue components to issues of BC risk and breast cancer progression will reveal novel lifestyle and chemopreventative targets. As understanding in the field of MD increases, and as targets become identified, so will the need and opportunity to employ better screening tools. The increased sensitivity afforded by MRI based approaches, and the added ability to refine risk assessment with the utilisation of parenchymal enhancement characteristics, may provide a way forward in this area.
Acknowledgement
We thank Ms Gillian Jagger (Division of Radiology, Princess Alexandra Hospital) for her support of our program.
Funding
This work was supported by a SPORE grant from the Translational Research Institute (TRI-SPORE), in addition to a Princess Alexandra Hospital Research Foundation grant (ALH Breast Cancer Project Grant). The Translational Research Institute is supported by a grant from the Australian Government.
Conflict of interest
None.
References
[1] | N. Ahmadinejad, S. Movahedinia, S. Movahedinia, K. Holakouie Naieni et al., Distribution of breast density in Iranian women and its association with breast cancer risk factors, Iran Red Crescent Med J 15: ((2013) ), e16615. doi:10.5812/ircmj.16698. |
[2] | E.J. Aiello, D.S. Buist, E. White and P.L. Porter, Association between mammographic breast density and breast cancer tumor characteristics, Cancer Epidemiol Biomarkers Prev 14: ((2005) ), 662–668. doi:10.1158/1055-9965.EPI-04-0327. |
[3] | AIHW, Australian Cancer Incidence and Mortality (ACIM) Books: Breast Cancer, Australian Institute of Health and Welfare, Canberra, Australia, (2017) . |
[4] | M. Albert, F. Schnabel, J. Chun, S. Schwartz et al., The relationship of breast density in mammography and magnetic resonance imaging in high-risk women and women with breast cancer, Clin Imaging 39: ((2015) ), 987–992. doi:10.1016/j.clinimag.2015.08.001. |
[5] | N. Andrieu, D.F. Easton, J. Chang-Claude, M.A. Rookus et al., Effect of chest X-rays on the risk of breast cancer among BRCA1/2 mutation carriers in the international BRCA1/2 carrier cohort study: A report from the EMBRACE, GENEPSO, GEO-HEBON, and IBCCS collaborators’, Group, J Clin Oncol 24: ((2006) ), 3361–3366. doi:10.1200/JCO.2005.03.3126. |
[6] | A.H. Appelbaum, G.F. Evans, K.R. Levy, R.H. Amirkhan et al., Mammographic appearances of male breast disease, Radiographics 19: ((1999) ), 559–568. doi:10.1148/radiographics.19.3.g99ma01559. |
[7] | Australian Institute of Health and Welfare, Breast Cancer Statistics, Canberra, Australia, (2018) . |
[8] | P.R. Bakic, A.K. Carton, D. Kontos, C. Zhang et al., Breast percent density: Estimation on digital mammograms and central tomosynthesis projections, Radiology 252: ((2009) ), 40–49. doi:10.1148/radiol.2521081621. |
[9] | W.A. Berg, D.O. Cosgrove, C.J. Dore, F.K. Schafer et al., Shear-wave elastography improves the specificity of breast US: The BE1 multinational study of 939 masses, Radiology 262: ((2012) ), 435–449. doi:10.1148/radiol.11110640. |
[10] | J.L. Bernstein, S.N. Teraoka, E.M. John, I.L. Andrulis et al., The CHEK2*1100delC allelic variant and risk of breast cancer: Screening results from the Breast Cancer Family Registry, Cancer Epidemiol Biomarkers Prev 15: ((2006) ), 348–352. doi:10.1158/1055-9965.EPI-05-0557. |
[11] | K.M. Blackmore, S. Dick, J. Knight and L. Lilge, Estimation of mammographic density on an interval scale by transillumination breast spectroscopy, J Biomed Opt 13: ((2008) ), 064030. doi:10.1117/1.3041498. |
[12] | K.M. Blackmore, J.A. Knight, R. Jong and L. Lilge, Assessing breast tissue density by transillumination breast spectroscopy (TIBS): An intermediate indicator of cancer risk, Br J Radiol 80: ((2007) ), 545–556. doi:10.1259/bjr/26858614. |
[13] | K. Blyschak, M. Simick, R. Jong and L. Lilge, Classification of breast tissue density by optical transillumination spectroscopy: Optical and physiological effects governing predictive value, Med Phys 31: ((2004) ), 1398–1414. doi:10.1118/1.1738191. |
[14] | J.M. Boone, T.R. Nelson, K.K. Lindfors and J.A. Seibert, Dedicated breast CT: Radiation dose and image quality evaluation, Radiology 221: ((2001) ), 657–667. doi:10.1148/radiol.2213010334. |
[15] | N.F. Boyd, J.W. Byng, R.A. Jong, E.K. Fishell et al., Quantitative classification of mammographic densities and breast cancer risk: Results from the Canadian National Breast Screening Study, J Natl Cancer Inst 87: ((1995) ), 670–675. doi:10.1093/jnci/87.9.670. |
[16] | A.R. Brentnall, E.F. Harkness, S.M. Astley, L.S. Donnelly et al., Mammographic density adds accuracy to both the Tyrer-Cuzick and Gail breast cancer risk models in a prospective UK screening cohort, Breast Cancer Res 17: ((2015) ), 147. doi:10.1186/s13058-015-0653-5. |
[17] | J. Brisson, B. Brisson, G. Cote, E. Maunsell et al., Tamoxifen and mammographic breast densities, Cancer Epidemiol Biomarkers Prev 9: ((2000) ), 911–915. |
[18] | K.L. Britt, W. Ingman, C. Huo, G. Chew et al., The pathobiology of mammographic density, J Cancer Biol Res 2: ((2014) ), 1021–1029. |
[19] | C. Byrne, G. Ursin, C.F. Martin, J.D. Peck et al., Mammographic density change with estrogen and progestin therapy and breast cancer risk, J Natl Cancer Inst 109: ((2017) ). |
[20] | Cancer Research UK. http://www.cancerresearchuk.org/health-professional/cancer-statistics/statistics-by-cancer-type/breast-cancer#heading-Zero [2017 27th June]. |
[21] | J.N. Cawson, C. Nickson, A. Amos, G. Hill et al., Invasive breast cancers detected by screening mammography: A detailed comparison of computer-aided detection-assisted single reading and double reading, J Med Imaging Radiation Oncol 53: ((2009) ), 442–449. doi:10.1111/j.1754-9485.2009.02100.x. |
[22] | D.H. Chang, J.H. Chen, M. Lin, S. Bahri et al., Comparison of breast density measured on MR images acquired using fat-suppressed versus nonfat-suppressed sequences, Med Phys 38: ((2011) ), 5961–5968. doi:10.1118/1.3646756. |
[23] | X. Chen, W.L. Li, Y.L. Zhang, Q. Wu et al., Meta-analysis of quantitative diffusion-weighted MR imaging in the differential diagnosis of breast lesions, BMC Cancer 10: ((2010) ), 693. doi:10.1186/1471-2407-10-693. |
[24] | J.S. Choi, E.S. Ko, E.Y. Ko, B.K. Han et al., Background parenchymal enhancement on preoperative magnetic resonance imaging: Association with recurrence-free survival in breast cancer patients treated with neoadjuvant chemotherapy, Medicine (Baltimore) 95: ((2016) ), e3000. doi:10.1097/MD.0000000000003000. |
[25] | T. Cil, E. Fishell, W. Hanna, P. Sun et al., Mammographic density and the risk of breast cancer recurrence after breast-conserving surgery, Cancer 115: ((2009) ), 5780–5787. doi:10.1002/cncr.24638. |
[26] | T.V. Clendenen, A. Zeleniuch-Jacquotte, L. Moy, M.C. Pike et al., Comparison of 3-point Dixon imaging and fuzzy C-means clustering methods for breast density measurement, J Magn Reson Imaging 38: ((2013) ), 474–481. doi:10.1002/jmri.24002. |
[27] | Collaborative Group on Hormonal Factors in Breast Cancer, Menarche, menopause, and breast cancer risk: Individual participant meta-analysis, including 118 964 women with breast cancer from 117 epidemiological studies, Lancet Oncol 13: ((2012) ), 1141–1151. doi:10.1016/S1470-2045(12)70425-4. |
[28] | R. Cubuk, N. Tasali, B. Narin, F. Keskiner et al., Correlation between breast density in mammography and background enhancement in MR mammography, Radiol Med 115: ((2010) ), 434–441. doi:10.1007/s11547-010-0513-4. |
[29] | J. Cuzick, Breast density predicts endocrine treatment outcome in the adjuvant setting, Breast Cancer Res 14: ((2012) ), 109. doi:10.1186/bcr3235. |
[30] | R.J. Davies, Electrical bioimpedance analysis as a biomarker of breast density and/or breast cancer risk, 2014. |
[31] | B.N. Dontchos, H. Rahbar, S.C. Partridge, L.A. Korde et al., Are qualitative assessments of background parenchymal enhancement, amount of fibroglandular tissue on MR images, and mammographic density associated with breast cancer risk?, Radiology 276: ((2015) ), 371–380. doi:10.1148/radiol.2015142304. |
[32] | K. Drukker, K.J. Horsch, L.L. Pesce and M.L. Giger, Interreader scoring variability in an observer study using dual-modality imaging for breast cancer detection in women with dense breasts, Acad Radiology 20: ((2013) ), 847–853. doi:10.1016/j.acra.2013.02.007. |
[33] | N. Duric, N. Boyd, P. Littrup, M. Sak et al., Breast density measurements with ultrasound tomography: A comparison with film and digital mammography, Med Phys 40: ((2013) ), 013501. doi:10.1118/1.4772057. |
[34] | A. El Maghraoui and C. Roux, DXA scanning in clinical practice, Q J Med 101: ((2008) ), 605–617. doi:10.1093/qjmed/hcn022. |
[35] | S. Elsamany, A. Alzahrani, W.N. Abozeed, A. Rasmy et al., Mammographic breast density: Predictive value for pathological response to neoadjuvant chemotherapy in breast cancer patients, Breast 24: ((2015) ), 576–581. doi:10.1016/j.breast.2015.05.007. |
[36] | L. Eriksson, K. Czene, L. Rosenberg, K. Humphreys et al., Possible influence of mammographic density on local and locoregional recurrence of breast cancer, Breast Cancer Res 15: ((2013) ), R56. doi:10.1186/bcr3450. |
[37] | L. Eriksson, K. Czene, L.U. Rosenberg, S. Tornberg et al., Mammographic density and survival in interval breast cancers, Breast Cancer Res 15: ((2013) ), R48. doi:10.1186/bcr3440. |
[38] | D.G. Evans, L.S. Donnelly, E.F. Harkness, S.M. Astley et al., Breast cancer risk feedback to women in the UK NHS breast screening population, Br J Cancer 114: ((2016) ), 1045–1052. doi:10.1038/bjc.2016.56. |
[39] | B. Fisher, J.P. Costantino, D.L. Wickerham, C.K. Redmond et al., Tamoxifen for prevention of breast cancer: Report of the national surgical adjuvant breast and bowel project P-1 study, J Natl Cancer Inst 90: ((1998) ), 1371–1388. doi:10.1093/jnci/90.18.1371. |
[40] | K. Ghosh, K.R. Brandt, C. Reynolds, C.G. Scott et al., Tissue composition of mammographically dense and non-dense breast tissue, Breast Cancer Res Treatment 131: ((2012) ), 267–275. doi:10.1007/s10549-011-1727-4. |
[41] | C. Glide, N. Duric and P. Littrup, Novel approach to evaluating breast density utilizing ultrasound tomography, Med Phys 34: ((2007) ), 744–753. doi:10.1118/1.2428408. |
[42] | C.K. Glide-Hurst, N. Duric and P. Littrup, Volumetric breast density evaluation from ultrasound tomography images, Med Phys 35: ((2008) ), 3988–3997. doi:10.1118/1.2964092. |
[43] | S.J. Graham, P.L. Stanchev, J.O. Lloyd-Smith, M.J. Bronskill et al., Changes in fibroglandular volume and water content of breast tissue during the menstrual cycle observed by MR imaging at 1.5 T, J Magn Reson Imaging 5: ((1995) ), 695–701. doi:10.1002/jmri.1880050613. |
[44] | G.A. Greendale, B.A. Reboussin, A. Sie, H.R. Singh et al., Effects of estrogen and estrogen-progestin on mammographic parenchymal density, Postmenopausal Estrogen/Progestin Interventions (PEPI) Investigators, Annals of internal medicine 130: ((1999) ), 262–269. |
[45] | L.J. Grimm, A.L. Anderson, J.A. Baker, K.S. Johnson et al., Interobserver variability between breast imagers using the fifth edition of the BI-RADS MRI lexicon, Am J Roentgenol 204: ((2015) ), 1120–1124. doi:10.2214/AJR.14.13047. |
[46] | A. Gubern-Merida, M. Kallenberg, B. Platel, R.M. Mann et al., Volumetric breast density estimation from full-field digital mammograms: A validation study, PLoS One 9: ((2014) ), e85952. doi:10.1371/journal.pone.0085952. |
[47] | Y.P. Guo, L.J. Martin, W. Hanna, D. Banerjee et al., Growth factors and stromal matrix proteins associated with mammographic densities, Cancer Epidemiol Biomarkers Prev 10: ((2001) ), 243–248. |
[48] | N.L. Hansen, C.K. Kuhl, A. Barabasch, K. Strobel et al., Does MRI breast “density” (degree of background enhancement) correlate with mammographic breast density?, J Magn Reson Imaging 40: ((2014) ), 483–489. doi:10.1002/jmri.24495. |
[49] | J.R. Hawley, P. Kalra, X. Mo, B. Raterman et al., Quantification of breast stiffness using MR elastography at 3 Tesla with a soft sternal driver: A reproducibility study, J Magn Reson Imaging 45: ((2017) ), 1379–1384. doi:10.1002/jmri.25511. |
[50] | M. Heijblom, D. Piras, M. Brinkhuis, J.C. van Hespen et al., Photoacoustic image patterns of breast carcinoma and comparisons with magnetic resonance imaging and vascular stained histopathology, Sci Rep 5: ((2015) ), 11778. doi:10.1038/srep11778. |
[51] | M. Heijblom, D. Piras, W. Xia, J.C. van Hespen et al., Visualizing breast cancer using the Twente photoacoustic mammoscope: What do we learn from twelve new patient measurements?, Opt Express 20: ((2012) ), 11582–11597. doi:10.1364/OE.20.011582. |
[52] | J.J. Heine, M.J. Carston, C.G. Scott, K.R. Brandt et al., An automated approach for estimation of breast density, Cancer Epidemiol Biomarkers Prev 17: ((2008) ), 3090–3097. doi:10.1158/1055-9965.EPI-08-0170. |
[53] | J.L. Hopper, Odds per adjusted standard deviation: Comparing strengths of associations for risk factors measured on different scales and across diseases and populations, Am J Epidemiol 182: ((2015) ), 863–867. doi:10.1093/aje/kwv193. |
[54] | J.L. Hopper, T.L. Nguyen, D.F. Schmidt, E. Makalic et al., Predicting breast cancer risk based on information in a mammogram other than conventional mammographic density, in: 8th International Breast Density and Breast Cancer Risk Assessment Workshop, San Fransisco, (2017) . |
[55] | C.B. Hruska, C.G. Scott, A.L. Conners, D.H. Whaley et al., Background parenchymal uptake on molecular breast imaging as a breast cancer risk factor: A case-control study, Breast Cancer Res 18: ((2016) ), 42. doi:10.1186/s13058-016-0704-6. |
[56] | C.W. Huo, G. Chew, P. Hill, D. Huang et al., High mammographic density is associated with an increase in stromal collagen and immune cells within the mammary epithelium, Breast Cancer Res 17: ((2015) ), 79. doi:10.1186/s13058-015-0592-1. |
[57] | C.W. Huo, M. Waltham, C. Khoo, S.B. Fox et al., Mammographically dense human breast tissue stimulates MCF10DCIS.com progression to invasive lesions and metastasis, Breast Cancer Res 18: ((2016) ), 106. doi:10.1186/s13058-016-0767-4. |
[58] | S.M. Jud, L. Haberle, P.A. Fasching, K. Heusinger et al., Correlates of mammographic density in B-mode ultrasound and real time elastography, Eur J Cancer Prev 21: ((2012) ), 343–349. doi:10.1097/CEJ.0b013e32834e3214. |
[59] | A. Kawamura, H. Satake, S. Ishigaki, M. Ikeda et al., Prediction of background parenchymal enhancement on breast MRI using mammography, ultrasonography, and diffusion-weighted imaging, Nagoya J Med Sci 77: ((2015) ), 425–437. |
[60] | M. Khazen, R.M. Warren, C.R. Boggis, E.C. Bryant et al., A pilot study of compositional analysis of the breast and estimation of breast mammographic density using three-dimensional T1-weighted magnetic resonance imaging, Cancer Epidemiol Biomarkers Prev 17: ((2008) ), 2268–2274. doi:10.1158/1055-9965.EPI-07-2547. |
[61] | Z.G. Khodr, M.A. Sak, R.M. Pfeiffer, N. Duric et al., Determinants of the reliability of ultrasound tomography sound speed estimates as a surrogate for volumetric breast density, Med Phys 42: ((2015) ), 5671–5678. doi:10.1118/1.4929985. |
[62] | J. Kim, W. Han, H.G. Moon, S.K. Ahn et al., Breast density change as a predictive surrogate for response to adjuvant endocrine therapy in hormone receptor positive breast cancer, Breast Cancer Res 14: ((2012) ), R102. doi:10.1186/bcr3221. |
[63] | M.Y. Kim, N. Choi, J.H. Yang, Y.B. Yoo et al., Background parenchymal enhancement on breast MRI and mammographic breast density: Correlation with tumour characteristics, Clin Radiology 70: ((2015) ), 706–710. doi:10.1016/j.crad.2015.02.017. |
[64] | V. King, S.B. Goldfarb, J.D. Brooks, J.S. Sung et al., Effect of aromatase inhibitors on background parenchymal enhancement and amount of fibroglandular tissue at breast MR imaging, Radiology 264: ((2012) ), 670–678. doi:10.1148/radiol.12112669. |
[65] | V. King, Y. Gu, J.B. Kaplan, J.D. Brooks et al., Impact of menopausal status on background parenchymal enhancement and fibroglandular tissue on breast MRI, Eur Radiology 22: ((2012) ), 2641–2647. doi:10.1007/s00330-012-2553-8. |
[66] | V. King, J. Kaplan, M.C. Pike, L. Liberman et al., Impact of tamoxifen on amount of fibroglandular tissue, background parenchymal enhancement, and cysts on breast magnetic resonance imaging, Breast J 18: ((2012) ), 527–534. doi:10.1111/tbj.12002. |
[67] | C. Klifa, J. Carballido-Gamio, L. Wilmes, A. Laprie et al., Quantification of breast tissue index from MR data using fuzzy clustering, Conf Proc IEEE Eng Med Biol Soc 3: ((2004) ), 1667–1670. |
[68] | C. Klifa, J. Carballido-Gamio, L. Wilmes, A. Laprie et al., Magnetic resonance imaging for secondary assessment of breast density in a high-risk cohort, Magn Reson Imaging 28: ((2010) ), 8–15. doi:10.1016/j.mri.2009.05.040. |
[69] | E.S. Ko, B.H. Lee, H.Y. Choi, R.B. Kim et al., Background enhancement in breast MR: Correlation with breast density in mammography and background echotexture in ultrasound, Eur J Radiol 80: ((2011) ), 719–723. doi:10.1016/j.ejrad.2010.07.019. |
[70] | K.L. Ko, I.S. Shin, J.Y. You, S.Y. Jung et al., Adjuvant tamoxifen-induced mammographic breast density reduction as a predictor for recurrence in estrogen receptor-positive premenopausal breast cancer patients, Breast Cancer Res Treatment 142: ((2013) ), 559–567. doi:10.1007/s10549-013-2726-4. |
[71] | S. Kohara, S. Ishigaki, H. Satake, A. Kawamura et al., Background parenchymal enhancement in preoperative breast MRI, Nagoya J Med Sci 77: ((2015) ), 373–382. |
[72] | K. Krishnan, L. Baglietto, C. Apicella, J. Stone et al., Mammographic density and risk of breast cancer by mode of detection and tumor size: A case-control study, Breast Cancer Res 18: ((2016) ), 63. doi:10.1186/s13058-016-0722-4. |
[73] | J. Li, K. Humphreys, L. Eriksson, G. Edgren et al., Mammographic density reduction is a prognostic marker of response to adjuvant tamoxifen therapy in postmenopausal patients with breast cancer, Journal of clinical oncology: official journal of the American Society of Clin Oncol 31: ((2013) ), 2249–2256. doi:10.1200/JCO.2012.44.5015. |
[74] | J. Lindgren, J. Dorgan, J. Savage-Williams, D. Coffman et al., Diet across the lifespan and the association with breast density in adulthood, Int J Breast Cancer 2013: ((2013) ), 808317. |
[75] | B. MacMahon, P. Cole, T.M. Lin, C.R. Lowe et al., Age at first birth and breast cancer risk, Bull World Health Organiz 43: ((1970) ), 209–221. |
[76] | S. Malkov, J.A. Shepherd, C.G. Scott, R.M. Tamimi et al., Mammographic texture and risk of breast cancer by tumor type and estrogen receptor status, Breast Cancer Res 18: ((2016) ), 122. doi:10.1186/s13058-016-0778-1. |
[77] | S. Mallidi, G.P. Luke and S. Emelianov, Photoacoustic imaging in cancer detection, diagnosis, and treatment guidance, Trends Biotechnol 29: ((2011) ), 213–221. doi:10.1016/j.tibtech.2011.01.006. |
[78] | G. Maskarinec, Y. Morimoto, Y. Daida, A. Laidevant et al., Comparison of breast density measured by dual energy X-ray absorptiometry with mammographic density among adult women in Hawaii, Cancer Epidemiol 35: ((2011) ), 188–193. doi:10.1016/j.canep.2010.06.009. |
[79] | G. Maskarinec, Y. Morimoto, M.B. Laguana, R. Novotny et al., Bioimpedence to assess breast density as a risk factor for breast cancer in adult women and adolescent girls, Asian Pac J Cancer Prev 17: ((2016) ), 65–71. doi:10.7314/APJCP.2016.17.1.65. |
[80] | V.A. McCormack and I. dos Santos Silva, Breast density and parenchymal patterns as markers of breast cancer risk: A meta-analysis, Cancer Epidemiol Biomarkers Prev 15: ((2006) ), 1159–1169. doi:10.1158/1055-9965.EPI-06-0034. |
[81] | E.S. McDonald, J.G. Schopp, S. Peacock, W.B. DeMartini et al., Diffusion-weighted MRI: Association between patient characteristics and apparent diffusion coefficients of normal breast fibroglandular tissue at 3 t, Am J Roentgenol 202: ((2014) ), W496–W502. doi:10.2214/AJR.13.11159. |
[82] | E.A. Morris, C.E. Comstock, C.H. Lee et al., ACR BI-RADS® magnetic resonance imaging, in: ACR BI-RADS® Atlas, Breast Imaging Reporting and Data System, American College of Radiology, Reston, VA, (2013) . |
[83] | National Cancer Institute, SEER Cancer Statistics Review, 1975–2014, N. Howlader et al., eds, National Cancer Institute, Bethesda, MD, (2017) . |
[84] | T.L. Nguyen, Y.K. Aung, C.F. Evans, G.S. Dite et al., Mammographic density defined by higher than conventional brightness thresholds better predicts breast cancer risk, Int J Epidemiol 46: ((2017) ), 652–661. |
[85] | T.L. Nguyen, Y.K. Aung, C.F. Evans, C. Yoon-Ho et al., Mammographic density defined by higher than conventional brightness threshold better predicts breast cancer risk for full-field digital mammograms, Breast Cancer Res 17: ((2015) ), 142. doi:10.1186/s13058-015-0654-4. |
[86] | T.L. Nguyen, Y.-H. Choi, Y.K. Aung, C.F. Evans et al., Breast cancer risk associations with digital mammographic density by pixel brightness threshold and mammographic system, Radiology 286: ((2018) ), 433–442. doi:10.1148/radiol.2017170306. |
[87] | C. Nickson, Y. Arzhaeva, Z. Aitken, T. Elgindy et al., AutoDensity: An automated method to measure mammographic breast density that predicts breast cancer risk and screening outcomes, Breast Cancer Res 15: ((2013) ), R80. doi:10.1186/bcr3474. |
[88] | K. Nie, J.H. Chen, S. Chan, M.I. Chau et al., Development of a quantitative method for analysis of breast density based on three-dimensional breast MRI, Med Phys 35: ((2008) ), 5253–5262. doi:10.1118/1.3002306. |
[89] | A.M. O’Connell, A. Karellas and S. Vedantham, The potential role of dedicated 3D breast CT as a diagnostic tool: Review and early clinical examples, Breast J 20: ((2014) ), 592–605. doi:10.1111/tbj.12327. |
[90] | E.A. O’Flynn, R.M. Wilson, S.D. Allen, I. Locke et al., Diffusion-weighted imaging of the high-risk breast: Apparent diffusion coefficient values and their relationship to breast density, J Magn Reson Imaging 39: ((2014) ), 805–811. doi:10.1002/jmri.24243. |
[91] | C.C. Park, J. Rembert, K. Chew, D. Moore et al., High mammographic breast density is independent predictor of local but not distant recurrence after lumpectomy and radiotherapy for invasive breast cancer, Int J Radiat Oncol Biol Phys 73: ((2009) ), 75–79. doi:10.1016/j.ijrobp.2008.04.007. |
[92] | V.Y. Park, E.K. Kim, M.J. Kim, J.H. Yoon et al., Breast parenchymal signal enhancement ratio at preoperative magnetic resonance imaging: Association with early recurrence in triple-negative breast cancer patients, Acta Radiol ((2015) ). |
[93] | M.B. Popli, V. Popli, P. Bahl and Y. Solanki, Pictorial essay: Mammography of the male breast, Indian J Radiol Imaging 19: ((2009) ), 278–281. doi:10.4103/0971-3026.57207. |
[94] | H. Preibsch, L. Wanner, S.D. Bahrs, B.M. Wietek et al., Background parenchymal enhancement in breast MRI before and after neoadjuvant chemotherapy: Correlation with tumour response, Eur Radiol 26: ((2016) ), 1590–1596. doi:10.1007/s00330-015-4011-x. |
[95] | J.E. Rossouw, G.L. Anderson, R.L. Prentice, A.Z. LaCroix et al., Risks and benefits of estrogen plus progestin in healthy postmenopausal women: Principal results from the women’s health initiative randomized controlled trial, JAMA 288: ((2002) ), 321–333. doi:10.1001/jama.288.3.321. |
[96] | M. Sak, N. Duric, P. Littrup, L. Bey-Knight et al., Using speed of sound imaging to characterize breast density, Ultrasound Med Biol 43: ((2017) ), 91–103. doi:10.1016/j.ultrasmedbio.2016.08.021. |
[97] | P. Schedin and P.J. Keely, Mammary gland ECM remodeling, stiffness, and mechanosignaling in normal development and tumor progression, Cold Spring Harb Perspect Biol 3: ((2011) ), a003228. |
[98] | M.S. Shawky, H. Martin, H.J. Hugo, T. Lloyd et al., Mammographic density: A potential monitoring biomarker for adjuvant and preventative breast cancer endocrine therapies, Oncotarget 8: ((2017) ), 5578–5591. |
[99] | M.S. Shawky, C. Ricciardelli, M. Lord, J. Whitelock et al., Proteoglycans: Potential agents in mammographic density and the associated breast cancer risk, J Mammary Gland Biol Neoplasia 20: ((2015) ), 121–131. doi:10.1007/s10911-015-9346-z. |
[100] | E.A. Sickles, C.J. D’Orsi and L.W. Bassett, ACR BI-RADS® mammography, in: ACR BI-RADS® Atlas, Breast Imaging Reporting and Data System, American College of Radiology, (2013) . |
[101] | M.K. Simick, R. Jong, B. Wilson and L. Lilge, Non-ionizing near-infrared radiation transillumination spectroscopy for breast tissue density and assessment of breast cancer risk, J Biomed Opt 9: ((2004) ), 794–803. doi:10.1117/1.1758269. |
[102] | M.K. Simick and L. Lilge, Optical transillumination spectroscopy to quantify parenchymal tissue density: An indicator for breast cancer risk, Br J Radiol 78: ((2005) ), 1009–1017. doi:10.1259/bjr/14696165. |
[103] | T. Singh, M. Sharma, V. Singla and N. Khandelwal, Breast density estimation with fully automated volumetric method: Comparison to radiologists’ assessment by BI-RADS categories, Acad Radiology 23: ((2016) ), 78–83. doi:10.1016/j.acra.2015.09.012. |
[104] | R. Sinkus, M. Tanter, T. Xydeas, S. Catheline et al., Viscoelastic shear properties of in vivo breast lesions measured by MR elastography, Magn Reson Imaging 23: ((2005) ), 159–165. doi:10.1016/j.mri.2004.11.060. |
[105] | J. Stone, G.S. Dite, A. Gunasekara, D.R. English et al., The heritability of mammographically dense and nondense breast tissue, Cancer Epidemiol Biomarkers Prev 15: ((2006) ), 612–617. doi:10.1158/1055-9965.EPI-05-0127. |
[106] | J. Stone, R.M. Warren, E. Pinney, J. Warwick et al., Determinants of percentage and area measures of mammographic density, Am J Epidemiol 170: ((2009) ), 1571–1578. doi:10.1093/aje/kwp313. |
[107] | A.J. Swerdlow, M.J. Schoemaker, C.D. Higgins, A.F. Wright et al., Cancer incidence and mortality in men with Klinefelter syndrome: A cohort study, J Natl Cancer Inst 97: ((2005) ), 1204–1210. doi:10.1093/jnci/dji240. |
[108] | A. Tagliafico, G. Tagliafico, D. Astengo, F. Cavagnetto et al., Mammographic density estimation: One-to-one comparison of digital mammography and digital breast tomosynthesis using fully automated software, Eur Radiology 22: ((2012) ), 1265–1270. doi:10.1007/s00330-012-2380-y. |
[109] | A.S. Tagliafico, M. Calabrese, B. Bignotti, A. Signori et al., Accuracy and reading time for six strategies using digital breast tomosynthesis in women with mammographically negative dense breasts, Eur Radiology ((2017) ). |
[110] | M. Telegrafo, L. Rella, A.A. Stabile Ianora, G. Angelelli et al., Effect of background parenchymal enhancement on breast cancer detection with magnetic resonance imaging, Diagn Interv Imaging 97: ((2016) ), 315–320. doi:10.1016/j.diii.2015.12.006. |
[111] | D.J. Thompson, M.O. Leach, G. Kwan-Lim, S.A. Gayther et al., Assessing the usefulness of a novel MRI-based breast density estimation algorithm in a cohort of women at high genetic risk of breast cancer: The UK MARIBS study, Breast Cancer Res 11: ((2009) ), R80. doi:10.1186/bcr2447. |
[112] | G. Torres-Mejia, B. De Stavola, D.S. Allen, J.J. Perez-Gavilan et al., Mammographic features and subsequent risk of breast cancer: A comparison of qualitative and quantitative evaluations in the Guernsey prospective studies, Cancer Epidemiol Biomarkers Prev 14: ((2005) ), 1052–1059. doi:10.1158/1055-9965.EPI-04-0717. |
[113] | M.C. Tourell, T.S. Ali, H.J. Hugo, C. Pyke et al., T1-based sensing of mammographic density using single-sided portable NMR, Magn Reson Med ((2018) ), in press (accepted 31/12/2017, DOI: 10.1002/mrm.27098). |
[114] | T. Trinh, S.E. Christensen, J.S. Brand, J. Cuzick et al., Background risk of breast cancer influences the association between alcohol consumption and mammographic density, Br J Cancer 113: ((2015) ), 159–165. doi:10.1038/bjc.2015.185. |
[115] | J. Tyrer, S.W. Duffy and J. Cuzick, A breast cancer prediction model incorporating familial and personal risk factors, Stat Med 23: ((2004) ), 1111–1130. doi:10.1002/sim.1668. |
[116] | G. Ursin, L. Hovanessian-Larsen, Y.R. Parisky, M.C. Pike et al., Greatly increased occurrence of breast cancers in areas of mammographically dense tissue, Breast Cancer Res 7: ((2005) ), R605–R608. doi:10.1186/bcr1260. |
[117] | D. van der Waal, M.J. Emaus, M.F. Bakker, G.J. den Heeten et al., Geographic variation in volumetric breast density between screening regions in the Netherlands, Eur Radiology 25: ((2015) ), 3328–3337. doi:10.1007/s00330-015-3742-z. |
[118] | S. Vedantham, A.M. O’Connell, L. Shi, A. Karellas et al., Dedicated breast CT: Feasibility for monitoring neoadjuvant chemotherapy treatment, J Clin Imaging Sci 4: ((2014) ), 64. |
[119] | S. Vedantham, L. Shi, A. Karellas and A.M. O’Connell, Dedicated breast CT: Fibroglandular volume measurements in a diagnostic population, Med Phys 39: ((2012) ), 7317–7328. doi:10.1118/1.4765050. |
[120] | J. Wang, A. Azziz, B. Fan, S. Malkov et al., Agreement of mammographic measures of volumetric breast density to MRI, PLoS One 8: ((2013) ), e81653. doi:10.1371/journal.pone.0081653. |
[121] | J. Wang, F. Kato, N. Oyama-Manabe, R. Li et al., Identifying triple-negative breast cancer using background parenchymal enhancement heterogeneity on dynamic contrast-enhanced MRI: A pilot radiomics study, PLoS One 10: ((2015) ), e0143308. doi:10.1371/journal.pone.0143308. |
[122] | J. Wei, H.P. Chan, M.A. Helvie, M.A. Roubidoux et al., Correlation between mammographic density and volumetric fibroglandular tissue estimated on breast MR images, Med Phys 31: ((2004) ), 933–942. doi:10.1118/1.1668512. |
[123] | G.J. Wengert, K. Pinker, T.H. Helbich, W.-D. Vogl et al., Accuracy of fully automated, quantitative, volumetric measurement of the amount of fibroglandular breast tissue using MRI: Correlation with anthropomorphic breast phantoms, NMR Biomed 30: ((2017) ), e3705. doi:10.1002/nbm.3705. |
[124] | E. White, P. Velentgas, M.T. Mandelson, C.D. Lehman et al., Variation in mammographic breast density by time in menstrual cycle among women aged 40–49 years, J Natl Cancer Inst 90: ((1998) ), 906–910. doi:10.1093/jnci/90.12.906. |
[125] | S. Wienbeck, J. Uhlig, S. Luftner-Nagel, A. Zapf et al., The role of cone-beam breast-CT for breast cancer detection relative to breast density, Eur Radiology ((2017) ). |
[126] | C.G. Woolcott, K. Koga, S.M. Conroy, C. Byrne et al., Mammographic density, parity and age at first birth, and risk of breast cancer: An analysis of four case-control studies, Breast Cancer Res Treatment 132: ((2012) ), 1163–1171. doi:10.1007/s10549-011-1929-9. |
[127] | S. Wu, S.P. Weinstein, E.F. Conant and D. Kontos, Automated fibroglandular tissue segmentation and volumetric density estimation in breast MRI using an atlas-aided fuzzy C-means method, Med Phys 40: ((2013) ), 122302. doi:10.1118/1.4829496. |
[128] | L. Yaghjyan, G.A. Colditz, L.C. Collins, S.J. Schnitt et al., Mammographic breast density and subsequent risk of breast cancer in postmenopausal women according to tumor characteristics, J Natl Cancer Inst 103: ((2011) ), 1179–1189. doi:10.1093/jnci/djr225. |
[129] | Q. Yang, L. Li, J. Zhang, G. Shao et al., A new quantitative image analysis method for improving breast cancer diagnosis using DCE-MRI examinations, Med Phys 42: ((2015) ), 103–109. doi:10.1118/1.4903280. |


