
Phase-encoded single-voxel magnetic resonance spectroscopy for suppressing outer volume signals at 7 Tesla
Abstract
Background:
Due to imperfect slice profiles, unwanted signals from outside the selected voxel may significantly contaminate metabolite signals acquired using in vivo magnetic resonance spectroscopy (MRS). The use of outer volume suppression may exceed the SAR threshold, especially at high field.
Objective:
We propose using phase-encoding gradients after radiofrequency (RF) excitation to spatially encode unwanted signals originating from outside of the selected single voxel.
Methods:
Phase-encoding gradients were added to a standard single voxel point-resolved spectroscopy (PRESS) sequence which selects a 2 × 2 × 2 cm3 voxel. Subsequent spatial Fourier transform was used to encode outer volume signals. Phantom and in vivo experiments were performed using both phase-encoded PRESS and standard PRESS at 7 Tesla. Quantification was performed using fitting software developed in-house.
Results:
Both phantom and in vivo studies showed that spectra from the phase-encoded PRESS sequence were relatively immune from contamination by oil signals and have more accurate quantification results than spectra from standard PRESS spectra of the same voxel.
Conclusion:
The proposed phase-encoded single-voxel PRESS method can significantly suppress outer volume signals that may appear in the spectra of standard PRESS without increasing RF power deposition.
1.Introduction
Single-voxel magnetic resonance spectroscopy (MRS) is a powerful tool for non-invasive study of brain chemistry and has been widely applied to detecting metabolic changes in brain tumors [6,14], metabolic and neurodegenerative diseases [7,22], and a range of mental illnesses [4,15–17,21,23]. By constraining signal detection to a pre-defined region, single voxel MRS provides information from a uniquely selected anatomical region. Within the spatially localized region, B0 and B1 field inhomogeneities can also be greatly reduced. This is important at high magnetic field strengths which are usually associated with high B0 and B1 field inhomogeneities.
The significantly increased B0 and B1 field inhomogeneities at high magnetic field strengths, such as 7 Tesla, have several detrimental effects on single voxel MRS. Although the B1 inhomogeneity within the selected voxel can be fairly uniform when localized to a small region, large B1 inhomogeneities over a large spatial distance [3] prevents effective outer volume suppression using additional radio frequency (RF) pulses and spoiler gradients. In addition, at high field, using many RF pulses for outer volume suppression (OVS) can quickly exceed specific absorption rate (SAR) limits set by International Electrotechnical Commission and the US Food and Drug Administration [24]. As a result, the use of RF pulses for OVS is completely avoided in many applications of single voxel MRS at 7 Tesla [12,19]. The large B0 and B1 inhomogeneity outside the selected voxel at high magnetic fields means that RF-based lipid suppression techniques cannot be universally effective because of the large variations in flip angles and large intrinsic susceptibility shifts at high magnetic field.
Although single voxel MRS without additional OVS has proven to be highly successful in certain brain locations [2,12,19], for many applications outer volume signals especially extracranial lipids can dominate the spectra and make spectral interpretation and quantification difficult [11,25]. This is due to the imperfect slice profile used in volume localization methods such as point resolved spectroscopy (PRESS) or stimulated echo acquisition mode (STEAM) [10,18], which cause signals from tissue close to the voxel of interest (VOI) to be excited or refocused to a certain extent. If the surrounding tissue of the selected VOI contains a much stronger signal (e.g. extracranial lipid), or features very different from those of the selected VOI (e.g. a focal lesion due to tumor or stroke vs. healthy tissue), the reconstructed spectra may include significant spectral interference from outside the VOI and may even be dominated by artifacts.
Here, we propose to add phase encoding gradients to a standard single-voxel PRESS sequence to suppress outer volume signals at 7 Tesla without the need to increase SAR. Briefly, this method requires placing phase-encoding gradients after the excitation and refocusing pulses in the PRESS sequence. Through spatial Fourier Transform (FT) with respect to the phase encoding gradients, signals are spatially restored to their source locations and the outer volume signals are thus suppressed in the reconstructed spectrum corresponding to the VOI. Essentially, this technique acquires a spectroscopic image of a pre-selected small voxel. In order to keep the acquisition time unchanged, phase encoding steps in phase-encoded single-voxel PRESS was set to the same number of averages in standard single-voxel PRESS. Because the spatial resolution of the phase encoding gradients is the same as the size of the selected single voxel, signal to noise ratio (SNR) after adding the phase encoding gradients is basically unchanged as discussed previously [5].
2.Materials and methods
2.1.Pulse sequence
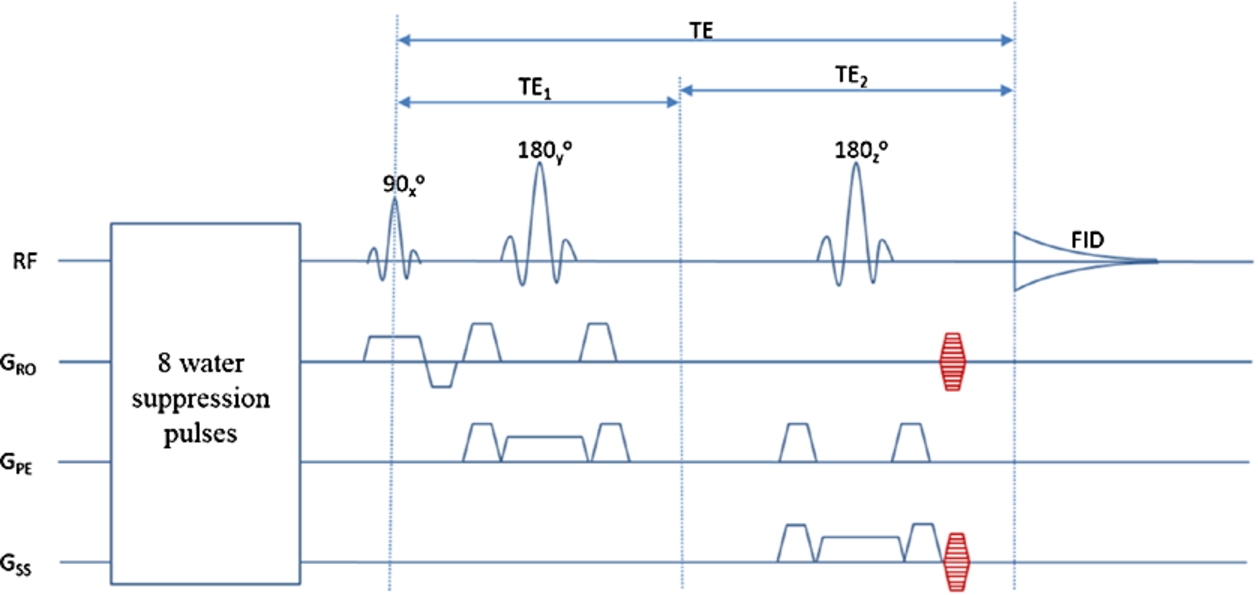
Figure 1 displays the phase-encoded PRESS sequence. Two-dimensional phase encoding gradients were added in the left-right and anterior-posterior directions after the spoiling gradients of the second refocusing pulse in a standard PRESS sequence [1]. Amplitude-modulated excitation and refocusing RF pulses were used: the 90° excitation pulse and 180° refocusing pulses had a duration of 4.5 ms and 8.0 ms, full width at half maximum bandwidth of 3.1 kHz and 2.0 kHz [1], respectively. The slice-selection gradient for the excitation and the two refocusing pulses were in the coronal, sagittal, and axial directions. Because of the SAR limitation, no OVS pulses were used. Due to time limitations, two-dimensional phase encodings were used for all tests performed in this study. The gradient table was computed based on the total encoded spatial area, spatial resolutions, and phase-encoding gradient durations. Water suppression was accomplished by eight variable-power RF pulses with optimized relaxation delays (VAPOR) [26] before the PRESS sequence block. Each of the eight pulses was a sinc-Gaussian pulse lasting 9 ms and with a 310 Hz bandwidth.
Fig. 1.
Schematics of the phase-encoded PRESS pulse sequence. Nine steps of phase-encoding gradients (red) were added in the left-right and anterior-posterior directions. RF: radio frequency; FID: free induction decay; TE: echo time.
2.2.Phantom studies
The phase-encoded PRESS sequence and the corresponding spectral reconstruction method were first evaluated using an in-house built cylinder phantom filled with 15 mM N-acetylaspartic acid (NAA) solution. A small sphere containing corn oil was placed inside the cylinder. Five grams of salt was added to the NAA solution to mimic physiological saline levels, and the pH was adjusted to neutral. MRS data were acquired from a Siemens 7 Tesla scanner (Malvern, PA, USA) equipped with a volume head coil using both the phase-encoded PRESS sequence and the corresponding standard single-voxel PRESS sequence without phase encoding. A total of 81 phase-encoding steps, corresponding to a matrix of 9 × 9 and an encoding area of 18 × 18 cm2, were used in the phase-encoded PRESS sequence. To ensure same acquisition time, the number of averages in the standard PRESS sequence was set to 81, the same as the number of total phase-encoding steps in the phase-encoded PRESS sequence. Other acquisition parameters were the same for both sequences: repetition time (TR) 2.5 s, TE1/TE2 69/37 ms, voxel size 2 × 2 × 2 cm3, spectral bandwidth 4000 Hz, number of data points: 2048. Total MRS scan time: 2.5 s × 81 = 3.4 min. Unsuppressed water signal was also acquired for eddy current correction. Eddy currents were removed by subtracting unsuppressed water phase from metabolite signal phase.
Phantom data were acquired from three different voxels: one voxel was far away from the oil sphere, and the other two voxels were close but with different distances from the oil sphere. The phase-encoding gradients were applied to the left-right and anterior-posterior directions. A FASTMAP sequence [13] was used to adjust the first and second order B0 shim coefficients to achieve an essentially homogeneous field within the VOI. Data reconstruction from the free induction decay (FID) followed the standard routine that includes zero-order phase correction, eddy current correction, and apodization with Lorentzian and Gaussian functions. FT of the averaged FID from the standard PRESS sequence yielded the spectra directly. The spectral reconstruction procedure of phase-encoded PRESS is similar to that of magnetic resonance spectroscopy imaging (MRSI). Because the FIDs were spatially encoded by phase-encoding gradients, additional two-dimensional FT was used to resolve the spatial distribution of all acquired data before a 1D FT was applied to transform the time-domain data into the frequency domain. Because only one voxel was excited in the phase-encoded PRESS experiments, in the absence of outer volume signals, spectra from most non-VOI voxels were largely dominated by noise.
2.3.In vivo studies
Six healthy volunteers (all female, age: 19–58 years) participated in the phase-encoded PRESS sequence in vivo study. All procedures were approved by the institutional review board. Written informed consent was obtained from all participants. No data were excluded.
High resolution 1 × 1 × 1 cm3 T1-weighted MPRAGE (magnetization prepared rapid gradient echo images) images were acquired for voxel placement. Acquisition parameters: TR 3 s, TE 3.9 ms, matrix 256 × 256 × 256. MRS data from each subject were acquired using the phase-encoded PRESS sequence and the corresponding standard PRESS sequence. Phase encoding were applied to the anterior-posterior and superior-inferior directions to ensure that additional extracranial lipid regions were phase-encoded. Acquisition parameters for both sequences were the same as in phantom studies. Data from all subjects were acquired in 3.4 min from a 2 × 2 × 2 cm3 voxel placed at the occipital lobe near the skull. Data from one subject was acquired in 3.4 min from a 2 × 2 × 2 cm3 voxel placed at the occipital lobe away from the skull. Unsuppressed water signals were acquired at the end of each study for eddy current correction. Data post-processing procedures were the same as in phantom studies. Quantification results were obtained using LCModel fitting software developed in-house [20]. Students t-tests were performed to compare quantification results from both sequences.
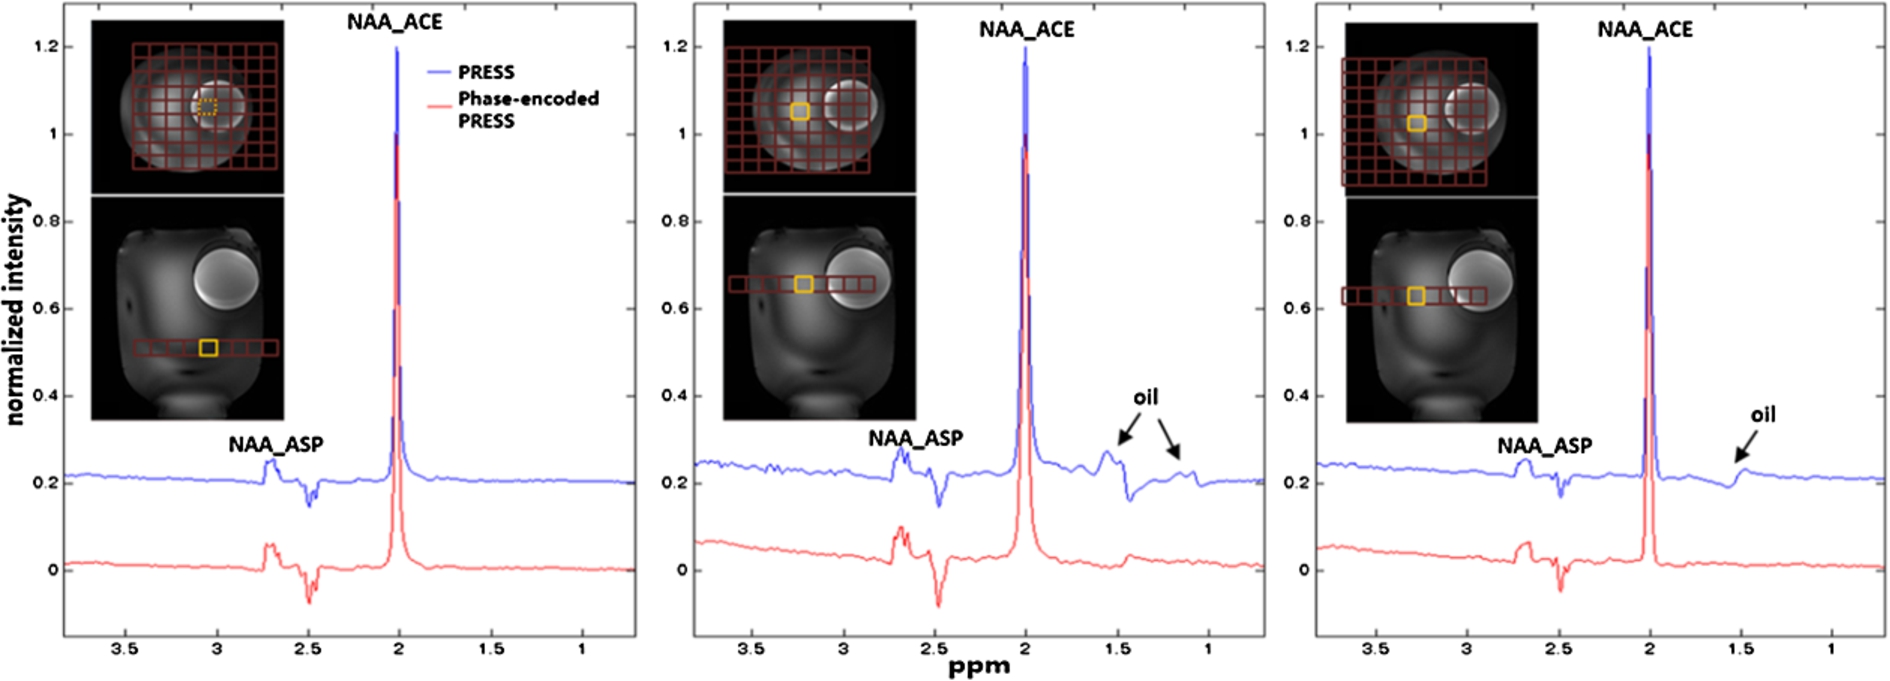
Fig. 2.
Phantom spectra acquired using the phase-encoded PRESS sequence and the standard PRESS sequence at three different locations. The red grids overlaid on axial T1-weighted images on top of the spectra show the phase encoding area, and the yellow squares represent the voxels of interest (VOIs). When the VOI was placed far from the oil sphere (left panel), spectra from both sequences were almost identical. When the VOI was placed close to the oil sphere (middle and right panels), oil signals (black arrows) were found in spectra acquired using the standard PRESS sequence; in contrast, the phase-encoded PRESS sequence significantly suppressed the outer volume oil signals.
3.Results
The phantom spectra acquired using the standard PRESS and the proposed phase-encoded PRESS sequences are displayed in Fig. 2. When the VOI was placed far away from the oil sphere, spectra acquired using the standard PRESS sequence and the phase-encoded PRESS sequence appeared almost identical to each other. However, when the VOI was placed near the oil sphere, the closer the VOI was to the oil sphere, the more oil signals (black arrows) entered the reconstructed spectra when the standard PRESS sequence was used. In contrast, few or no oil signals were seen in the spectra acquired using the phase-encoded PRESS sequence. Figure 3 shows the center portion of spatially arrayed spectra from the phase-encoded PRESS sequence with each spectrum corresponding to a spatial location in the center 5 × 5 red grids in Fig. 2. The spectrum corresponds to the VOI in Fig. 2 was marked by yellow square. In Fig. 3, the oil signals (black arrows) appear in several neighboring locations of the VOI.
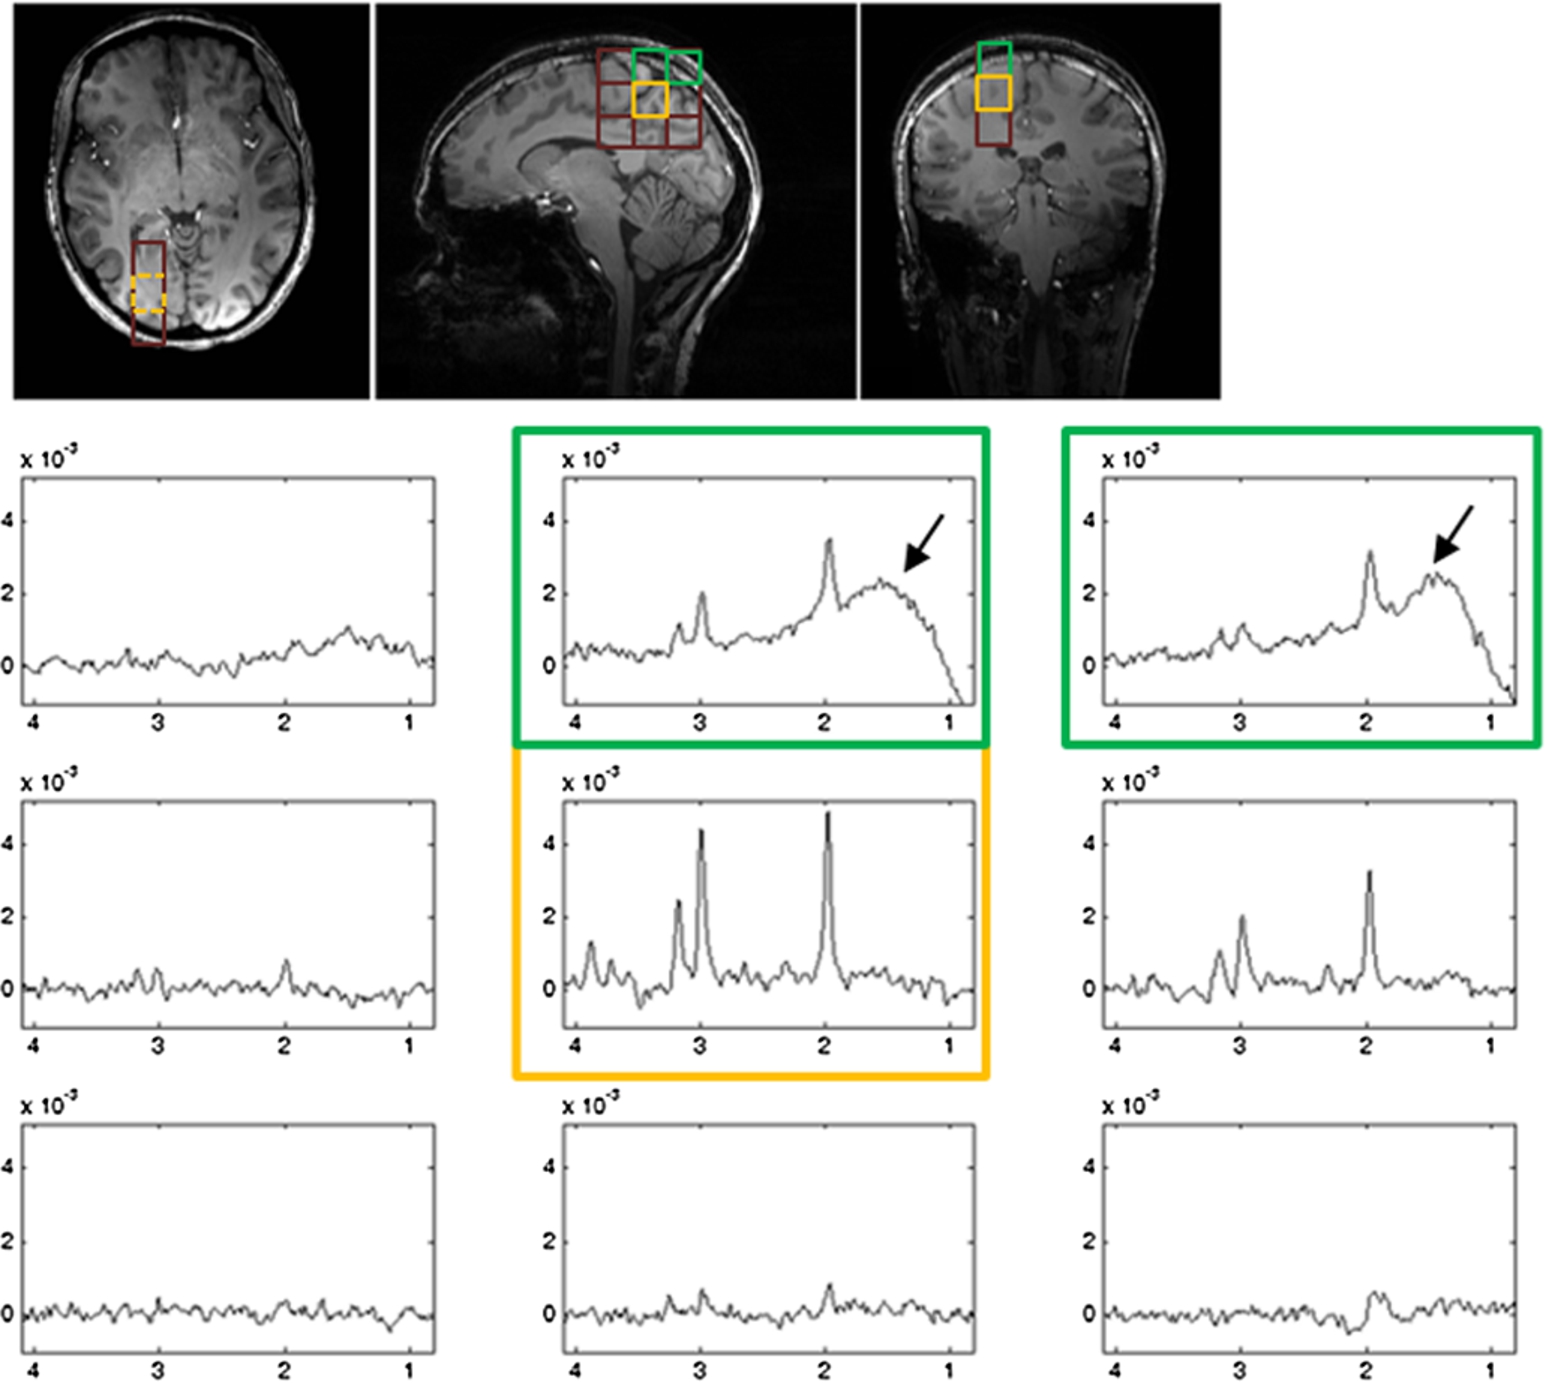
Fig. 3.
Spatially arrayed spectra of the phantom in Fig. 2 (middle panel) acquired using the PE-PRESS sequence. Black arrows indicate oil signals appearing in locations other than the VOI (marked by yellow square).
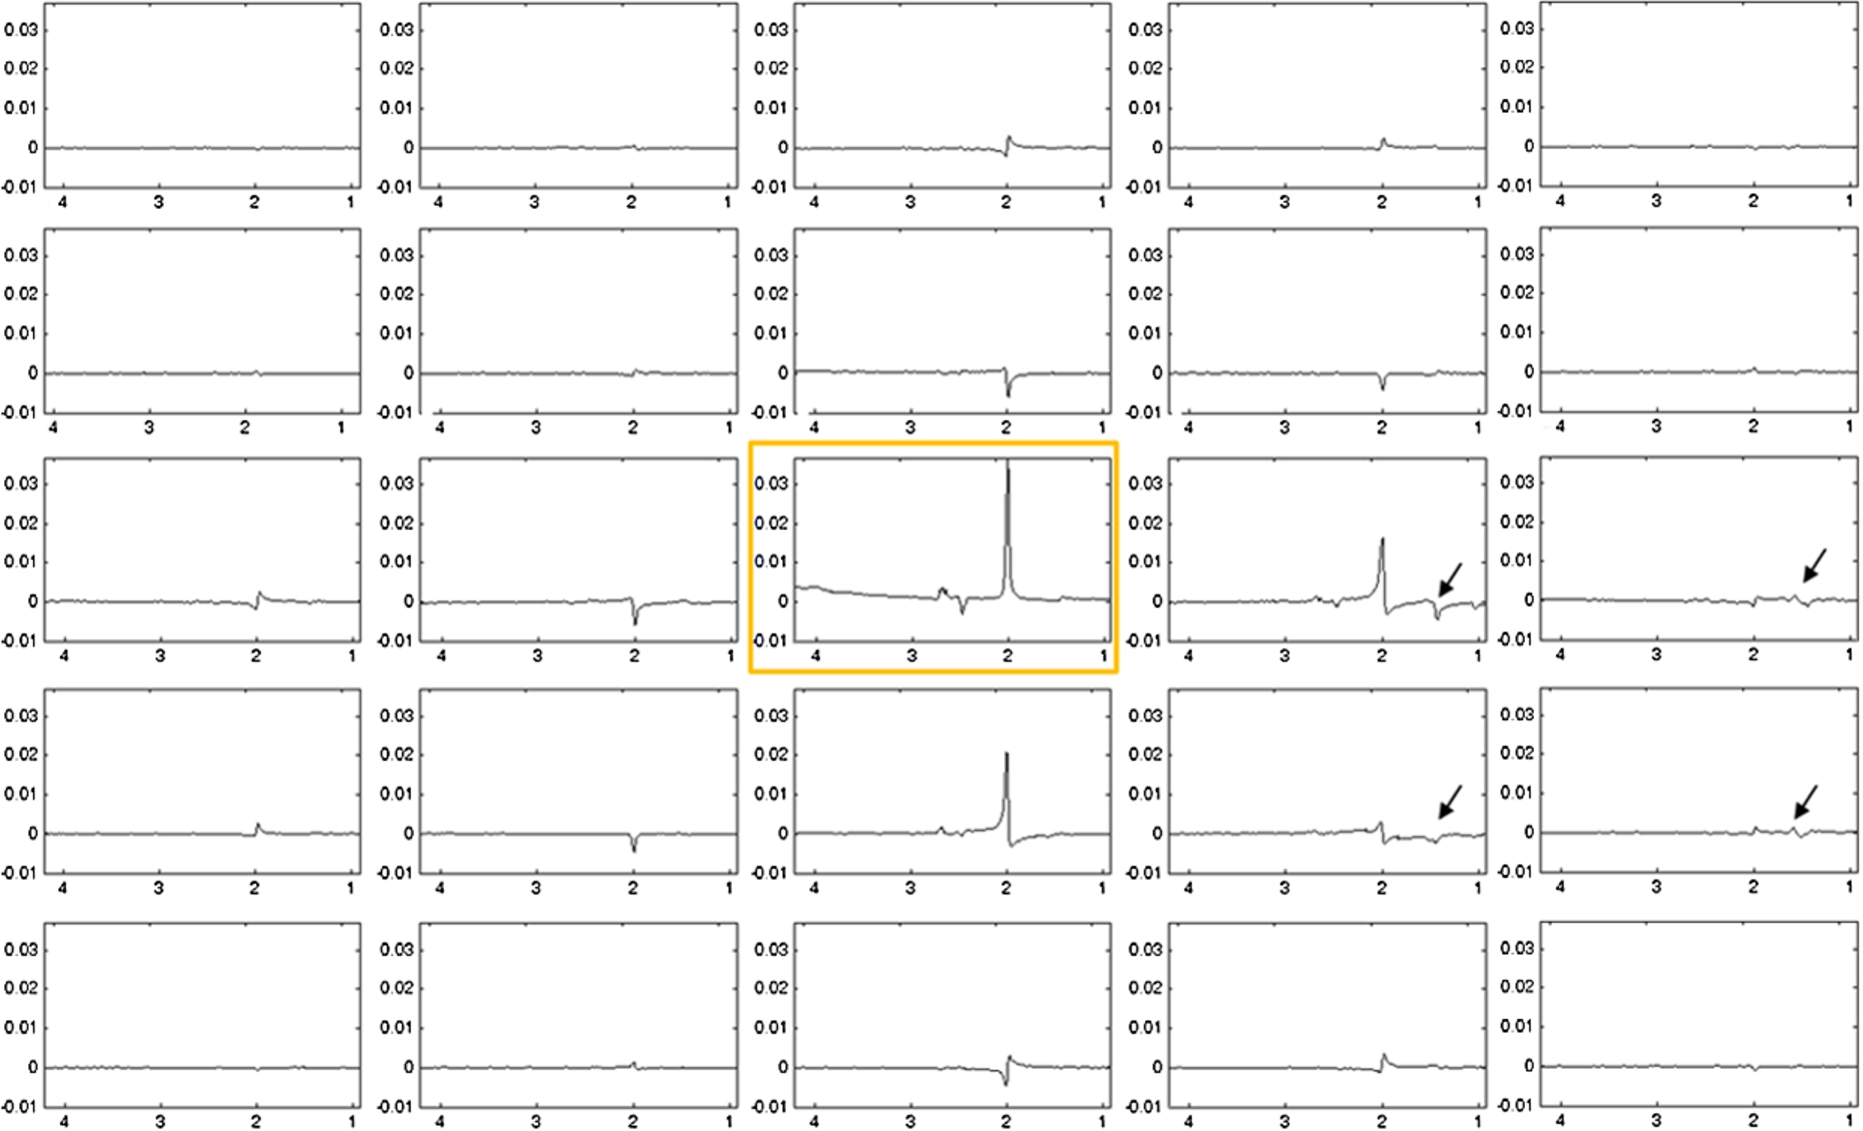
Fig. 4.
In vivo spectra acquired from a VOI in the occipital lobe using both the standard PRESS (blue) and the PE-PRESS (red) pulse sequence. The sagittal T1-weighted image on top of spectra shows that the VOI location (yellow square) is chosen to be away from the skull. Without lipid contamination, both sequence yield similar spectrum.
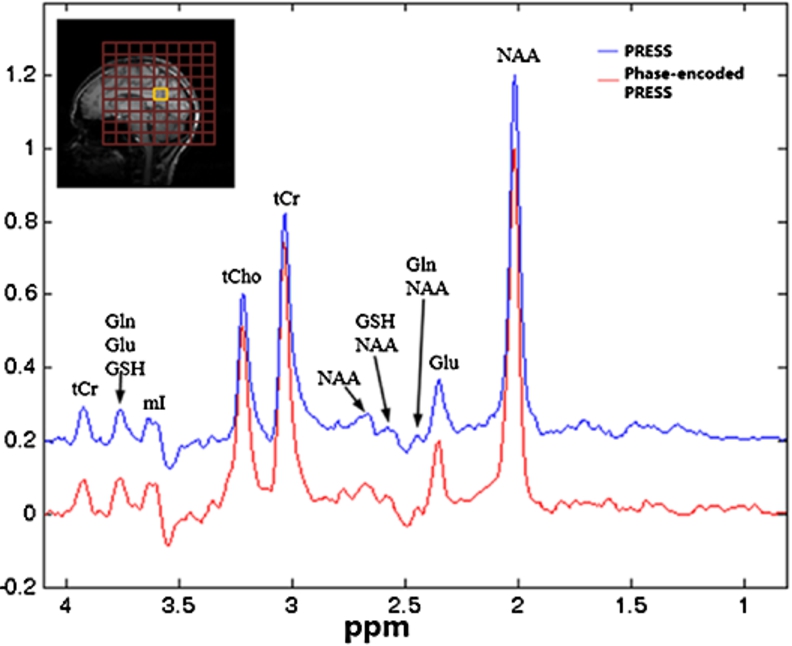
Fig. 5.
In vivo spectra acquired from a voxel of interest (VOI) in the occipital lobe of six subjects using both the standard PRESS (blue) and the phase-encoded PRESS (red) pulse sequences. The red grids overlaid on a sagittal T1-weighted image on top of spectra from subject 1 show the area covered by phase-encoding gradients. The yellow square in the middle represents the VOI, which was chosen to be close to the skull. Large extracranial lipid signals were found in spectra from subjects 1, 3, 4, and 5 when the standard PRESS sequence was used. In contrast, spectra from the phase-encoded PRESS pulse sequence were generally much less affected by lipid signals.
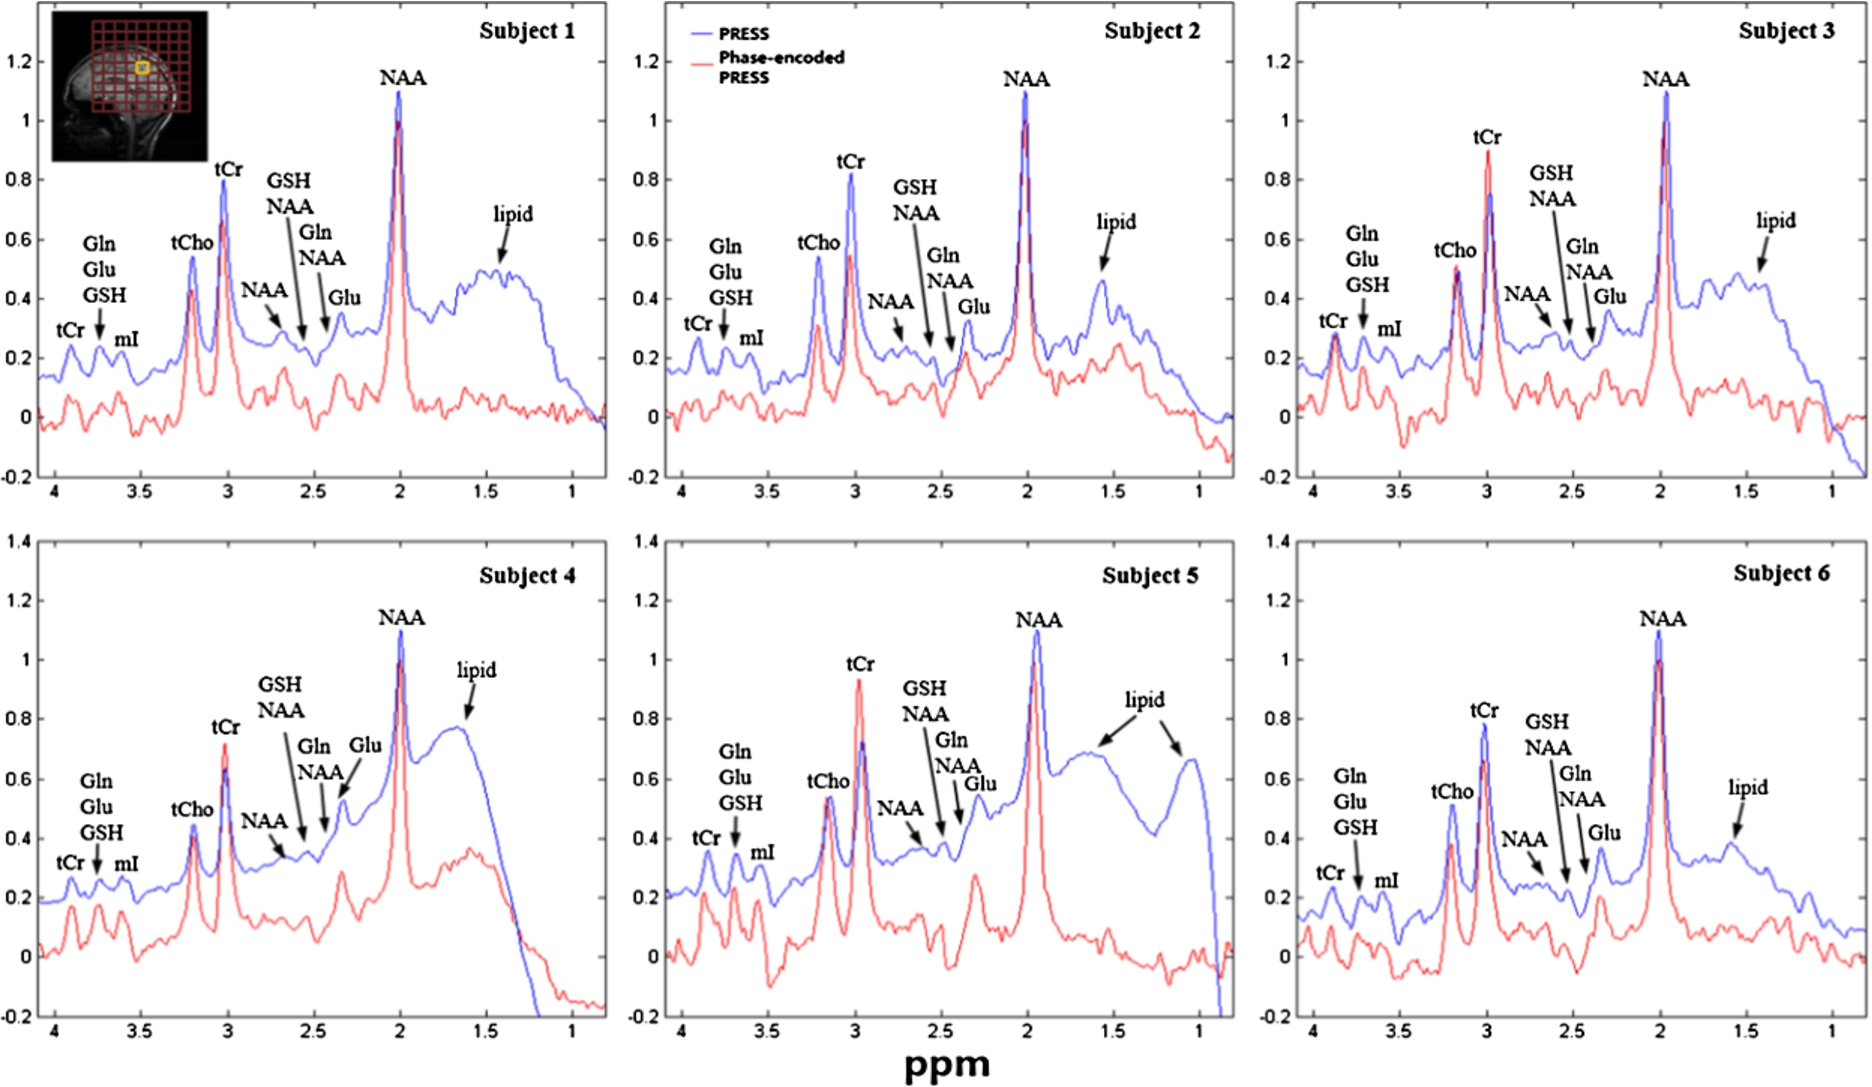
Figure 4 shows in vivo spectra acquired from VOI placed in the occipital lobe away from skull using both phase-encoded PRESS and standard PRESS sequences. No OVS was applied. Spectra from both sequence are essentially the same when lipid was not presented in the nearby voxels. Figure 5 displays the in vivo spectra acquired from VOIs placed in the occipital lobe near the skull (where extracranial lipid signal presents) from all six subjects. Each subject was scanned using both PRESS and phase-encoded PRESS sequences and the same VOI. As with the phantom results, most of the lipid contaminations that appeared in spectra obtained using the standard PRESS sequence (blue) were substantially reduced or not present in spectra acquired using the phase-encoded PRESS sequence (red). Quantification was obtained by fitting each spectrum with simulated basis set that included NAA, N-acetyl-aspartyl-glutamate (NAAG), glutamate (Glu), glutamine (Gln), glutathione (GSH), creatine (Cr), Choline (Cho), aspartate (ASP), γ-aminobutyric acid (GABA), and myo-inositol (mI); the results are summarized in Table 1. Because of lipid contamination, the NAA/Cr concentration ratio quantified using the standard PRESS sequence varied significantly among subjects even though the data were acquired from essentially the same anatomical location, resulting in a much larger standard deviation than the NAA/Cr concentrations obtained using the phase-encoded PRESS sequence. In addition, less intense signals (for instance, Glu and Gln) were more significantly affected by the broad lipid signals during the PRESS sequence. In addition, the concentration ratios of Glu/Cr and Gln/Cr obtained from the standard PRESS sequence deviated considerably from values reported in the literature [8,9,27]. In contrast, the concentration ratios of all fitted metabolites obtained using the phase-encoded PRESS sequence generally agreed with values reported in the literature [8,9,27]. After running a Student’s t-test with unequal variance, no difference was observed in NAA/Cr, Cho/Cr concentration ratio between two sequences (
4.Discussion
Due to high B1 inhomogeneity at high magnetic field strengths and/or by the use of surface transceivers, OVS is far less effective than with a homogeneous B1 field. In particular, at high magnetic field strengths, OVS may need to be curtailed or abandoned altogether so as to keep the SAR under the safety threshold. In a previous 7 Tesla studies, Li et al. have developed proton MRS pulse sequences without OVS [5]. When the VOI is close to the skull, however, one may expect significant lipid interference without effective OVS due to the imperfect slice profile.
In this study, we proposed a phase-encoded single-voxel PRESS sequence that sought to suppress outer volume signals at 7 Tesla and compared it with the corresponding standard PRESS sequence without phase encoding. Neither sequence used RF-based OVS schemes. The proposed technique is quite similar to MRSI, but only a single voxel is excited. Outer volume signals due to imperfect slice profile are detected based on their locations when the phase-encoding gradients are on. Through FT with respect to the applied phase-encoding gradients, signals originating from different locations were spatially resolved. By the design of this phase-encoded PRESS sequence, only the selected VOI was excited and refocused.
The standard PRESS sequence usually requires many averages to ensure sufficient SNR for an accurate quantification. If the number of phase encoding steps in the phase-encoded PRESS sequence is set to as the same as averages in the standard PRESS sequence, and the size of phase encoding steps is set to be the same as the voxel size, the total acquisition time and sensitivity of the two methods are basically the same. Since addition of phase-encoding gradients to a single voxel sequence does not incur additional SAR, this technique adds an extra mechanism for OVS even when RF-based OVS schemes are used, for example, at 3 Tesla.
Table 1
Mean and standard deviation of metabolite/creatine concentration ratios from the occipital lobe voxels close to the skull [
| Chemicals | NAA | Cho | Glu | Gln |
| phase-encoded PRESS | 1.36 ± 0.28 | 0.30 ± 0.04 | 1.32 ± 0.10 | 0.40 ± 0.24 |
| Standard PRESS | 1.52 ± 0.57 | 0.19 ± 0.09 | 4.62 ± 9.01 | 16.15 ± 39.16 |
| Published* | 1.30–1.84 | 0.13–0.62 | 1.15–1.72 | 0.43–1.05 |
* Published values were obtained from references 25–27.
NAA: N-acetylaspartic acid; Cho: choline; Glu: glutamate; Gln: glutamine.
Fig. 6.
Examples of spatially arrayed spectra from Subject 1 (A) and Subject 5 (B). Different rows and columns correspond to different red grids overlaid on the T1-weighted image in Fig. 5. Spectra from VOI are marked by yellow squares. Black arrows indicate that lipid signals were found in spectra from some non-VOI voxels for subject 1 (A) and most of the non-VOI voxels for subject 5 (B).
Because only the selected VOI is excited and refocused by sequence design, the selected voxel corresponds to the FID associated with the largest signal amplitudes. Suprious outer volume signals excited and refocused due to imperfect pulse profiles as well as Fourier leakage due to the largely sinc-shaped point-spread function are usually much smaller than contamination encountered in the standard PRESS of the same voxel (for example, see Fig. 5 and Fig. 6). It should be noted that the original PRESS method works well when the VOI is carefully chosen to be far from potentially significant outer volume signal sources (e.g., scalp lipids). In Fig. 4, outer volume signals due to the imperfect slice profile contribute only negligibly to the final spectra. However, when outer volume interference is highly significant, interpretation and quantification of metabolites becomes much more difficult and less reliable. Several groups found severe outer volume lipid contamination when VOIs were placed close to the skull [11,18,25]. In contrast, the phase-encoded PRESS sequence presented here successfully removed most lipid contamination in the final spectra in all six subjects in vivo (Fig. 5 and Fig. 6). Quantification shows that metabolite concentration ratios obtained from the phase-encoded PRESS sequences generally agreed with values reported in the extant literature; in contrast, metabolite concentration ratios obtained from standard PRESS sequences deviated considerably from values reported in the literature when the latter was significantly affected by outer volume signals.
Because of the use of different phase encoding gradients common MRS motion correction methods such as navigator-based phase correction methods cannot be directly applied to phase-encoded single voxel MRS. The total acquisition time for phase encoded single-voxel PRESS with a 9 × 9 encoding matrix was 3.4 minutes. The high sensitivity at 7 Tesla and therefore the relative short overall scan time should alleviate concerns of motion for most practical applications. In any case, alternative phase encoding strategies, such as elliptical or weighted phase encoding, could further reduce acquisition time.
5.Conclusion
This study used phase-encoding gradients in single-voxel MRS to spatially restore unwanted outer volume signals (especially the broadband lipid signals) to their source locations, thus providing a reconstructed spectrum with significantly suppressed outer volume contamination. Both phantom and in vivo studies found that spectra reconstructed from the phase-encoded PRESS method were largely free of lipid interference and yielded more accurate quantification than spectra reconstructed using the conventional PRESS sequence of the same voxel. The use of phase-encoding gradients to suppress unwanted outer volume signals does not increase SAR. Since it is completely different from RF-based OVS schemes it can also be combined with conventional OVS techniques to further enhance spectral quality.
Acknowledgements
Funding for this study was provided by the Intramural Research Program of the National Institute of Mental Health, National Institutes of Health (IRP-NIMH-NIH; Protocol 11-M-0045). The authors thank Ioline Henter (NIMH) for invaluable editorial assistance.
References
[1] | L. An, S. Li, J.B. Murdoch, M.F. Araneta, C. Johnson and J. Shen, Detection of glutamate, glutamine, and glutathione by radiofrequency suppression and echo time optimization at 7T, Magn Reson Med 73: ((2015) ), 451–458. doi:10.1002/mrm.25150. |
[2] | N. Atassi, M. Xu, C. Triantafyllou, B. Keil, R. Lawson, P. Cernasov, E. Ratti, C.J. Long, S. Paganoni, A. Murphy, N. Salibi, R. Seethamraju, B. Rosen and E.-M. Ratai, Ultra high-field (7tesla) magnetic resonance spectroscopy in Amyotrophic Lateral Sclerosis, PLoS ONE 12: ((2017) ), e0177680. doi:10.1371/journal.pone.0177680. |
[3] | P.A. Bottomley and E.R. Andrew, RF magnetic field penetration, phase shift and power dissipation in biological tissue: Implications for NMR imaging, Phys Med Biol 23: ((1978) ), 630–643. doi:10.1088/0031-9155/23/4/006. |
[4] | P. Brambilla, J.A. Stanley, M.A. Nicoletti, S.B. Roberto, A.G. Mallinger, E. Frank, D.J. Kupfer, M.S. Keshavan and J.C. Soares, 1H magnetic resonance spectroscopy study of the dorsolateral prefrontal cortex in unipolar mood disorder patients, Psychiatry Res 138: ((2005) ), 131–139. doi:10.1016/j.pscychresns.2004.12.001. |
[5] | T.R. Brown, B.M. Kincaid and K. Ugurbil, NMR chemical shift imaging in three dimensions, Proc Natl Acad Sci USA 79: ((1982) ), 3523–3526. doi:10.1073/pnas.79.11.3523. |
[6] | H. Bruhn, J. Frahm, M.L. Gyngell, K.D. Merboldt, W. Hanicke, R. Sauter and C. Hamburger, Noninvasive differentiation of tumors with use of localized H-1 MR spectroscopy in vivo: Initial experience in patients with cerebral tumors, Radiology 172: ((1989) ), 541–548. doi:10.1148/radiology.172.2.2748837. |
[7] | K.M. Cecil, MR spectroscopy of metabolic disorders, Neuroimaging Clin N Am 16: ((2006) ), 87–116. doi:10.1016/j.nic.2005.10.004. |
[8] | R.L. Cowan, N.R. Bolo, M. Dietrich, E. Haga, S.E. Lukas and P.F. Renshaw, Occipital cortical proton MRS at 4 Tesla in human moderate MDMA polydrug users, Psychiatry Res 155: ((2007) ), 179–188. doi:10.1016/j.pscychresns.2007.01.008. |
[9] | E.R. Danielsen, T.V. Elberling, A.K. Rasmussen, J. Dock, M. Hording, H. Perrild, G. Waldemar, U. Feldt-Rasmussen and C. Thomsen, Reduced parietooccipital white matter glutamine measured by proton magnetic resonance spectroscopy in treated Graves’ disease patients, J Clin Endocrinol Metab 93: ((2008) ), 3192–3198. doi:10.1210/jc.2007-2161. |
[10] | R.A. de Graaf, In Vivo NMR Spectroscopy – Principles and Techniques: Single Volume Localization and Water Suppression, 2nd edn, Wiley, Hoboken, NJ, (2007) , pp. 317–320. |
[11] | T. Ernst and L. Chang, Elimination of artifacts in short echo time 1H MR spectroscopy of the frontal lobe, Magn Reson Med 36: ((1996) ), 462–468. doi:10.1002/mrm.1910360320. |
[12] | S.K. Ganji, Z. An, V. Tiwari, S. McNeil, M.C. Pinho, E. Pan, B.E. Mickey, E.A. Maher and C. Choi, In vivo detection of 2-hydroglutarate in brain tumors by optimized point-resolved spectroscopy (PRESS) at 7T, Magn Reson Med 77: ((2017) ), 936–944. doi:10.1002/mrm.26190. |
[13] | R. Gruetter, Automatic, localized in vivo adjustment of all first- and second-order shim coils, Magn Reson Med 29: ((1993) ), 804–811. doi:10.1002/mrm.1910290613. |
[14] | A. Horska and P.B. Barker, Imaging of brain tumors: MR spectroscopy and metabolic imaging, Neuroimag Clin N Am 20: ((2010) ), 293–310. doi:10.1016/j.nic.2010.04.003. |
[15] | F.M. Howells, C.J. Hattingh, S. Syal, E. Breet, D.J. Stein and C. Lochner, 1H-magnetic resonance spectroscopy in social anxiety disorder, Prog Neuropsychopharmacol Biol Psychiatry 58: ((2015) ), 97–104. doi:10.1016/j.pnpbp.2014.12.008. |
[16] | K. Hugdahl, A.R. Craven, M. Nygard, E.M. Loberg, J.O. Berle, E. Johnsen, R. Kroken, K. Specht, O.A. Andreassen and L. Ersland, Glutamate as a medicating transmitter for auditory hallucinations in schizophrenia: A 1H MRS study, Schizophr Res 161: ((2015) ), 252–260. doi:10.1016/j.schres.2014.11.015. |
[17] | N.V. Kraguljac, M.A. Reid, D. White, R. Jones, J. den Hollander, D. Lowman and A.C. Lahti, Neurometabolites in schizophrenia and bipolar disorder – a systematic review and meta-analysis, Psychiatry Res 203: ((2012) ), 111–125. doi:10.1016/j.pscychresns.2012.02.003. |
[18] | R. Kreis, Issues of spectral quality in clinical 1H-magnetic resonance spectroscopy and a gallery of artifacts, NMR Biomed 17: ((2004) ), 361–381. doi:10.1002/nbm.891. |
[19] | N. Lally, L. An, D. Banerjee, M.J. Niciu, D.A. Luckenbaugh, E.M. Richards, J.P. Roiser, J. Shen, C.A. Zarate and A.C. Nugent, Reliability of 7T 1H-MRS measured human prefrontal cortex glutamate, glutamine, and glutathione signals using an adapted echo time optimized PRESS sequence: A between-and-within-sessions investigation, J Magn Reson Imaging 43: ((2016) ), 88–98. doi:10.1002/jmri.24970. |
[20] | N. Li, L. An and J. Shen, Spectral fitting using basis set modified by measured B0 field distribution, NMR Biomed 28: ((2015) ), 1707–1715. doi:10.1002/nbm.3430. |
[21] | Y.R. Lu, Z. Lin and H.C. Li, 1H magnetic resonance spectroscopy imaging of prefrontal region and hippocampus in patients with obsessive-compulsive disorder, Zhejiang Med J 29: ((2007) ), 226–228. |
[22] | W.R. Martin, MR spectroscopy in neurodegenerative disease, Mol Imaging Biol 9: ((2007) ), 196–203. doi:10.1007/s11307-007-0087-2. |
[23] | K. Mori, Y. Toda, H. Ito, T. Mori, A. Goji, E. Fujii, M. Miyazaki, M. Harada and S. Kagami, A proton magnetic resonance spectroscopic study in autism spectrum disorders: Amygdala and orbito-frontal cortex, Brain Dev 35: ((2013) ), 139–145. doi:10.1016/j.braindev.2012.09.016. |
[24] | J.A. Osorio, D. Xu, C.H. Cunningham, A. Chen, A.B. Kerr, J.M. Pauly, D.B. Vignerson and S.J. Nelson, Design of cosine modulated very selective suppression pulses for magnetic resonance spectroscopy imaging at 3T, Magn Reson Med 61: ((2009) ), 533–540. doi:10.1002/mrm.21842. |
[25] | P.E. Ricci, A. Pitt, P.J. Keller, S.W. Coons and J.E. Heiserman, Effect of voxel position on single-voxel MR spectroscopy findings, AJNR Am J Neuroradiol 21: ((2000) ), 367–374. |
[26] | I. Tkac, P. Andersen, G. Adriany, H. Merkle, K. Ugurbil and R. Gruetter, In vivo H-1 NMR spectroscopy of the human brain at 7T, Magn Reson Med 46: ((2001) ), 451–456. doi:10.1002/mrm.1213. |
[27] | J.W. van der Veen and J. Shen, Regional difference in GABA levels between medial prefrontal and occipital cortices, J Magn Reson Imag 38: ((2013) ), 745–750. doi:10.1002/jmri.24009. |


