
Monomeric green fluorescent protein as a protein standard for small angle scattering
Abstract
Protein small angle scattering (SAS) has become increasing important in structural biochemistry, due to the increased performance and specification of new instruments and advances in the software and hardware used to analyse the data. Whilst all of this is encouraging, there is a lack of standardised experimental methodology within the community. Although a number of protein standards are currently used in SAS experiments to allow accurate molecular weight determination, each has specific advantages and disadvantages. We therefore propose the use of a mutated monomeric enhanced green fluorescent protein, as a protein standard, abbreviated to m-eGFP. It has a number of advantages over the currently used protein standards, for example it is cheap and easy to produce. It can be expressed in large amounts (
Abbreviations
σ | 1 standard deviation |
Å | angstrom |
AUC | analytical ultra-centrifugation |
BSA | bovine serum albumin |
D2O | deuterium oxide |
ddH2O | double distilled water |
eGFP | enhanced GFP |
GFP | green fluorescent protein |
HSA | human serum albumin |
I(0) | intensity at zero angle |
kDa | kilodaltons |
Kd | binding affinity |
m-eGFP | monomeric eGFP |
MS | mass spectrometry |
Mw | molecular weight |
P(r) | distance distribution function |
Rg | radius of gyration |
S | S(vedberg) unit of sedimentation-coefficient |
SAS | small angle scattering |
SANS | small angle neutron scattering |
SAXS | small angle X-ray scattering |
SDS-PAGE | sodium dodecyl sulphate polyacrylamide gel electrophoresis |
1.Introduction
Small angle scattering (SAS) using either X-rays or neutrons is a powerful technique [1,2], which requires accurate standard calibration to allow the determination of the molecular weight (Mw) and volume of biomolecules, most commonly proteins [3,4]. Proteins can either be calibrated by comparison to a known protein standard [5,6] or by placing on an absolute scale versus water [7]. The calibration of proteins can be described using the following equation:
2.Materials and methods
2.1.Molecular biology and protein expression
The eGFP plasmid (QBio-GENE – http://www.qbiogene.com/technical/maps/txt/s-pQBI-T7-BFP.txt plus S66T and H67Y mutations) was provided as a gift from Prof. Cameron Neylon (Curtin University, Australia). Mutagenesis of eGFP was performed using an Agilant QuikChange II Site-Directed Mutagenesis kit and the custom sense and antisense primers designed using the Agilant QuikChange Primer Design site (http://www.genomics.agilent.com/primerDesignProgram.jsp). m-eGFP was produced by a single amino acid mutation at amino acid position 206 (A206K), specifically an alanine (A-GCC) being mutated to a lysine (K-AAA). To confirm mutagenesis sequencing was undertaken by Source Bioscience Ltd. (Oxford, UK) using the purified plasmid DNA and a customised forward sequencing primer of GGTGATGCAACATACGGAAA starting at DNA sequence number 4743, to allow sequencing of the mutation at sequence number 5256. The plasmid was transformed either into BL21(DE3) E. coli cells and grown in LB media to produce hydrogenous protein or Slantes buffer OD-5 E. coli 2H media (Silantes GmbH, Germany) for deuterated protein in a BioFlo 110 Bioreactor (New Brunswick, UK) to an OD600 of 1.2, then induced with 0.5 mM IPTG for 4 hrs at 37°C. The cells were then harvested at 3000 rpm in F8S (Thermo Sorvell™) centrifuge tubes. The cells were lysed using Bugbuster™ (Novagen, UK) and 5 minutes ON/OFF 10 second cycles of sonication. The lysate was passed through a Colbolt IMAC Hitrap™ column (General Electric Healthcare, UK) and the protein was eluted by increasing the imidazole concentration to 200 mM in a Tris pH 7.5, 150 mM NaCl buffer. After purification the 5-His tag was enzymatically cleaved using the Sortase A enzyme at the LPXTG motif (see Supplementary Material Fig. 1) and the protein was then dialysed into a 20 mM Tris, 150 mM NaCl, pH 7.5 buffer in ddH2O before experimentation.
2.2.SDS-PAGE gels
A 10 μL sample of 10 μM eGFP and m-eGFP was run alongside a Sigma Wide range marker (Sigma Aldrich, UK) at 150V on a 12% SDS PAGE Tris-gels using a Bio-Rad Mini Protean (Biorad, UK) electrophoresis at 298K. The gel was stained in Biosafe™ Coomassie blue (Biorad, UK).
2.3.Mass spectrometry
Mass spectrometry was performed on a Micromass Q-Tof Micro Mass spectrometer (Waters, UK) on a 10 μM hydrogenous m-eGFP sample in 20 mM phosphate and 150 mM NaCl at pH 7.5 in ddH2O.
2.4.UV absorption
The concentration of m-eGFP was determined by its A280 absorption value. Samples were measured using an Eppendorf microvolume cuvette on a GeneQuant 1300 (General Electric Healthcare, UK) spectrophotometer. M-eGFP concentrations were determined using a calculated extinction co-efficient of
2.5.Analytical ultracentrifugation
Sedimentation velocity experiments were conducted at 20 °C and 129,024 g (RCF) in a Beckman XL-I analytical ultracentrifuge and Rayleigh interference data was recorded for 999 scans at 1 minute intervals. The resulting concentration distributions were processed exactly the same for each spectra and analysed by the SEDFIT program [25] to obtain c(s) – s distributions for hydrogenous eGFP and m-e GFP at 1, 5 and 10 mg/mL in a 20 mM Phosphate, 150 mM NaCl buffer at pH 7.5 in ddH20 conducted at 20 °C. The experimental hydrodynamic parameters were compared to theoretical parameters calculated using the GFP crystal structure (Pdb: 1EMA) [14] in the HYDROPRO software program [26].
2.6.SAXS data collection
SAXS measurements of a hydrogenous m-eGFP protein in hydrogenous buffer were performed at three different concentrations (1, 5 and 10 mg/mL) on the B21 beamline at the Diamond Light Source Ltd. [27] (UK) using the automated BIOSAXS robot for sample loading at 15 °C. B21 was operated at a fixed camera length of 3.9 m and an energy of 12.4 keV to collect data between 0.015 and
2.7.SANS data collection
SANS experiments of hydrogenous m-eGFP protein in deuterated buffer and deuterated protein in hydrogenous buffer at three different concentrations (1, 5 and 10 mg/mL) were conducted at the ISIS Spallation Neutron Source (UK) using the LOQ and SANS2d Instruments [29,30]. LOQ is a time of flight (TOF) SANS instrument with a two-dimensional 64 cm by 64 cm 3He–CH4 ORDELA detector with 5 mm resolution. Neutron wavelengths of between 2.2 and 10 Å were utilised and a distance of 4.1 m between sample position and the detector was used to measure scattering profiles. SANS2d is also a time of flight (TOF) instrument with two two-dimensional 96.5 cm by 96.5 cm 3He–CF4 filled ORDELA detectors with a 5 mm resolution. Neutron wavelength between 2 and 14 Å were utilised and a distance of between 2 and 12 m between sample position and detector were used to measure the scattering profile. Both instruments used absolute intensities for scattering determined using a partially deuterated polymer standard. All measurements were carried out at room temperature in sealed 1 mm pathlength quartz cuvettes (Hellma Analytics) during data collection. The data from the two dimensional area detector was converted into one-dimensional intensity profiles by radial averaging. The SANS data was then corrected to allow for sample transmission and background scattering (using either 20 mM Tris, 150 mM NaCl at pH/pD 7.5 in ddH2O for deuterated protein samples or D2O for hydrogenous protein samples as a reference).The data was processed using the Mantid software package (ISIS Neutron and Muon Source, UK) [31].
2.8.SAS data analysis
For SANS measurements, theoretical estimates of the scattering length density of the protein and estimates of its intensity at zero angle I(0) were performed using the Biological Scattering Length Density Calculator (http://psldc.isis.rl.ac.uk/Psldc/). For all SAS measurements, Guinier analysis was performed using the ISIS Biological scattering Guinier webtool (http://psldc.isis.rl.ac.uk/Guinier). Data was taken in line with globular proteins from a minimum
Fig. 1.
A 12% SDS-PAGE of a eGFP (middle) and m-eGFP (right) run alongside a Sigma Wide Range marker (left).
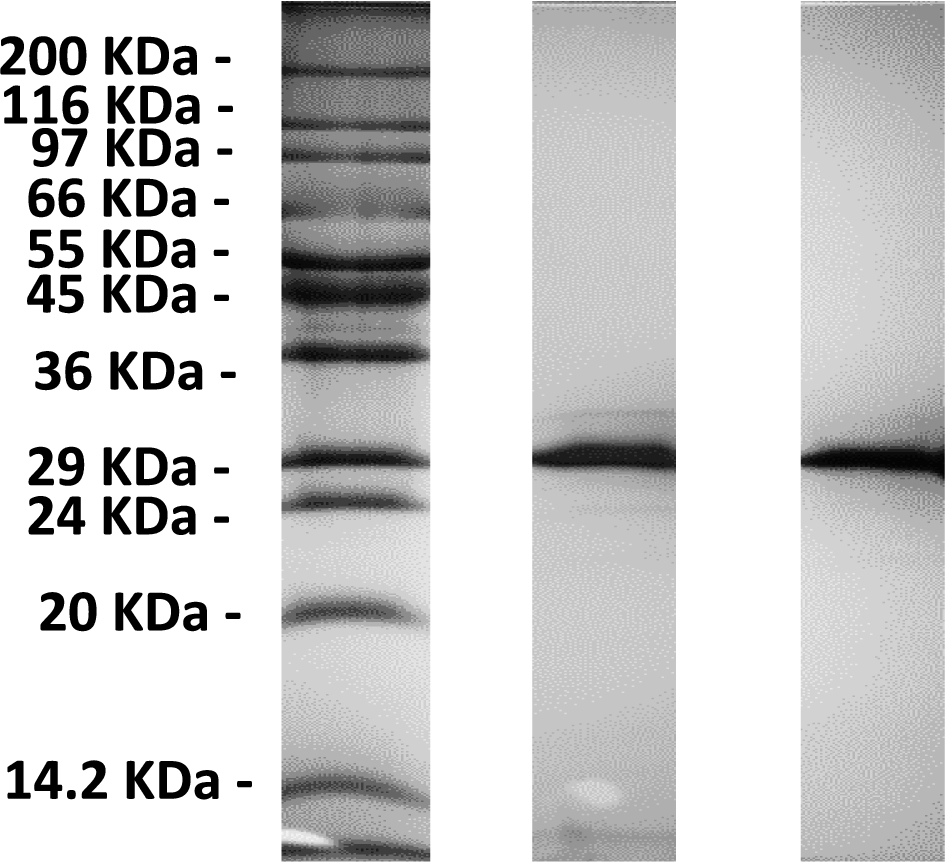
Fig. 2.
A mass spectrum of a hydrogenous m-eGFP protein sample in hydrogenous buffer. Protein buffer was 20 mM phosphate, 150 mM NaCl at pH 7.5.
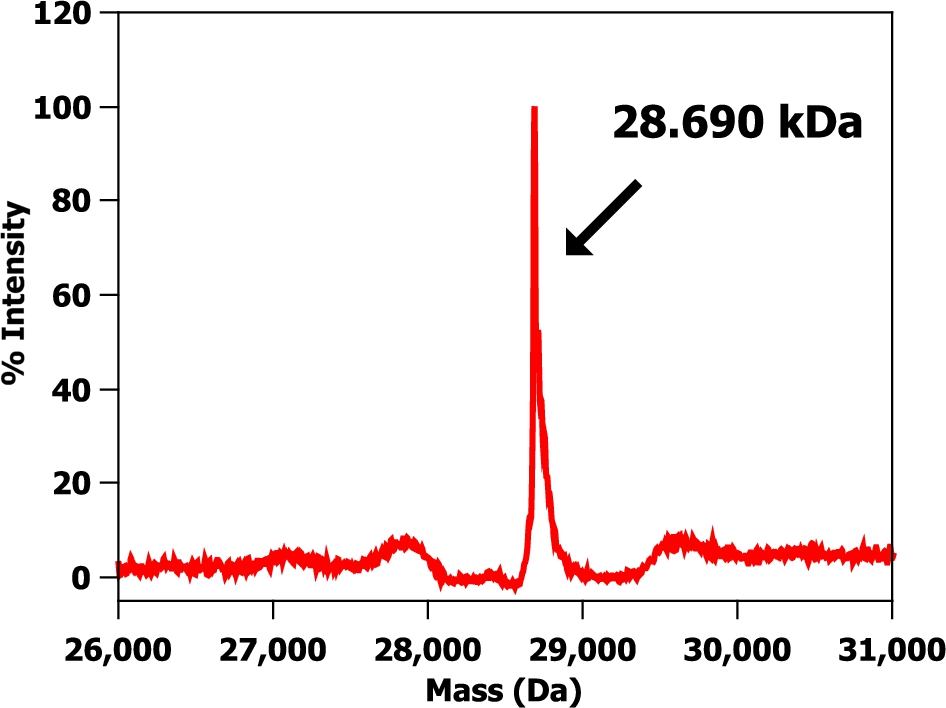
Fig. 3.
A sedimentation velocity analytical ultracentrifugation experiment using Rayleigh interference optics of hydrogenous m-eGFP at 1 (black – solid line), 5 (red – dash line) and 10 mg/mL (green – dot line) concentrations. The sedimentation coefficient distribution was obtained using SEDFIT analysis [25]. The sample was run in a 20 mM phosphate, 150 mM NaCl buffer in ddH2O conducted at 20 °C and 129,024 g (RCF).
![A sedimentation velocity analytical ultracentrifugation experiment using Rayleigh interference optics of hydrogenous m-eGFP at 1 (black – solid line), 5 (red – dash line) and 10 mg/mL (green – dot line) concentrations. The sedimentation coefficient distribution was obtained using SEDFIT analysis [25]. The sample was run in a 20 mM phosphate, 150 mM NaCl buffer in ddH2O conducted at 20 °C and 129,024 g (RCF).](https://ip.ios.semcs.net:443/media/bsi/2017/6-3-4/bsi-6-3-4-bsi167/bsi-6-bsi167-g003.jpg)
![The crystal structure of Green Fluorescent Protein (GFP) monomer – Pdb: 1EMA [14].](https://ip.ios.semcs.net:443/media/bsi/2017/6-3-4/bsi-6-3-4-bsi167/bsi-6-bsi167-g004.jpg)
3.Results and discussion
The SDS-PAGE gel (see Fig. 1) shows a single band just below the 29 kDa marker as expected from the calculated molecular weight of full-length hydrogenous m-eGFP (28.6 kDa – see Supplementary Material Fig. 1 – for the full coding sequence). No other significant protein bands were observed on the SDS-PAGE gel, indicative of a highly purified sample. The mass spectrum (see Fig. 2) of the same sample shows one single peak with a molecular weight of 28.6 kDa, corresponding to the hydrogenous m-eGFP. As a final analysis of sample purity and homogeneity, three concentrations of m-eGFP (1, 5 and 10 mg/ml) were run in an analytical ultracentrifuge in a sedimentation velocity experiment using Rayleigh interference optics (see Fig. 3). As expected the m-eGFP showed only one peak at 1.9 S(vedberg) at each of the three concentrations, this is again indicative of a monodisperse, high purity sample. The standard, non-mutated, eGFP sample (Supplementary Material – Fig. 2) was also ran at the same three concentrations (1, 5 and 10 mg/ml) and showed two distinct populations of species in slow exchange [38]. The two species were confirmed as being the monomer at 1.9 S and the dimer at 2.5 S, by calculating theoretical Svedberg values for the monomer and dimer of eGFP using the HYDROPRO software [26] and the crystal structures of both proteins (Pdb: 1EMA [14] and 1GFL [15], respectively – see Fig. 4 and Supplementary Material Fig. 3) As expected the dimer increased as a percentage of the total concomitant to increasing protein concentration in accordance with a binding affinity of 100 μM (see Supplementary Fig. 1) [17]. The dimer made up 39, 60 and 70% of the total species at 1, 5 and 10 mg/mL respectively (See Supplementary Material Equation 1 and Table 1 for the full derivation of monomer: dimer binding and the theoretical population percentages versus AUC experimental results). After mutation of e-GFP, to monomeric eGFP (m-eGFP), disrupting its dimersation interface, the dimersation binding affinity increases 740 fold to 74 mM [17], this means the monomer is over 99% of m-eGFP at the experimental concentrations (see Supplementary Material Table 1).
Fig. 5.
Small angle X-ray scattering (SAXS) curves of three different concentrations of hydrogenous m-GFP in hydrogenous buffer, at 1 mg/mL (green – flat line), 5 mg/mL (red – diagonal cross) and 10 mg/mL (black – cross line) concentrations. The spectra is shown in Log I(q) versus
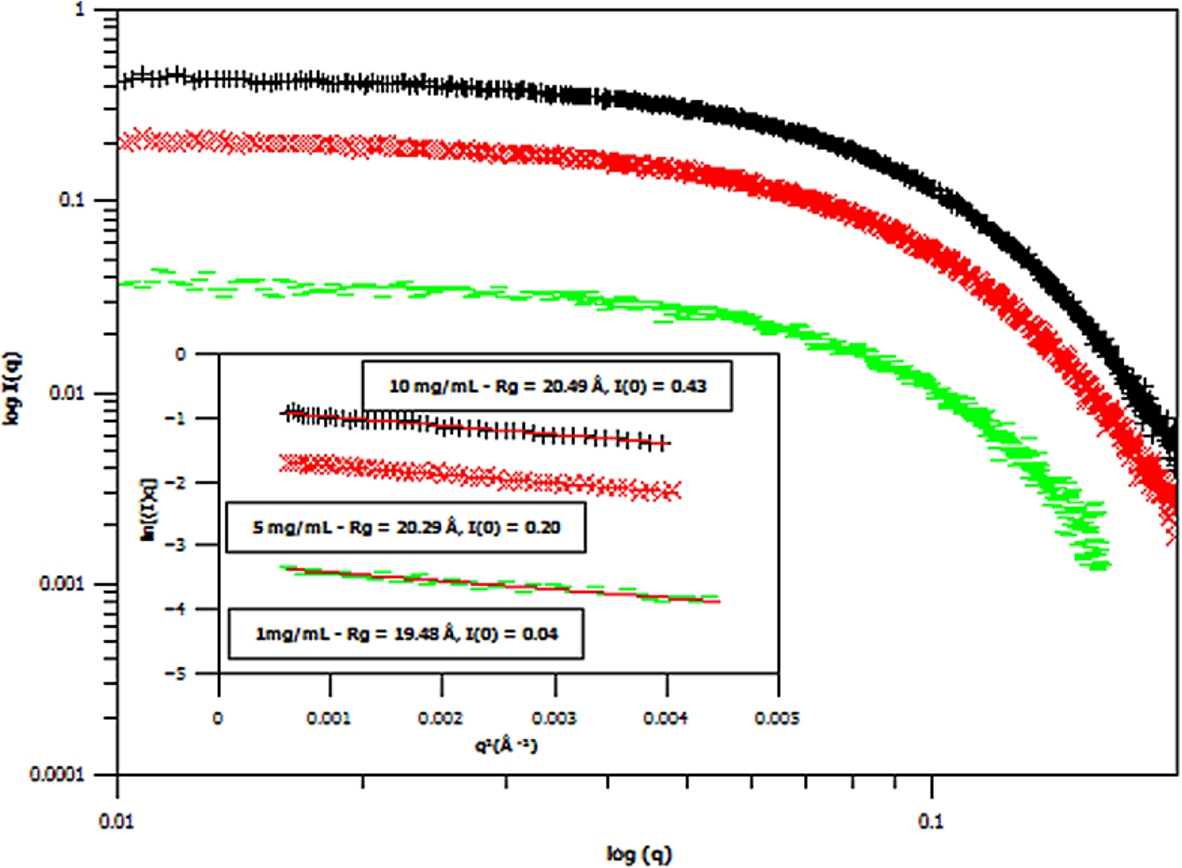
Fig. 6.
Small angle neutron scattering (SANS) curves of three different concentrations of deuterated m-GFP in hydrogenous buffer, at 1 mg/mL (green – diamond), 5 mg/mL (red – square) and 10 mg/mL (black – ellipse) concentrations. The spectra is shown in
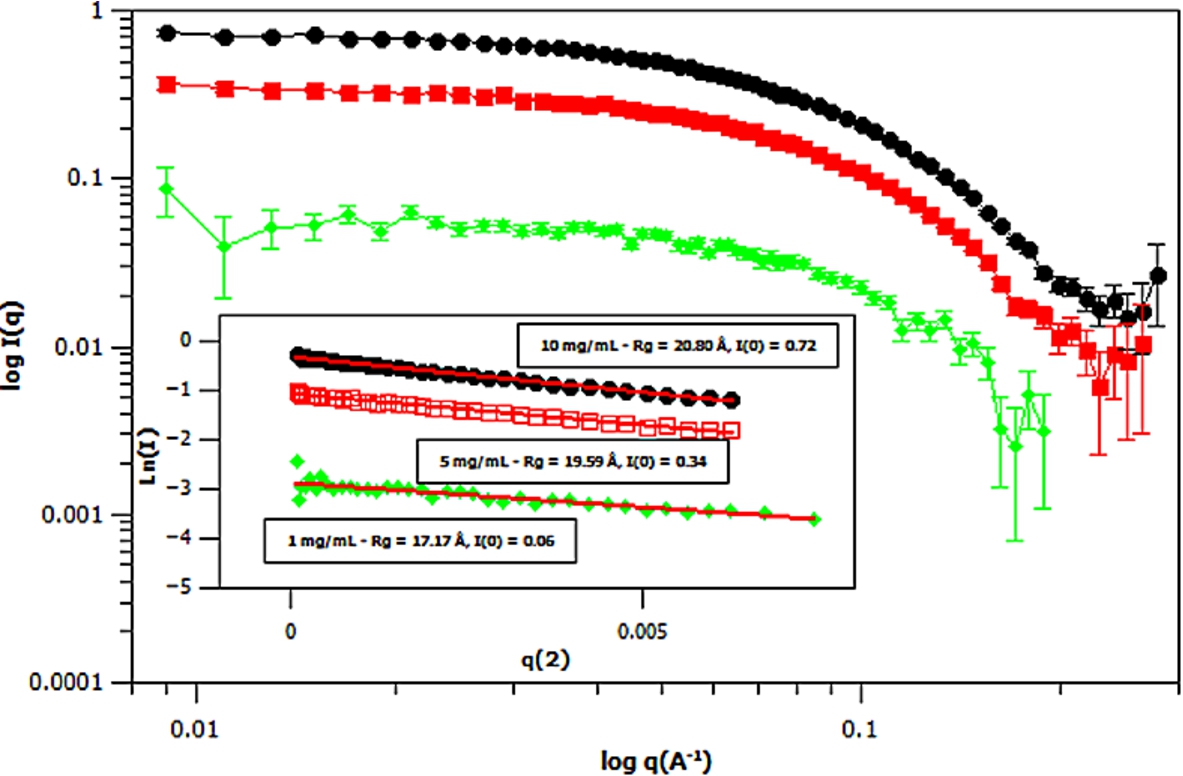
Three concentrations of m-eGFP were then run in the SAXS and SANS experiment to determine the intensity at zero angle I(0) and radius of gyration (Rg) of m-eGFP (for the results see in Figs 5 and 6 and Supplementary Material Table 2). From the three concentrations in both SAXS and SANS we get consistent radius of gyrations (Rg) within a 95% confidence level. For SAXS (see Fig. 5), hydrogenous protein samples in hydrogenous buffer, gave radius of gyrations (Rg’s) of 19.48, 20.29 and 20.49 Å (to 2 d.p) for 1, 5 and 10 mg/ml concentrations, respectively. Whilst for SANS (see Fig. 5), deuterated protein samples in hydrogenous buffer, gave radius of gyrations (Rg’s) of 17.17, 19.59 and 20.80 Å (to 2 d.p) for 1, 5 and 10 mg/mL, repectively. Both the techniques, as expected, are in good agreement, with the 1 mg/mL value for SAXS and particularly SANS values showing the largest standard deviation away from the mean. The increased noise in SAXS and SANS data at 1 mg/ml was due to a lower concentration. All of the radius of gyration values are also in good agreement with the CRYSOL [37] model value of 16.98 Å for the smaller crystal GFP structure (Pdb: 1EMA) without the N- and C-terminal tails [14]. Intensity at zero angle I(0) values were also calculated for both techniques. These values are dependant on a number of parameters including the sample concentration and buffer content (i.e D2O percentage for SANS). As expected, the values increased concomitantly with concentration, both in SAXS and SANS. For SAXS (see Fig. 5), a hydrogenous protein sample in hydrogenous buffer gave zero angle intensity I(0) values of 0.04, 0.20 and
Fig. 7.
The distance distribution plot (
![The distance distribution plot (P(r)−r) of m-eGFP taken using the SAXS (black – cross), SANS (red – diagonal cross) and the 1EMA theoretical crystal structure (green – flat line) distance distribution. Distance distribution performed using the 10 mg/mL m-eGFP data shown in Figs 5 and 6 and theoretical crystal structure (Pdb: 1EMA) calculated using Crysol [37].](https://ip.ios.semcs.net:443/media/bsi/2017/6-3-4/bsi-6-3-4-bsi167/bsi-6-bsi167-g007.jpg)
A distance distribution function (P(r)) analysis using the 10 mg/mL SAXS and SANS m-eGFP data was then performed (see Fig. 7). Distance distribution provides a number of complimentary parameters to the Guinier analysis. As well as radius of gyration (Rg) and intensity at zero angle I(0), other important values such as the particles maximum diameter (Dmax) and particle shape are also determined [4]. The distance distribution analysis (P(r)) is indicative of a globular protein of length
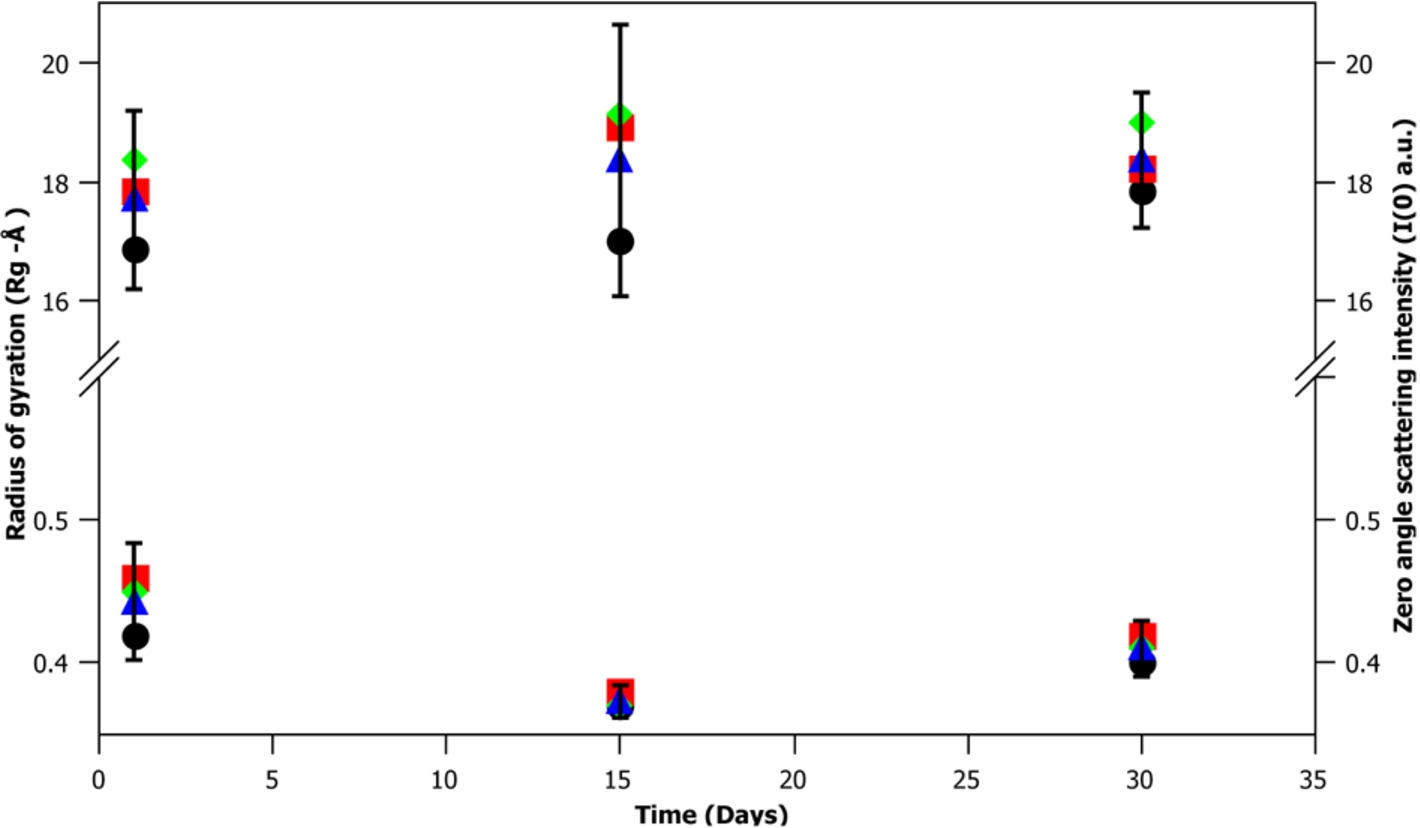
A key factor in developing a new biological small angle scattering standard is the particles stability over time. To test m-eGFP’s stability, SANS data was taken for a hydrogenous m-eGFP protein sample in deuterated buffer over 1, 15 and 30 days at three concentrations (1, 5 and 10 mg/mL). A Guinier analysis of the data was then performed to determine any changes in the zero angle intensity I(0) and radius of gyration (Rg) at each concentration and time point. The results of this analysis (see Fig. 8 and Supplementary Material Table 3) give the average radius of gyration (Rg) and intensity at zero angle (I(0)) value of the 9 spectra (3 different time points (1, 15 and 30 days) at 3 concentrations (1, 5 and 10 mg/mL)). The average radius of gyration (Rg)
Fig. 8.
A time-course at 1, 15 and 30 days of a sample of hydrogenous m-eGFP in D2O buffer, showing the radius of gyration (Rg) (top) and intensity at zero angle (I(0)) (bottom) of the three different concentrations of m-eGFP (1, 5 and 10 mg/mL). The cross-points of 1, 5 and 10 mg/mL are denoted by a black ellipse, red square and green diamond, whilst the mean average of the three concentrations is denoted by a blue triangle. The error bars denote the 95% confidence interval (1.96 σ – standard deviation of a standard statistical distribution).
4.Conclusions
After the biophysical characterisation shown here, we believe that m-eGFP has all the key characteristics required for use as a protein standard in small angle scattering experiments. Specifically it is easy to obtain, expresses in large amounts in hydrogenous and deuterated media, is highly monodisperse, has high stability over time and also hands storage well. M-eGFP’s fluorescent nature also allows for easy concentration determination. We believe the development of m-eGFP as a SAS protein standard is timely, with SAS data becoming increasingly important in structural biology and recent calls for more standardisation of biological SAS data [40–42].
Acknowledgements
The authors wish to thank Prof. Cameron Neylon for providing the e-GFP plasmid (Curtin University), Dr Joanne Nettleship (OPPF, Research Complex at Harwell) for running the mass spectrometer sample and Dr Richard Heenan (ISIS Neutron and Muon Source, UK) for discussion on the calculation of theoretical protein zero angle intensity values for biomolecules. The m-eGFP plasmid construct is available upon request to ISIS Neutron and Muon Source (Oxford, UK).
Declarations of interest
The authors declare that they have are no competing interests with the manuscript.
Funding information
Funding was provided in-house for the relevant consumables and beamtime to DPM as Biological Research Scientist at ISIS Neutron and Muon Source (Oxford, UK).
References
[1] | M.A. Graewert and D.I. Svergun, Impact and progress in small and wide angle X-ray scattering (SAXS and WAXS), Current Opinion in Structural Biology 23: ((2013) ), 748–754. doi:10.1016/j.sbi.2013.06.007. |
[2] | C.M. Jeffries et al., Preparing monodisperse macromolecular samples for successful biological small-angle X-ray and neutron-scattering experiments, Nature Protocols 11: ((2016) ), 2122–2153. doi:10.1038/nprot.2016.113. |
[3] | E. Mylonas and D.I. Svergun, Accuracy of molecular mass determination of proteins in solution by small-angle X-ray scattering, Journal of Applied Crystallography 40: ((2007) ), s245–s249. doi:10.1107/S002188980700252X. |
[4] | D.I. Svergun et al., Small Angle X-Ray and Neutron Scattering from Solutions of Biological Macromolecules, 1st edn, Oxford University Press, Oxford, (2013) . |
[5] | M. Kozak, Glucose isomerase from Streptomyces rubiginosus – Potential molecular weight standard for small-angle X-ray scattering, Journal of Applied Crystallography 38: ((2005) ), 555–558. doi:10.1107/S0021889805010472. |
[6] | M. Hammel et al., Solution structure of human and bovine β2-glycoprotein I revealed by small-angle X-ray scattering, Journal of Molecular Biology 321: ((2002) ), 85–97. doi:10.1016/S0022-2836(02)00621-6. |
[7] | D. Orthaber et al., SAXS experiments on absolute scale with Kratky systems using water as a secondary standard, Journal of Applied Crystallography 33: ((2000) ), 218–225. doi:10.1107/S0021889899015216. |
[8] | S. Akiyama, Quality control of protein standards for molecular mass determinations by small-angle X-ray scattering, Journal of Applied Crystallography 43: ((2010) ), 237–243. doi:10.1107/S002188981000138X. |
[9] | S. Skou et al., Synchrotron-based small-angle X-ray scattering of proteins in solution, Nature Protocols 9: ((2014) ), 1727–1739. doi:10.1038/nprot.2014.116. |
[10] | A. Guinier, La diffraction des rayons X aux très petits angles: application à l’étude de phénomènes ultramicroscopiques, Annales de Physique 11: ((1939) ), 161–237. doi:10.1051/anphys/193911120161. |
[11] | S.M. Vaiana et al., Irreversible formation of intermediate BSA oligomers requires and induces conformational changes, Proteins: Structure, Function, and Bioinformatics 55: ((2004) ), 1053–1062. doi:10.1002/prot.20074. |
[12] | Y. Cho, J.S. Yang and K.B. Song, Effect of ascorbic acid and protein concentration on the molecular weight profile of bovine serum albumin and β-lactoglobulin by γ-irradiation, Food Research International 32: ((1999) ), 515–519. doi:10.1016/S0963-9969(99)00127-1. |
[13] | H.L. Carrell et al., Modes of binding substrates and their analogues to the enzyme D-xylose isomerase, Acta Crystallographica Section D Biological Crystallography 50: ((1994) ), 113–123. doi:10.1107/S0907444993009345. |
[14] | M. Orm et al., Crystal structure of the Aequorea victoria green fluorescent protein, Science 273: ((1996) ), 1392–1395. doi:10.1126/science.273.5280.1392. |
[15] | F. Yang et al., The molecular structure of green fluorescent protein, Nature Biotechnology 14: ((1996) ), 1246–1251. doi:10.1038/nbt1096-1246. |
[16] | R.Y. Tsien, The green fluorescent protein, Annual Review of Biochemistry 67: ((1998) ), 509–544. doi:10.1146/annurev.biochem.67.1.509. |
[17] | M. Chalfie and S. Kain, Green Fluorescent Protein: Properties, Applications, and Protocols, Wiley–Interscience, Hoboken, N.J., (2006) . |
[18] | B.P. Cormack et al., FACS-optimized mutants of the green fluorescent protein (GFP), Gene 173: ((1996) ), 33–38. doi:10.1016/0378-1119(95)00685-0. |
[19] | T.-T. Yang et al., Optimized codon usage and chromophore mutations provide enhanced sensitivity with the green fluorescent protein, Nucleic Acids Research 24: ((1996) ), 4592–4593. doi:10.1093/nar/24.22.4592. |
[20] | G.N. Phillips, Structure and dynamics of green fluorescent protein, Curr. Opin. Struct. Biol. 7: ((1997) ), 821–827. doi:10.1016/S0959-440X(97)80153-4. |
[21] | D.A. Zacharias, Partitioning of lipid-modified monomeric GFPs into membrane microdomains of live cells, Science 296: ((2002) ), 913–916. doi:10.1126/science.1068539. |
[22] | D. von Stetten et al., Structure of a fluorescent protein from Aequorea victoria bearing the obligate-monomer mutation A206K, Acta Crystallographica Section F Structural Biology and Crystallization Communications 68: ((2012) ), 878–882. doi:10.1107/S1744309112028667. |
[23] | G. Giraudi et al., Inaccuracy of the Bradford method for the determination of protein concentration in steroid-horseradish peroxidase conjugates, Analytica Chimica Acta 337: ((1997) ), 93–97. doi:10.1016/S0003-2670(96)00388-1. |
[24] | C.V. Sapan et al., Colorimetric protein assay techniques, Biotechnol. Appl. Biochem. 29: (Pt. 2) ((1999) ), 99–108. |
[25] | J. Dam and P. Schuck, Calculating sedimentation coefficient distributions by direct modeling of sedimentation velocity concentration profiles, Meth. Enzymol. 384: ((2004) ), 185–212. doi:10.1016/S0076-6879(04)84012-6. |
[26] | A. Ortega et al., Prediction of hydrodynamic and other solution properties of rigid proteins from atomic- and residue-level models, Biophysical Journal 101: ((2011) ), 892–898. doi:10.1016/j.bpj.2011.06.046. |
[27] | Diamond Light Source Ltd. Annual Review 2015/16, n.d. Available at: http://www.diamond.ac.uk/Home/Corporate-Literature/Annual-Review/Review2016.html. |
[28] | M. Basham et al., Data analysis WorkbeNch (DAWN), Journal of Synchrotron Radiation 22: ((2015) ), 853–858. doi:10.1107/S1600577515002283. |
[29] | R.K. Heenan et al., SANS at pulsed neutron sources: Present and future prospects, Journal of Applied Crystallography 30: ((1997) ), 1140–1147. doi:10.1107/S0021889897002173. |
[30] | R.K. Heenan, S.M. King, D.S. Turner and J.R. Treadgold, SANS2D at the ISIS second target station, in: Proc. ICANS – XVII, 780–785, (2006) . |
[31] | F. Akeroyd et al., Mantid: Manipulation and Analysis Toolkit for Instrument Data, 2013. doi:10.5286/SOFTWARE/MANTID. |
[32] | D.I. Svergun, Determination of the regularization parameter in indirect-transform methods using perceptual criteria, Journal of Applied Crystallography 25: ((1992) ), 495–503. doi:10.1107/S0021889892001663. |
[33] | M.V. Petoukhov et al., ATSAS 2.1 – Towards automated and web-supported small-angle scattering data analysis, Journal of Applied Crystallography 40: ((2007) ), s223–s228. doi:10.1107/S0021889807002853. |
[34] | M.V. Petoukhov et al., New developments in the ATSAS program package for small-angle scattering data analysis, Journal of Applied Crystallography 45: ((2012) ), 342–350. doi:10.1107/S0021889812007662. |
[35] | P.V. Konarev et al., PRIMUS: A Windows PC-based system for small-angle scattering data analysis, Journal of Applied Crystallography 36: ((2003) ), 1277–1282. doi:10.1107/S0021889803012779. |
[36] | D.I. Svergun and M.H.J. Koch, Small-angle scattering studies of biological macromolecules in solution, Reports on Progress in Physics 66: ((2003) ), 1735–1782. doi:10.1088/0034-4885/66/10/R05. |
[37] | D. Svergun et al., CRYSOL – A program to evaluate X-ray solution scattering of biological macromolecules from atomic coordinates, Journal of Applied Crystallography 28: ((1995) ), 768–773. doi:10.1107/S0021889895007047. |
[38] | P. Schuck, Basic Principles of Analytical Ultracentrifugation, CRC Press, Taylor & Francis Group, Boca Raton, (2016) . |
[39] | D.P. Myatt, Biological Scattering Tools, 2013. Available at: http://psldc.isis.rl.ac.uk/. |
[40] | D.A. Jacques and J. Trewhella, Small-angle scattering for structural biology – Expanding the frontier while avoiding the pitfalls, Protein Science 19: ((2010) ), 642–657. doi:10.1002/pro.351. |
[41] | D.A. Jacques et al., Publication guidelines for structural modelling of small-angle scattering data from biomolecules in solution, Acta Crystallographica Section D Biological Crystallography 68: ((2012) ), 620–626. doi:10.1107/S0907444912012073. |
[42] | UK Neutron and Muon Science and User Meeting, Biology user notes, 2015. Available at: http://www.isis.stfc.ac.uk/news-and-events/uk-neutron-and-muon-science-and-user-meeting-19--21-may-201515286.html. |


