
Stroke onset time determination using MRI relaxation times without non-ischaemic reference in a rat stroke model
Abstract
Background:
Objective timing of stroke in emergency departments is expected to improve patient stratification. Magnetic resonance imaging (MRI) relaxations times,
Methods:
Both ‘non-ischaemic reference’-dependent and -independent estimators were generated. Apparent diffusion coefficient (ADC),
Result:
The reference-independent estimators from
Conclusions:
A ‘non-ischaemic anatomical reference’-independent estimator for stroke onset time from relaxometric MRI data is shown to yield greater timing precision than previously obtained through reference-dependent procedures.
1.Introduction
The current pharmacological treatments of an ischaemic stroke, including recombinant plasminogen activator, can only be administered within strict time limits [6]. This is due to two key reasons, as (i) irreversible damage to brain parenchyma advances with time [26] and (ii) the benefits of pharmacotherapy are outweighed by adverse effects [4]. Estimates of the number of neural cells and functionality lost per minute of ischaemia [21] stress the earliest possible administration of thrombolytic and/or anti-ischaemic therapy. Thus, stroke duration is seen as a crucial proxy of both brain state and a predictor of functional recovery, and consequently will play a pivotal role in the objective determination of onset time in the clinical settings.
A growing body of evidence indicates magnetic resonance imaging (MRI) protocols provide clinically acceptable timing of stroke onset [9,20,27,29]. The difference between MRI relaxation times
The key difficulty in the application of MRI relaxation times in stroke timing clinically is that it is difficult to know the baseline value at each voxel of the ischaemic lesion before the onset of ischaemia, such that the deviation from baseline due to ischaemia cannot be calculated with certainty. For this reason, some authors have sought to select a set of non-ischaemic voxels as a ‘reference’ region, representative of the lesion prior to the onset of ischaemia [27]. However, this approach is confounded by the inherently varying MRI relaxation times across the brain [30], such that the ‘reference’ voxels may not faithfully represent those of the lesion prior to the onset of ischaemia. Given that the distribution of relaxation times in the human brain is broader than the change caused by ischaemia, the challenge of selecting an appropriate set of reference voxels, and the consequences of failing to do so, have presented a major barrier.
Motivated by these factors, we present here a mathematical procedure for ‘non-ischaemic reference’-independent stroke time estimation. Relaxometric MRI data from permanent focal ischaemia in rats was used to assess the capability of the mathematical model for timing of stroke onset.
2.Methods
2.1.Animal model
Male Wistar rats (
2.2.Image acquisition
MRI data were acquired according to the methods described by Jokivarsi et al. [9]. The trace of the diffusion tensor (
2.3.Image processing
All image post-processing was performed using in-house designed software written in the MATLAB programming environment (MathWorks, Natick, Massachusetts, USA).
Lesion detection was performed on reciprocal ADC images where regions of hyperintensity are suggestive of an ischaemic assault. More formally, we have defined a lesion as the largest connected cluster of voxels whose values all exceed one median absolute deviation above the whole brain median value [13]. The output from the detection procedure was a binary mask, where ischaemic voxels were flagged with the value of one and all others set to zero.
2.4.Statistical models for estimating onset time
At present, the state-of-the-art estimators for time from stroke onset are based upon measuring
One of the primary disadvantages associated with these estimators is the arbitrary choice of the reference region, which if not chosen appropriately, in terms of the anatomical and/or tissue type match with respect to the ischaemic lesion, can dramatically affect their reliability. Furthermore, their robustness is governed by the ability to accurately estimate the mean
Motivated by the disadvantages mentioned above, we have explored the idea of designing robust reference-independent estimators that exploit information from the full empirical distribution of the
2.5.Distributional models for MR parameters
Appropriate parametric statistical models for
2.6.Training and testing of estimators
As with the state-of-the-art, our estimators were chosen to take the form of a multiple linear regression. Here, it is important to note that the assumption of linearity applies only to the coefficients of the estimators and does not necessarily imply that MR parameters vary linearly in time.
To mitigate the possibility of over-fitting we used a leave-one-out cross-validation approach to split the data used to train and to test the estimators. Precisely, our dataset of 8 rats (total of 45 sets of relaxometric data) was iteratively separated into a training set consisting of the scans of 7 rats, and a testing set consisting of the scans of the remaining rat. For each
To serve as a comparison, we also computed linear regressions based on
3.Results
3.1.Lesion detection
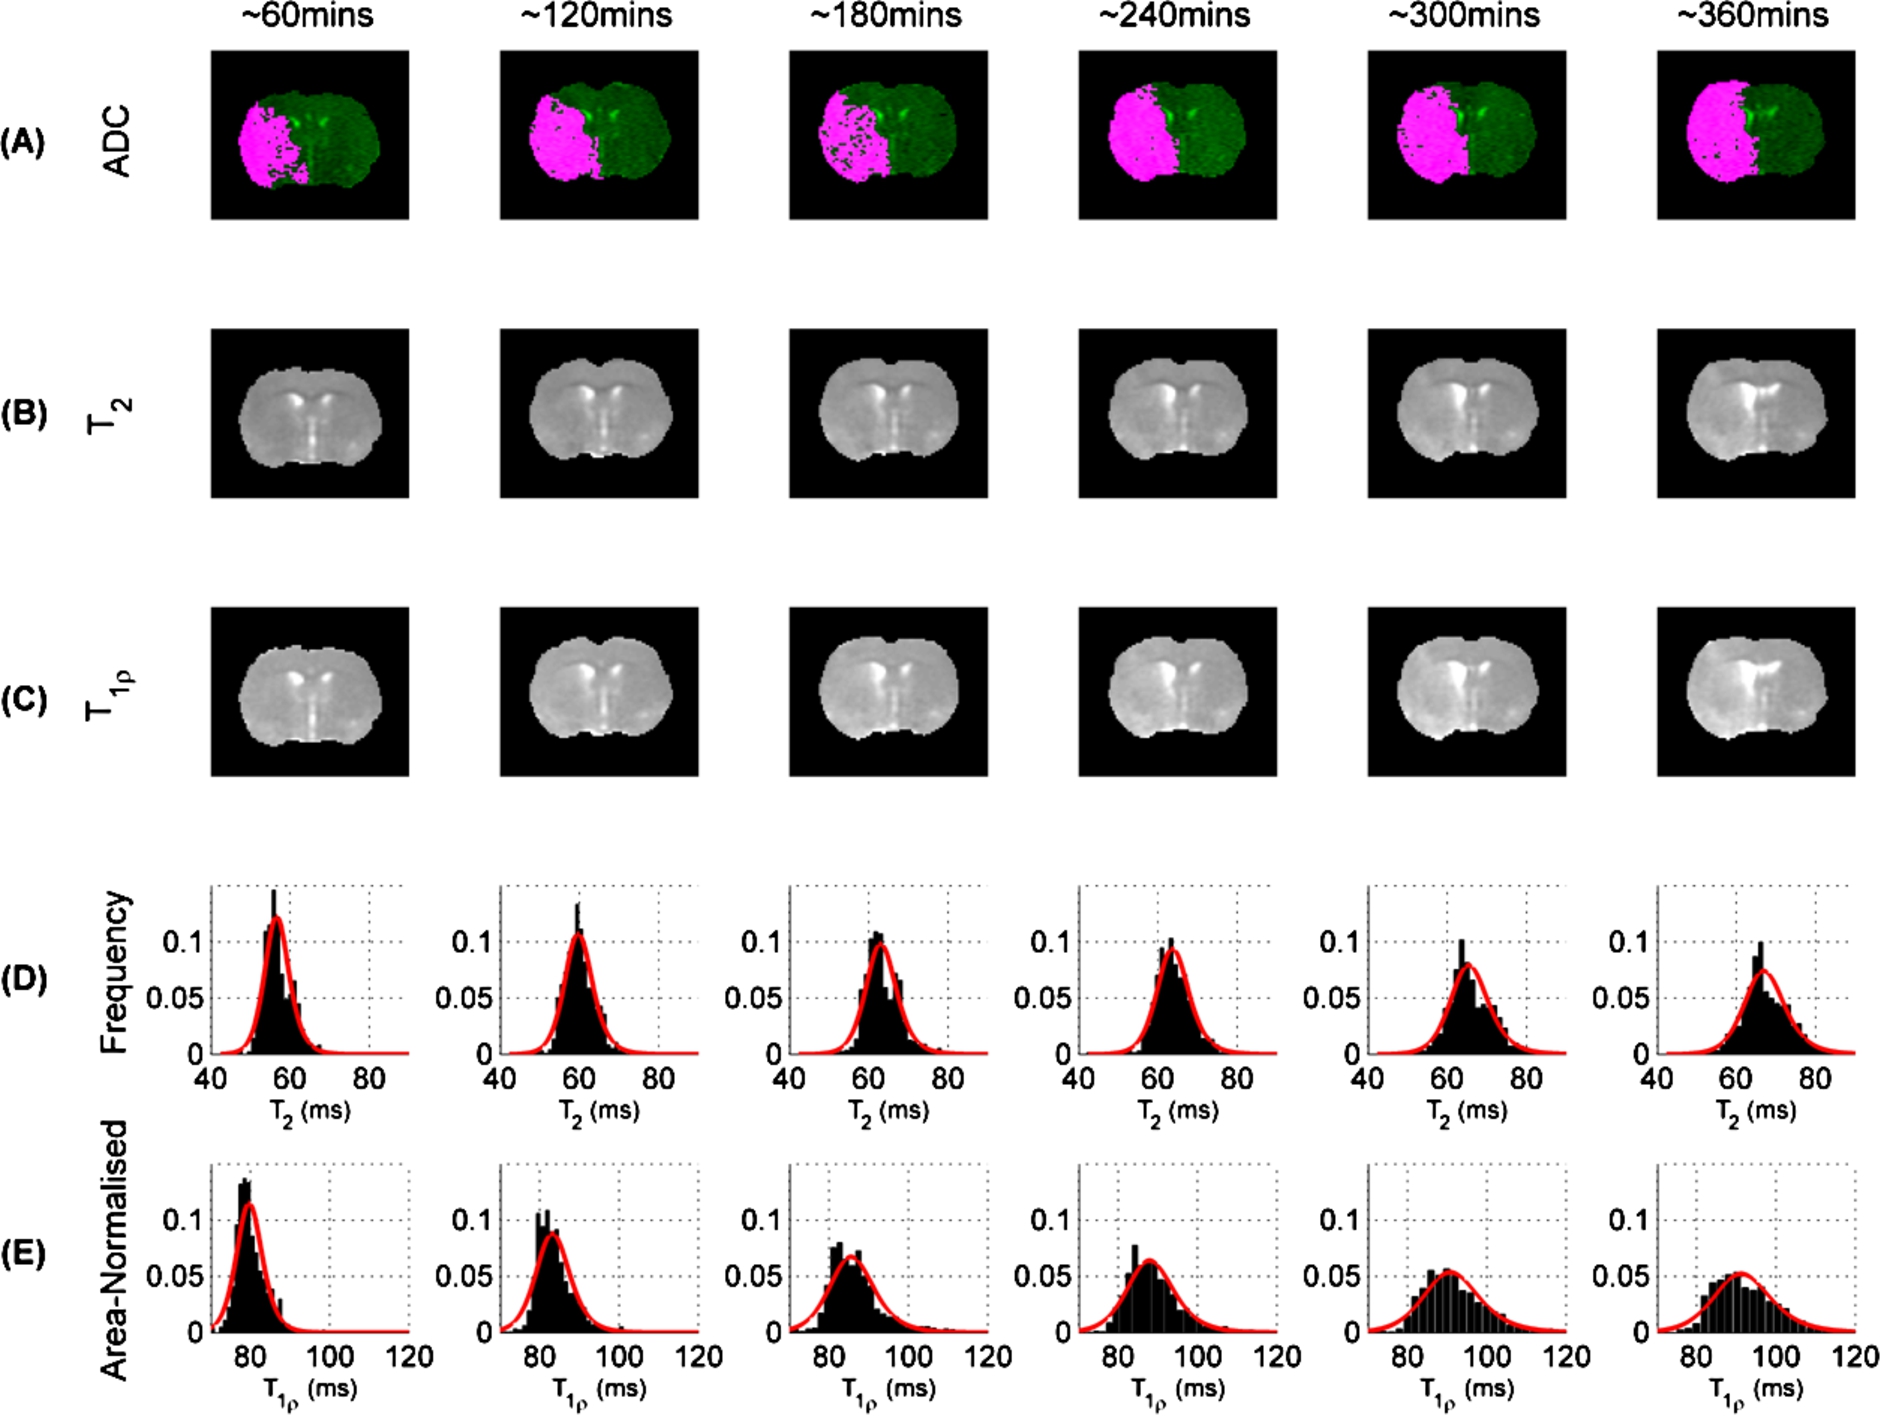
ADC images, including lesion mask overlays, from a typical rat brain acquired over multiple time-points are given in Figure 1(A). As indicated in the images, the lesion masks form a single contiguous region and their volumes generally increase from time of stroke onset reaching
Fig. 1.
(A) ADC images (green) with lesion masks (pink), (B)
3.2.Statistical models for MR parameters
Histograms are given for
As mentioned earlier, in order to identify a low-dimensional representation of the empirical distribution, several statistical distributions were fitted to the data. Namely, the normal, lognormal, log-logistic [5] and scaled Burr distributions [1]. Of these models the 2-parameter log-logistic distribution, i.e.
The log-logistic model was also found to be suitable for describing the distributions of
3.3.Regression estimators
The anatomical reference-independent regression estimators were designed using (functions of) the parameters associated with the log-logistic fits, i.e. the μ and σ parameters. For the
Fig. 2.
Estimated time vs. actual time of onset for several regression estimators. (A) Reference-dependent
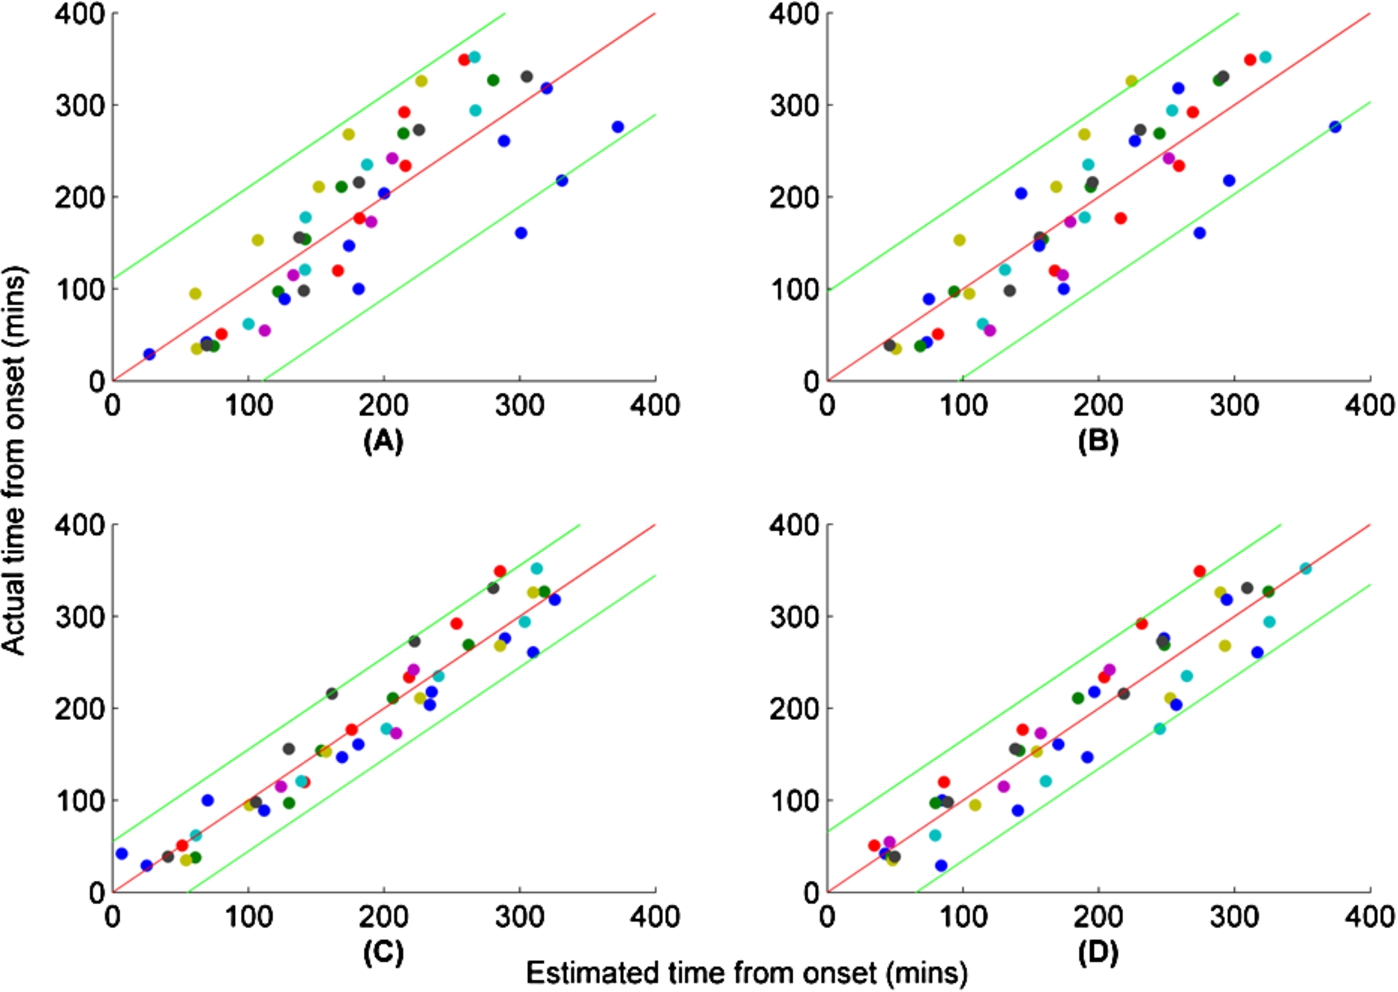
For the
Figures 2(C) and (D) show the fits for the
In addition to measuring the precision of reference-dependent estimators, we investigated their robustness through consideration of randomly-shifted reference regions (Supplementary Information, Figure S2 and S3). The results showed that overall precision is sensitive to reference placement, with RMSEs often larger than those reported for the mirrored contra-lateral reference.
Table 1
Interval-wise breakdown of estimated vs. actual onset times. Values are displayed as mean ± SD. 95% confidence intervals for estimated means were computed from
| Timing (mins) | Parameters | Estimation (mins) | |||
| Interval | Mean time | 95% CI | |||
| 000–060 ( | 41.3 ± 8.4 | 50.3 ± 14.5 | 37–63 | ||
| 060–120 ( | 97.0 ± 16.4 | 99.7 ± 22.4 | 81–118 | ||
| 120–180 ( | 157.8 ± 16.8 | 166.9 ± 31.6 | 143–191 | ||
| 180–240 ( | 218.4 ± 11.0 | 225.5 ± 30.0 | 199–252 | ||
| 240–300 ( | 271.9 ± 15.6 | 264.7 ± 39.4 | 233–297 | ||
| 300–360 ( | 333.8 ± 12.4 | 307.4 ± 25.6 | 282–333 | ||
| Timing (mins) | Parameters | Estimation (mins) | |||
| Interval | Mean time | 95% CI | |||
| 000–060 ( | 41.9 ± 10.4 | 37.5 ± 22.6 | 23–60 | ||
| 060–120 ( | 102.4 ± 11.6 | 115.3 ± 22.1 | 84–120 | ||
| 120–180 ( | 160.4 ± 11.2 | 172.2 ± 24.2 | 141–180 | ||
| 180–240 ( | 219.4 ± 12.9 | 218.0 ± 23.5 | 200–239 | ||
| 240–300 ( | 274.1 ± 11.5 | 275.2 ± 28.6 | 249–300 | ||
| 300–360 ( | 331.8 ± 12.4 | 305.3 ± 16.6 | 315–348 | ||
| Timing (mins) | Parameters | Estimation (mins) | ||
| Interval | Mean time | 95% CI | ||
| 000–060 ( | 41.3 ± 8.4 | −2.92 ± 1.71 | 59.0 ± 41.6 | 22–96 |
| 060–120 ( | 97.0 ± 16.4 | −0.02 ± 1.49 | 129.6 ± 36.3 | 100–159 |
| 120–180 ( | 157.8 ± 16.8 | 1.77 ± 1.97 | 173.1 ± 47.9 | 137–209 |
| 180–240 ( | 218.4 ± 11.0 | 3.16 ± 2.01 | 206.8 ± 48.9 | 163–251 |
| 240–300 ( | 271.9 ± 15.6 | 5.14 ± 2.07 | 255.0 ± 50.3 | 214–296 |
| 300–360 ( | 333.8 ± 12.4 | 6.29 ± 1.36 | 282.8 ± 33.0 | 250–316 |
| Timing (mins) | Parameters | Estimation (mins) | ||
| Interval | Mean time | 95% CI | ||
| 000–060 ( | 41.9 ± 10.4 | 2.17 ± 1.28 | 74.3 ± 23.9 | 55–94 |
| 060–120 ( | 102.4 ± 11.6 | 5.38 ± 1.79 | 134.1 ± 33.3 | 107–161 |
| 120–180 ( | 160.4 ± 11.2 | 7.42 ± 2.96 | 172.1 ± 55.1 | 127–217 |
| 180–240 ( | 219.4 ± 12.9 | 9.21 ± 2.76 | 205.4 ± 51.3 | 164–247 |
| 240–300 ( | 274.1 ± 11.5 | 11.66 ± 3.25 | 251.0 ± 60.4 | 197–305 |
| 300–360 ( | 331.8 ± 12.4 | 13.03 ± 1.63 | 276.4 ± 30.3 | 246–307 |
Estimators based on
4.Discussion
The current study has established a stroke onset timing procedure using quantitative relaxometric MRI data only from the ischaemic lesion delineated by low ADC. The use of low ADC for selection of tissue for relaxometric data assures that only ischaemic volumes [7] are used for timing. Low ADC eliminates non-ischaemic regions from timing analyses, because reperfusion in the early hours of ischaemia normalises ADC [11,16]. It should be noted that quantitative ADC alone provides no time information [15], neither does the rate at which ADC lesion expands [13] in the early hours of ischaemia in permanent MCAO. This ‘anatomical reference-independent’ procedure performs better in timing than the one using MRI data from a non-ischaemic reference region. As the quantitative
The current
The stroke time estimators introduced in this paper use only the
Regarding the utility of the current time estimator in stroke imaging, several points should be considered. Firstly, while both
5.Conclusions
The current study indicates that relaxometric MRI data may provide stroke time estimators without the need for non-ischaemic reference data. Critical issues in the clinical implementation of such protocols include both scan time and data post-processing. A recent study demonstrated a comprehensive stroke MRI protocol can be acquired in six minutes [24]. Investigational MRI scan procedures, such as magnetic resonance finger printing [18], have been shown to further shorten scan times, thus paving the way for expedited clinical brain examination. As far as the post-processing is concerned, the current standard computers are capable of analysing MRI data sets in seconds. Overall, quantitative MRI-based stroke timing taking minutes is likely to become reality for clinical exploitation in the near future.
Acknowledgements
The expert technical assistance by Ms Maarit Pulkkinen is greatly acknowledged. MP holds a Marie Curie Intra-European Fellowship for Career Development. BLM is a recipient of EPSRC PhD studentship. MJK is funded by Elizabeth Blackwell Institute Early Career Fellowship and by the Wellcome Trust international strategic support fund ISSF2: 105612/Z/14/Z. KTJ and OHJG are funded by Academy of Finland, Finnish Technology Funding (TEKES) and Biocenter Finland. RAK and MP are funded by the Dunhill Medical Trust.
References
[1] | I.W. Burr, Cumulative frequency functions, Ann Math Sci. 13: ((1942) ), 215–232. |
[2] | A.L. Busza, K.L. Allen, M.D. King, N. van Bruggen, S.R. Williams and D.G. Gadian, Diffusion-weighted imaging studies of cerebral ischemia in gerbils. Potential relevance to energy failure, Stroke. 23: ((1992) ), 1602–1612. doi:10.1161/01.STR.23.11.1602. |
[3] | B. Cheng, M. Brinkmann, N.D. Forkert, A. Treszl, M. Ebinger, M. Kohrmann, O. Wu, D.W. Kang, D.S. Liebeskind, T. Tourdias, O.C. Singer, S. Christensen, M. Luby, S. Warach, J. Fiehler, J.B. Fiebach, C. Gerloff, G. Thomalla and Stir, and V. I. Investigators, Quantitative measurements of relative fluid-attenuated inversion recovery (FLAIR) signal intensities in acute stroke for the prediction of time from symptom onset, J Cereb Blood Flow Metab. 33: ((2013) ), 76–84. doi:10.1038/jcbfm.2012.129. |
[4] | J. Emberson, K.R. Lees, P. Lyden, L. Blackwell, G. Albers, E. Bluhmki, T. Brott, G. Cohen, S. Davis, G. Donnan, J. Grotta, G. Howard, M. Kaste, M. Koga, R. von Kummer, M. Lansberg, R.I. Lindley, G. Murray, J.M. Olivot, M. Parsons, B. Tilley, D. Toni, K. Toyoda, N. Wahlgren, J. Wardlaw, W. Whiteley, G.J. del Zoppo, C. Baigent, P. Sandercock, W. Hacke and G. Stroke Thrombolysis Trialists’ Collaborative, Effect of treatment delay, age, and stroke severity on the effects of intravenous thrombolysis with alteplase for acute ischaemic stroke: a meta-analysis of individual patient data from randomised trials, Lancet. 384: ((2014) ), 1929–1935. doi:10.1016/S0140-6736(14)60584-5. |
[5] | C. Forbes, M. Evans, N. Hastings and B. Peacock, Statistical Distributions, 4th edn, John Wiley & Sons, (2011) . |
[6] | W. Hacke, G. Donnan, C. Fieschi, M. Kaste, R. von Kummer, J.P. Broderick, T. Brott, M. Frankel, J.C. Grotta, E.C. Haley Jr., T. Kwiatkowski, S.R. Levine, C. Lewandowski, M. Lu, P. Lyden, J.R. Marler, S. Patel, B.C. Tilley, G. Albers, E. Bluhmki, M. Wilhelm and S. Hamilton, Association of outcome with early stroke treatment: Pooled analysis of ATLANTIS, ECASS, and NINDS rt-PA stroke trials, Lancet. 363: ((2004) ), 768–774. doi:10.1016/S0140-6736(04)15692-4. |
[7] | M. Hoehn-Berlage, D.G. Norris, K. Kohno, G. Mies, D. Leibfritz and K.A. Hossmann, Evolution of regional changes in apparent diffusion coefficient during focal ischemia of rat brain: The relationship of quantitative diffusion NMR imaging to reduction in cerebral blood flow and metabolic disturbances, J. Cereb. Blood Flow Metab. 15: ((1995) ), 1002–1011. doi:10.1038/jcbfm.1995.126. |
[8] | T. Jin, J. Autio, T. Obata and S.G. Kim, Spin-locking versus chemical exchange saturation transfer MRI for investigating chemical exchange process between water and labile metabolite protons, Magn Reson Med 65: ((2011) ), 1448–1460. |
[9] | K.T. Jokivarsi, Y. Hiltunen, H. Grohn, P.I. Tuunanen, O.H.J. Grohn and R.A. Kauppinen, Estimation of the onset time of cerebral ischemia using |
[10] | M.I. Kettunen, O.H. Grohn, M.J. Silvennoinen, M. Penttonen and R.A. Kauppinen, Effects of intracellular pH, blood, and tissue oxygen tension on T1rho relaxation in rat brain, Magn Reson Med. 48: ((2002) ), 470–477. doi:10.1002/mrm.10233. |
[11] | M.I. Kettunen, O.H.J. Gröhn, J.A. Lukkarinen, P. Vainio, M.J. Silvennoinen and R.A. Kauppinen, Interrelations of |
[12] | M.I. Kettunen, O.H.J. Gröhn, M.J. Silvennoinen, M. Penttonen and R.A. Kauppinen, Quantitative assessment of the balance between oxygen delivery and consumption in the rat brain after transient ischemia with |
[13] | M.J. Knight, B.L. McGarry, H.J. Rogers, K.T. Jokivarsi, O.H. Grohn and R.A. Kauppinen, A spatiotemporal theory for MRI T2 relaxation time and apparent diffusion coefficient in the brain during acute ischaemia: Application and validation in a rat acute stroke model, J Cereb Blood Flow Metab. 36: ((2016) ), 1232–1243. doi:10.1177/0271678X15608394. |
[14] | M.J. Knight, B. Wood, E. Coulthard and R.A. Kauppinen, Anisotropy of spin echo T2 relaxation in the human brain in vivo, Biomed Spectr Imag. 4: ((2015) ), 299–310. doi:10.3233/BSI-150114. |
[15] | R.A. Knight, M.O. Dereski, J.A. Helpern, R.J. Ordidge and M. Chopp, Magnetic resonance imaging assessment of evolving focal cerebral ischemia. Comparison with histopathology in rats, Stroke. 25: ((1994) ), 1252–1261. doi:10.1161/01.STR.25.6.1252. |
[16] | F. Li, S.S. Han, T. Tatlisumak, K.F. Liu, J.H. Garcia, C.H. Sotak and M. Fisher, Reversal of acute apparent diffusion coefficient abnormalities and delayed neuronal death following transient focal cerebral ischemia in rats, Ann Neurol. 46: ((1999) ), 333–342. doi:10.1002/1531-8249(199909)46:3<333::AID-ANA9>3.0.CO;2-X. |
[17] | E.Z. Longa, P.R. Weinstein, S. Carlson and R. Cummins, Reversible middle cerebral artery occlusion without craniectomy in rats, Stroke. 20: ((1989) ), 84–91. doi:10.1161/01.STR.20.1.84. |
[18] | D. Ma, V. Gulani, N. Seiberlich, K. Liu, J.L. Sunshine, J.L. Duerk and M.A. Griswold, Magnetic resonance fingerprinting, Nature. 495: ((2013) ), 187–192. doi:10.1038/nature11971. |
[19] | B.L. McGarry, H.J. Rogers, M.J. Knight, K. Jokivarsi, H. Grohn and R.A. Kauppinen, Determining stroke onset time using quantitative MRI: High accuracy, sensitivity and specificity obtained from magnetic resonance relaxation times, Cerebrovasc Dis Extra. 6: ((2016) ), 60–65. doi:10.1159/000448814. |
[20] | B.L. McGarry, H.J. Rogers, M.J. Knight, K.T. Jokivarsi, A. Sierra, O.H. Grohn and R.A. Kauppinen, Stroke onset time estimation from multispectral quantitative magnetic resonance imaging in a rat model of focal permanent cerebral ischemia, Int J Stroke ((2016) ), 677–682. doi:10.1177/1747493016641124. |
[21] | A. Meretoja, M. Keshtkaran, J.L. Saver, T. Tatlisumak, M.W. Parsons, M. Kaste, S.M. Davis, G.A. Donnan and L. Churilov, Stroke thrombolysis: Save a minute, save a day, Stroke. 45: ((2014) ), 1053–1058. doi:10.1161/STROKEAHA.113.002910. |
[22] | J.B. Miller, L.H. Merck, C.R. Wira, W.J. Meurer, J.W. Schrock, J.T. Nomura, M.S. Siket, T.E. Madsen, D.W. Wright, P.D. Panagos and C. Lewandowski, The advanced reperfusion era: Implications for emergency systems of ischemic stroke care. Ann Emerg Med ((2016) ), in press. doi:10.1016/j.annemergmed.2016.06.042. |
[23] | F. Mitsumori, H. Watanabe, N. Takaya, M. Garwood, E.J. Auerbach, S. Michaeli and S. Mangia, Toward understanding transverse relaxation in human brain through its field dependence, Magn Reson Med. 68: ((2012) ), 947–953. doi:10.1002/mrm.23301. |
[24] | K. Nael, R. Khan, G. Choudhary, A. Meshksar, P. Villablanca, J. Tay, K. Drake, B.M. Coull and C.S. Kidwell, Six-minute magnetic resonance imaging protocol for evaluation of acute ischemic stroke: Pushing the boundaries, Stroke. 45: ((2014) ), 1985–1991. doi:10.1161/STROKEAHA.114.005305. |
[25] | H.J. Rogers, B.L. McGarry, M.J. Knight, K.T. Jokivarsi, O.H.J. Grohn and R.A. Kauppinen, Timing the ischaemic stroke by |
[26] | J.L. Saver, Time is brain–quantified, Stroke. 37: ((2006) ), 263–266. doi:10.1161/01.STR.0000196957.55928.ab. |
[27] | S. Siemonsen, K. Mouridsen, B. Holst, T. Ries, J. Finsterbusch, G. Thomalla, L. Ostergaard and J. Fiehler, Quantitative t2 values predict time from symptom onset in acute stroke patients, Stroke. 40: ((2009) ), 1612–1626. doi:10.1161/STROKEAHA.108.542548. |
[28] | B.K. Siesjö, Mechanisms of ischemic brain damage, Crit. Care Med. 16: ((1988) ), 954–963. doi:10.1097/00003246-198810000-00006. |
[29] | G. Thomalla, B. Cheng, M. Ebinger, Q. Hao, T. Tourdias, O. Wu, J.S. Kim, L. Breuer, O.C. Singer, S. Warach, S. Christensen, A. Treszl, N.D. Forkert, I. Galinovic, M. Rosenkranz, T. Engelhorn, M. Kohrmann, M. Endres, D.W. Kang, V. Dousset, A.G. Sorensen, D.S. Liebeskind, J.B. Fiebach, J. Fiehler and C. Gerloff, DWI-FLAIR mismatch for the identification of patients with acute ischaemic stroke within 4.5 h of symptom onset (PRE-FLAIR): A multicentre observational study, Lancet Neurol. 10: ((2011) ), 978–986. doi:10.1016/S1474-4422(11)70192-2. |
[30] | J.P. Wansapura, S.K. Holland, R.S. Dunn and W.S. Ball Jr., NMR relaxation times in the human brain at 3.0 tesla, J Magn Reson Imaging. 9: ((1999) ), 531–538. doi:10.1002/(SICI)1522-2586(199904)9:4<531::AID-JMRI4>3.0.CO;2-L. |


