
An infrared spectroscopic blood test for non-small cell lung carcinoma and subtyping into pulmonary squamous cell carcinoma or adenocarcinoma
Abstract
Background:
Lung cancer is the leading cause of death for male and female cancer patients alike. Early diagnosis improves prognosis. A blood test would be a valuable support.
Objective:
Infrared spectroscopy provides a label-free biochemical fingerprint of a sample. A study was conducted on 161 patients with initial cancer suspicion to identify and verify spectral biomarker candidate patterns to detect non-small cell lung carcinoma (NSCLC).
Methods:
Blood serum and plasma samples were analysed with an automated FTIR spectroscopic system. Two pattern recognition algorithms and two classifiers were applied. Monte Carlo cross validation was performed with linear discriminant analysis and random forest classification.
Results:
Marker patterns for the discrimination of cancer from clinically relevant disease control patients were identified in FTIR spectra of blood samples. An accuracy of up to 79% was achieved. Squamous cell and adenocarcinoma patients were separable with an accuracy of 80%.
Conclusions:
The study demonstrates the applicability of FTIR spectroscopic blood testing for lung cancer detection. Evidence for cancer subtype discrimination is given. With an improved performance, the method could be developed as a routine diagnostic tool for blood testing detecting NSCLC.
Abbreviations
AC | adenocarcinoma |
airPLS | adaptive iteratively penalized least squares |
CTC | circulating tumour cells |
cfDNA | cell-free DNA |
DC | disease control |
DGUV | German Social Accident Insurance |
DPR | disease pattern recognition |
EDTA | ethylenediaminetetraacetic acid |
FTIR | Fourier-transform infrared |
KSCN | potassium iso-thiocyanate |
LDA | linear discriminant analysis |
MCCV | Monte Carlo cross validation |
MRMR | maximum relevance minimum redundancy feature selection |
NSCLC | non-small-cell lung cancer |
PCA | principal component analysis |
SCC | squamous cell carcinoma |
SOP | standard operation procedure |
1.Introduction
In industrial countries lung cancer is the leading cause of death, independent of gender [16]. Prognosis improves upon early detection and treatment. A range of early diagnosis and screening tools are established including bronchoscopy, chest X-ray, and computerized tomography [26]. Improvement is still necessary, as a low sensitivity and a high false-positive rate of >90% was reported for low-dose computerized tomography [1]. A simplification of the diagnostic procedures by a supplementary blood test could spare the patient exposure to radiation in a screening setting. Furthermore, such a test would be implementable into a routine health check-up, especially in high-risk persons as smokers with asbestos exposure. Thereby, the chance of an earlier detection of less advanced stages could increase, leading to an improved prognosis of the patient.
Diagnostic approaches targeting potential blood borne biomarkers have been described [7,12,24,29]. Thus, it is meaningful to expect a biochemical difference between blood samples of lung carcinoma and control patients. This is important for the presented approach. In contrast to the quantification of selected biomarker molecules, an FTIR spectroscopic analysis provides a cumulative fingerprinting signal of the biochemical sample status. Thereby, all infrared active molecules within a sample are detected, thereby represented quantitatively. Absorbance signals of lipids, sugars and nucleic acids are recorded along with protein signals. Thus, an integral signal of the lipidome, the metabolome, and the proteome is recorded. Using appropriate machine learning techniques, the sample can be classified into distinct groups. This has extensively been done on lung tissue samples [2,5,20], down to the sub-classification of adenocarcinoma subtypes [9].
In contrast to infrared tissue imaging, the analysis of body fluid samples is limited by internal statistics: whereas a tissue sample easily provides millions of spectra of discriminable regions within a single slice, one body fluid sample provides one single spectrum, representative of the patient status at the time of blood draw. Therefore, a dedicated statistical analysis of a larger participant number is required. Thereby, meaningful and disease associated band patterns are separated from those representing biological and technical variability. This process has been termed disease pattern recognition (DPR) [19], and is part of an emerging field of photonic biofluid diagnostics [3]. The technology may be ultimately useful to improve cancer detection by personalized analysis and minimally invasive sampling [11].
Although FTIR spectroscopic DPR analysis of body fluids could present an attractive auxiliary diagnostic method due to the minimally invasive sample acquisition, literature about the application for bronchial carcinoma detection is scarce. Lewis et al. report a possible spectral separability of lung cancer patients from healthy controls based on average absorbance spectra of cells isolated from sputum [14], but could not quantify the sensitivity and specificity. Wang et al. documented spectral differences of cells extracted from pleural fluid of lung cancer, control and tuberculosis patients [27], again without quantification. One study on blood serum of 24 lung cancer patients and 22 healthy controls reports a sensitivity of 83% and a specificity of 100% deduced from a test of 5 vs. 5 subjects [28].
Here, we report the application of a widely automated high-throughput FTIR-spectroscopic instrumentation, which has performed well in the detection of urinary bladder cancer from blood samples [21,22]. Now, the system was applied to the blood-based prediction of primary NSCLC from serum, EDTA- and citrate-stabilized blood plasma. The samples were collected from 161 suspected lung cancer patients. The samples are robotically prepared as dried thin films and analyzed with an automated FTIR spectrometer (Fig. 1). Using two feature selection algorithms, characteristic and discriminating band patterns were identified, which were then evaluated in repeat and randomized Monte Carlo cross validation (MCCV) schemes with two different classifiers. Disease control and squamous cell carcinoma (SCC) patients were separable with an accuracy of 73%, a sensitivity of 71%, and a specificity of 75%, whereas adenocarcinoma (AC) patients were separable from disease controls with an accuracy of 79%, a sensitivity of 77%, and a specificity of 80%. Surprisingly, spectral blood analysis is particularly capable of subtyping NSCLC: an accuracy of 80%, a sensitivity of 82%, and a specificity of 77% for the separation of SCC and adenocarcinoma AC patients was determined. Thereby, we demonstrate label-free FTIR DPR as a useful tool for lung cancer detection. The feasibility of the technique for at least coarse subtyping is shown.
Fig. 1.
Workflow of sample analysis (adapted from [21]). With each biofluid sample, four wells of a 384 well MTP were robotically coated with a thin film. The four absorbance spectra were corrected for spectral artefacts, outlier removed, averaged and normalized without user interaction. One representative absorbance spectrum of each sample was differentiated. Data were combined to synthetic sequentially arranged vectors of absorbance, 1st and 2nd derivative spectrum of serum, EDTA and citrate plasma. Classification relevant variables were identified and Monte Carlo cross validated based on the medical diagnosis.
![Workflow of sample analysis (adapted from [21]). With each biofluid sample, four wells of a 384 well MTP were robotically coated with a thin film. The four absorbance spectra were corrected for spectral artefacts, outlier removed, averaged and normalized without user interaction. One representative absorbance spectrum of each sample was differentiated. Data were combined to synthetic sequentially arranged vectors of absorbance, 1st and 2nd derivative spectrum of serum, EDTA and citrate plasma. Classification relevant variables were identified and Monte Carlo cross validated based on the medical diagnosis.](https://ip.ios.semcs.net:443/media/bsi/2016/5-2/bsi-5-2-bsi144/bsi-5-bsi144-g001.jpg)
2.Material and methods
2.1.Patient collective
In close collaboration between the Ruhrlandklinik, the Institute of Pathology, and the PURE institutes, strictly defined standard operating procedures (SOP) for tissue and blood sampling according to the rules of Good Epidemiological Practice were developed. Following these protocols, patients were fully informed about the study and gave their written consent. Epidemiologic data were collected along with blood samples among patients of the Ruhrlandklinik Essen from August 2013 to February 2015. Blood was processed to serum, EDTA-, and tri-sodium citrate stabilized plasma with clinical routine equipment (Sarstedt AG&Co., Nümbrecht, Germany) obeying strict SOPs. The samples were frozen within less than 60 min after sampling. All samples were stored at 80°C until experimental use. The established diagnosis of bronchoscopy and histopathology served as gold standard. This study complies with the applicable ethical guidelines and was approved by the Ethics Committee of the Ruhr-Universität Bochum (Ethics vote 13-5420-BO) and the Ethics Committee of the University Duisburg-Essen, Essen, Germany.
NSCLC was the most abundant class of malignant diseases of the entire study (81%). Squamous-cell carcinoma (SCC) and adenocarcinoma (AC) patients represented the most abundant subtypes of NSCLC (together 79%). Consequently, three most populated, most homogeneous patient classes were assembled: (i) a cancer-free disease control group without confirmed initial cancer suspicion (53 patients), (ii) 54 primary SCC patients and (iii) 54 patients suffering from primary AC (Table 1).
Table 1
Class-wise patient age and gender distribution. Given are patient numbers, average age and standard deviation
| Class | Male | Female | Total |
| Disease control | 30/66±12 | 23/59±13 | 53/63±13 |
| SCC | 40/67±8 | 14/69±9 | 54/68±8 |
| AC | 31/65±8 | 22/63±9 | 54/64±8 |
The first recruited 19 SCC patients and the first 34 AC patients were assembled to a general ‘lung carcinoma’ class (LC). The ratio equals the abundance of these NSCLC tumor subtypes in the performed study.
Patients were recruited successively upon admission into the hospital. Thus, the selection of the first patients of a group equals a random selection among the participants. A selection of equally powered groups was necessary to prevent classifier distortion [21,22].
The group of control patients reflects the collectives of patients with non malignant diseases of the thoracic cavity presenting to the Ruhrlandklinik Essen during recruitment. The group consisted of patients with pneumonia, pleuritis and other inflammatory changes (
Generally, patients with lipemic or hemolytic blood samples were excluded from the current analysis, as well as those with lung metastases of other tumors. Gender and age distributions were similar among the patient classes (Table 1). Tumor grading was matching well among the groups. Spectral differences of tobacco consumption within the patient groups (smoker/non-smoker/never smoker) were researched with the same pattern detection algorithms as described in 2.3–2.5, but not detected in the infrared spectra of blood samples. Therefore, confounding contributions of gender, age, tumor grading and tobacco consumption to the data are not expected. All patients were recruited before obtaining the diagnosis. Therefore, it is unlikely that confounding dietary habits were unique to one patient class.
2.2.Spectroscopic analysis
For quantitative normalization, 3 µl of 500 mM aqueous KSCN solution were added to each 47 µl serum, EDTA and citrate plasma before analysis in technical quadruplicates. The automated HT-FTIR-measurements (Vertex 70v FTIR spectrometer, HTS-XT extension, Twister robotic plate feeder, Bruker Optics GmbH, Ettlingen, Germany) of robotically spotted samples (50 nl per well) (instrumentTwo, M2 Automation GmbH, Berlin, Germany) on 384 well silicon MTPs (Bruker) were performed as described with 4 cm−1 resolution [21,22].
2.3.Data processing
The automated, self-parameterizing or pre-parameterized procedures for scaled subtraction of atmospheric water vapour, smoothing, adaptive iteratively penalized least squares (airPLS) baseline correction, outlier removal, averaging normalization, differentiation and combination of spectra were described in detail [21].
To obtain a representative spectral vector for each patient, the absorbance, 1st and 2nd derivative absorbance spectra of all three blood preparations were concatenated. Hence, we obtained vectors of 5751 features with 2 cm−1 spacing for each patient.
2.4.Feature selection
Crucial to such an analysis is the reduction of classification problem dimensionality by removal of redundant and uncorrelated information. With the most discriminative data, a best possible class separation should be achievable, with a reduced chance of overfitting the data. Two entirely different algorithms were applied. One computationally efficient algorithm with low requirements for processing power is termed maximum relevance, minimum redundancy (MRMR). It is based on data discretization and z-testing [23] and was successfully applied to nonlinear multivariate classification problems [6,21–23]. The basic algorithm can be downloaded from http://www.mathworks.com/matlabcentral/fileexchange/ 14,916 (October 16, 2015). The 100 most discriminative features were determined for each dataset, and ranked by the algorithm. A consecutive step-down selection for highest accuracy in 1000 independent leave-one-third-out MCCV with linear discriminant analysis (LDA) classifiers was performed. Supplementing the single top ranked feature, the lesser ranked up to 100 features were included into the calculation. The highest-ranked feature set performing with highest average accuracy in 1000 fold leave-1/3rd-out MCCV was identified as the MRMR selection result.
An alternative wrapping approach with iterative random forest classification was performed, demanding high processing power. It was successfully applied before and described in detail [21,22]. Briefly, random forests were used to determine the Gini-importance of single spectral features for correct classification [8,10,17,18]. After repeat selection from MC derived data subsets comprising 90% of the total dataset, the selection frequency of each identified feature was mapped. Based on the average accuracy, the best predicting feature sets were registered into a pool of selected features. This pool was analyzed by stepping down in search of a minimum selection frequency threshold. For each threshold, the identified feature sets were individually validated for optimum average accuracy in a 1000 fold LDA leave-one-third-out MCCV. The best performing feature set determined the minimum selection frequency threshold, which is given in Table 2.
Table 2
Average accuracy, sensitivity and specificity and standard deviations of the differentiation of control, SCC, AC patient classes after MRMR or RF feature selection in 1000 LDA and 50 RF leave-1/3rd-out Monte Carlo cross validations
| Feature selection* | X-Val | Accuracy | Sensitivity | Specificity | ||||
| % | ± | % | ± | % | ± | |||
| control:lung cancer | MRMR | LDA | 71 | 7 | 67 | 12 | 75 | 10 |
| control:lung cancer | MRMR | RF | 72 | 7 | 71 | 10 | 73 | 10 |
| control:lung cancer | RF(125/130) | LDA | 71 | 6 | 70 | 6 | 72 | 12 |
| control:lung cancer | RF(125/130) | RF | 72 | 6 | 75 | 12 | 69 | 10 |
| control:SCC | MRMR | LDA | 68 | 7 | 66 | 11 | 69 | 10 |
| control:SCC | MRMR | RF | 66 | 6 | 68 | 10 | 64 | 10 |
| control:SCC | MRMR** | LDA | 66 | 7 | 64 | 11 | 69 | 11 |
| control:SCC | MRMR** | RF | 68 | 7 | 69 | 10 | 67 | 12 |
| control:SCC | RF(119/155) | LDA | 73 | 7 | 71 | 11 | 75 | 10 |
| control:SCC | RF(119/155) | RF | 73 | 6 | 74 | 12 | 71 | 12 |
| control:AC | MRMR | LDA | 69 | 7 | 68 | 12 | 70 | 11 |
| control:AC | MRMR | RF | 77 | 7 | 77 | 11 | 78 | 9 |
| control:AC | RF(111/132) | LDA | 75 | 6 | 72 | 11 | 77 | 9 |
| control:AC | RF(111/132) | RF | 79 | 8 | 77 | 14 | 80 | 10 |
| SCC:AC | MRMR | LDA | 73 | 6 | 75 | 10 | 71 | 10 |
| SCC:AC | MRMR | RF | 75 | 8 | 74 | 11 | 76 | 13 |
| SCC:AC | RF(97/126) | LDA | 80 | 6 | 82 | 10 | 77 | 10 |
| SCC:AC | RF(97/126) | RF | 79 | 7 | 80 | 11 | 79 | 11 |
* For RF selected features, the minimum retrieval rate per total iteration number is given
** MRMR selected features without 1 redundant feature, see text.
The identified classification-characteristic features were checked for agreement with spectral contributions of the silicon substrate in absorbance, 1st and 2nd derivative spectra. Only one identified feature (1293 cm−1 in the 2nd derivative serum component) coincided with a broader substrate absorbance band at 1296 cm−1. MCCV indicates this feature as redundant. This is discussed in the result section.
2.5.Classification
A dual cross validation concept with two routines of proven performance [22] was followed. As a compromise to the limited set of patients in the study, a strict leave-one-third-out MCCV scheme was applied to all validation procedures. Classifiers were trained on a randomly selected 2/3 patients of the dataset to predict the left-out 1/3 subjects.
An algorithm with low time complexity is the classifying linear discriminant analysis (LDA). The Matlab provided routine ‘classify’, with à priori class membership estimation and a linear discriminant function was used. For robust results, a 1000 fold MCCV scheme was maintained with LDA classifiers.
A complex ensemble random forest classifier was applied as the demanding alternative in regard to processing power and classifier complexity [21]. In a random forest, prediction is achieved by majority vote of the included decision trees. Here, the prediction was deduced from the majority vote of an ensemble of 1001 random forests.
Following standard nomenclature, the percentage of correct classifications was defined as accuracy, whereas the percentage of true positive predictions among all positives reflected the sensitivity. Specificity is given as the percentage of true negative among all negative predictions.
2.6.Bioinformatics environment
Random forest routine calculations were performed within the Matlab environment, version 2012a with the R-project based [15] Matlab port (downloadable from http://code.google.com/p/randomforest-matlab/, October 21, 2015) on a High-Performance Computing Server Supermicro SYS-5086B with 8x Intel® Xeon® Westmere EX (E7-8837, 2.66 GHz, 8-Core), 512 GB RAM. MCCV and MRMR feature selection were performed on a standard office PC equipped with Intel Core2Quad CPU Q9650@3.0 GHz, 8 GB RAM running Matlab 2012a.
3.Results and discussion
3.1.The spectral dataset
Infrared absorbance spectra were obtained from 483 blood samples. 1932 spectra of the quadruplicate analysis were condensed and concatenated to representative spectral vectors of 161 patients, of citrate plasma, EDTA plasma, and serum (Fig. 2(A), (B), (C)). This resulted in 5751 features per patient. Spectra were normalized with the C–N triple bond absorbance band between 2150–2000 cm−1 of KSCN spiked to the sample. This maintained the absorbance band intensities as qualitative markers for the concentration of included substances, as e.g. total protein, total lipids, phosphates and glucose (Fig. 2, regions (i), (ii)). Due to the natural variation of concentrations, a clear assignment by visual inspection of marker bands is futile in the absorbance, 1st (regions (iii), (iv)) and 2nd derivative (regions (iii), (iv)). Sharp difference bands at 1245 cm−1 and 1182 cm−1 indicate spectral contributions of the silicon substrate to some spectra. This was likely caused by alteration of the substrate surface between sample-free reference measurement and the analysis of the deposited sample spot. Although not yet clearly evaluated, a repeated plasma treatment may have sensibilized the silicon surface for reactivity with atmospheric water. These bands are not expected to provide classification relevant information. However, the selected features were thoroughly checked to not coincide with these bands and the respective side lobes after derivatization. Some presented features appear close (Table 3), but are positioned next to bands or close to neutral turning points between sidelobes. One feature (serum 2nd derivative, Fig. 2(C) (vi), 1293 cm−1) close to one such band at 1296 cm−1 was selected by the MRMR algorithm. This feature is nevertheless redundant for classification, as will be shown later.
Fig. 2.
Absorbance spectra, (i, ii), 1st derivative (iii, iv), and 2nd derivative spectra (v, vi) of citrate plasma (A), EDTA plasma (B), and serum samples (C) as recorded and calculated from disease control (black), SCC (blue) and adenocarcinoma patients (red). The analysis was constrained to the respective C–H-stretching ((i), (iii), (v): 2800–3200 cm−1) and the fingerprint regions ((ii), (iv), (vi): 1750–875 cm−1).
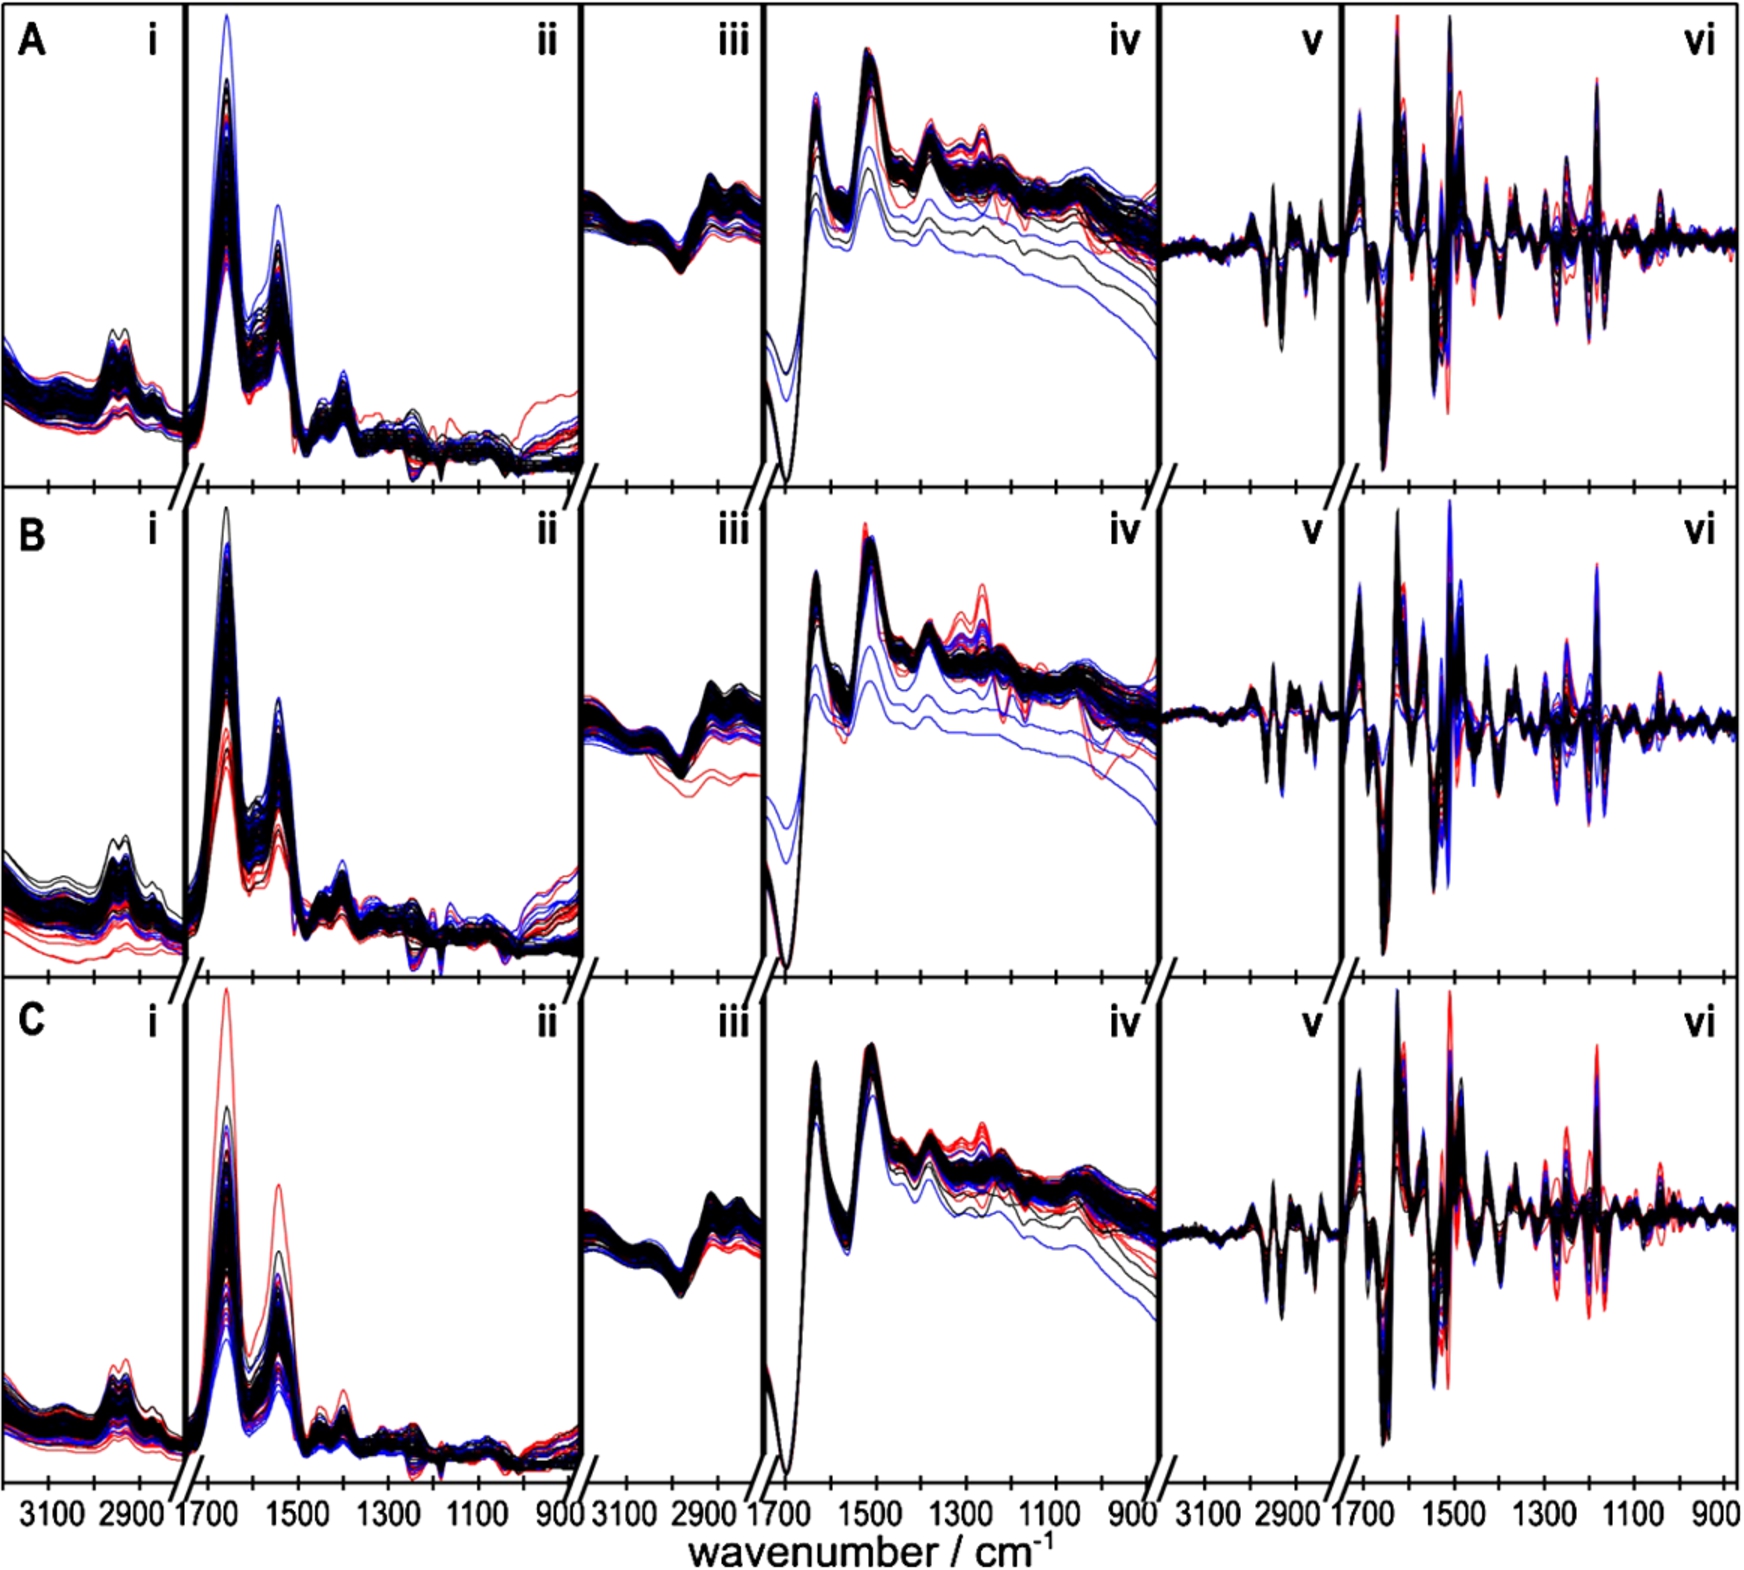
An approximate assignment of vibrational bands to functional groups, and to abundant blood substances featuring those groups is given in Table 4. These assignments are not unique, because FTIR absorbance bands are not unique to single substances contained in blood. For example, along with proteins, urea as well features strong absorbance bands in the 1700–1500 cm−1 region, due to the contained C=O and NH2 groups. Therefore, a unique scheme of increased and diminished substances in cancer-patient blood cannot be developed based on the identified infrared spectral feature patterns.
Table 3
List of identified discriminative features, wavenumber position given as cm−1
| Spectral region | Control vs. cancer | Control vs. SCC | Control vs. AC | SCC vs. AC | |||||
| MRMR | RF | MRMR | RF | MRMR | RF | MRMR | RF | ||
| Citrate plasma | Absorbance | 1095 | 1463 | 881 | |||||
| 1613 | |||||||||
| 1st derivative | 2842 | 1563 | |||||||
| 1747 | |||||||||
| 2nd derivative | 933 | 1097 | 1099 | 931 | 957 | 1019 | 875 | ||
| 1741 | 1121 | 959 | 1175 | 3096 | 1017 | ||||
| 971 | 3098 | 1029 | |||||||
| 1741 | 1175 | ||||||||
| 2814 | 2814 | ||||||||
| 2900 | 3098 | ||||||||
| 3098 | 3162 | ||||||||
| 3144 | |||||||||
| EDTA plasma | Absorbance | 1209 | 1261 | 1211 | 1593 | 985 | |||
| 1613 | 1595 | ||||||||
| 1605 | |||||||||
| 1st derivative | 1541 | 1541 | |||||||
| 2902 | 1597 | ||||||||
| 1685 | |||||||||
| 1723 | |||||||||
| 2910 | |||||||||
| 2nd derivative | 875 | 1699 | 985 | 875 | 875 | 3082 | 985 | ||
| 1103 | 3046 | 1635 | 933 | 3108 | 3194 | 987 | |||
| 3126 | 1637 | 969 | 1583 | ||||||
| 1699 | 983 | 1667 | |||||||
| 1743 | 1103 | 3192 | |||||||
| 2938 | 1133 | 3194 | |||||||
| 3106 | 3082 | ||||||||
| 3108 | 3108 | ||||||||
| 3150 | |||||||||
| 3194 | |||||||||
| Serum | Absorbance | 2918 | 2822 | 2832 | 2806 | ||||
| 2874 | |||||||||
| 1st derivative | 1159 | 1281 | 1239 | 885 | |||||
| 1563 | |||||||||
| 2nd derivative | 945 | 941 | 1293 | 943 | 943 | 989 | 887 | ||
| 3014 | 1385 | 1257 | 1693 | 943 | |||||
| 3082 | 989 | ||||||||
| 1077 | |||||||||
| 1079 | |||||||||
| 1097 | |||||||||
| 1099 | |||||||||
| 1439 | |||||||||
| 1693 | |||||||||
Table 4
Assignment of the vibrational frequencies to functional groups, and approximate assignment to the most abundant blood components with the respective groups as described in [4,13]
| Frequency/cm−1 | Functional group | Major substance |
| ∼3300 | N–H | Proteins, amide A |
| 3090–2840 | C–H | Lipids |
| ∼1740 | C=O | Fatty acids |
| 1700–1600 | C=O | Proteins, amide I |
| 1600–1500 | N–H | Proteins, amide II |
| ∼1400 | COO− | Amino acids |
| ∼1240 | P=O | Nucleic acids |
| 1170–1120 | C–O | Carbohydrates |
3.2.NSCLC versus disease control patients
First, to demonstrate the basic separability of NSCLC patients from the disease control group based on blood samples. Common spectral features of squamous cell carcinoma and adenocarcinoma were identified and verified in MCCV.
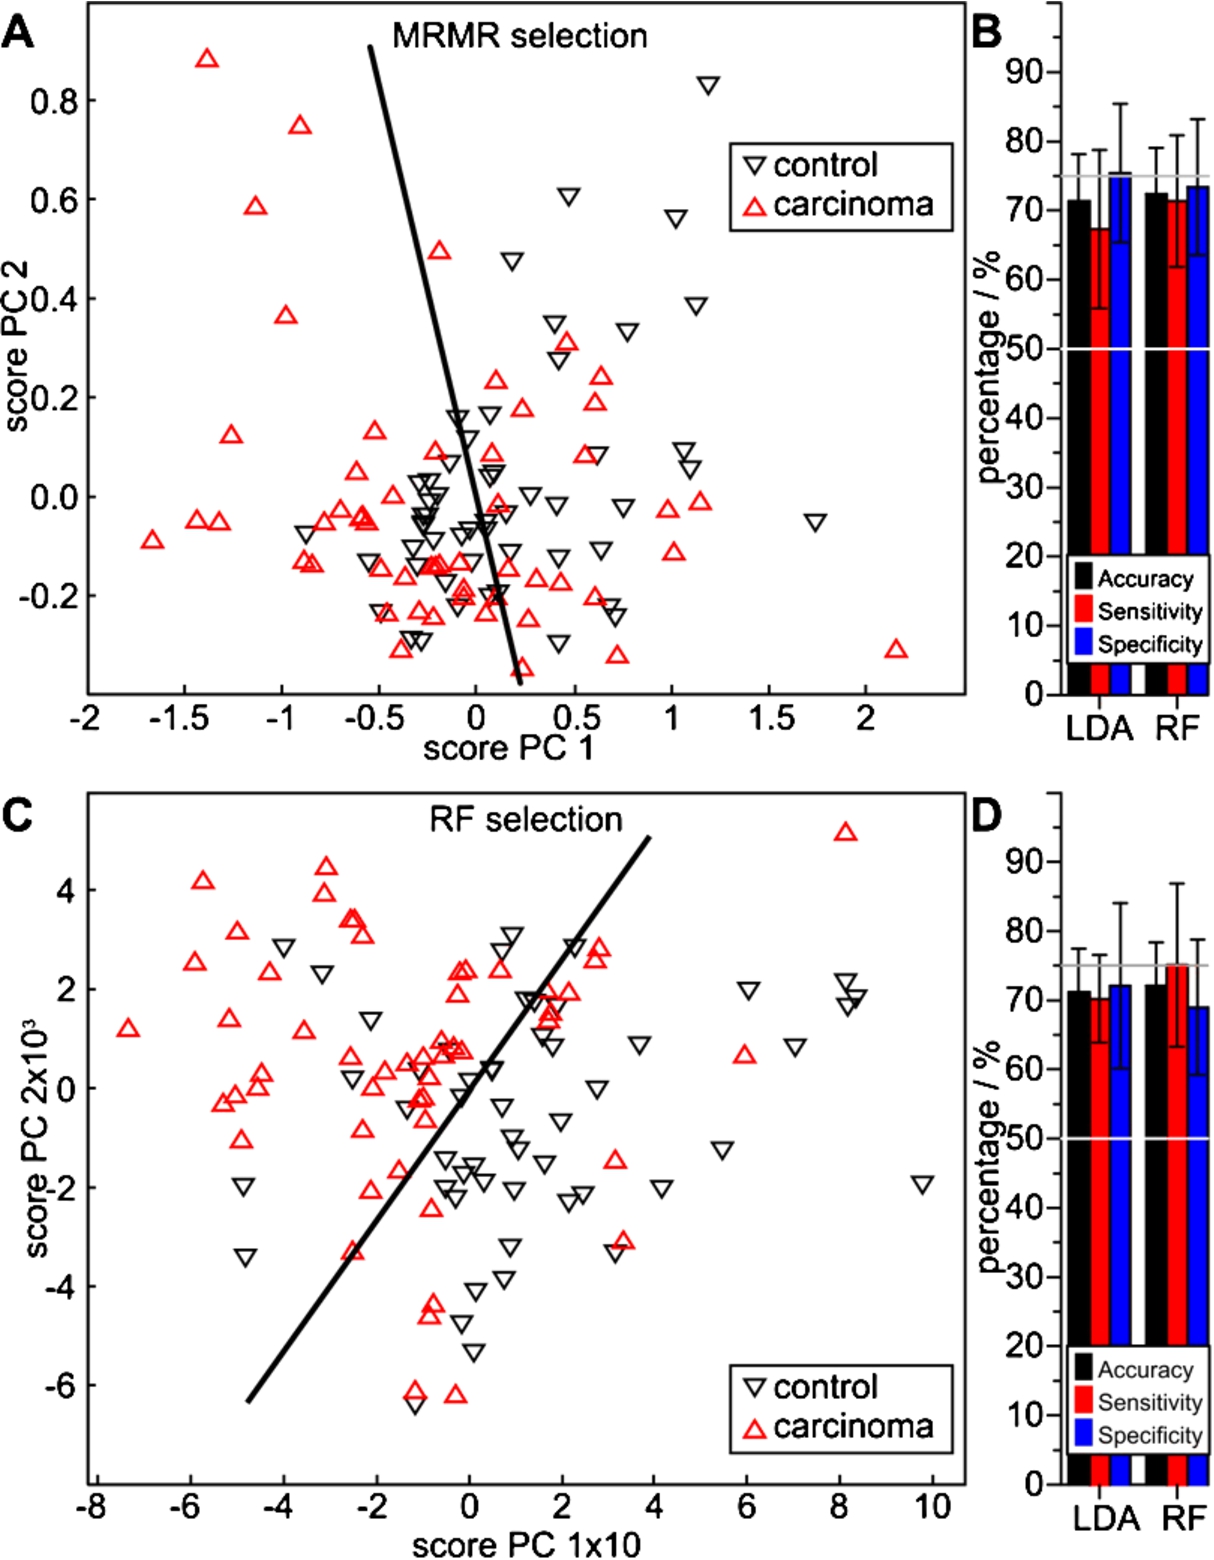
The lung cancer class, consisting of 19 SCC and 34 AC randomly selected patient samples, was separable from the disease controls with both feature sets. The projection of an LDA classifier into the score space of the first components of a principal component analysis (PCA) indicates a correct separation of more than 50% of patients (Fig. 3(A)). This is confirmed with MCCV with both LDA and RF classifiers on the dataset, indicating 71% and 72% accuracy, respectively (Fig. 3(B), Table 2). Respective sensitivities of 67% and 71%, and specificities of 75% and 73% were achieved. The RF based selection offers a visibly better class separation in the PCA projection (Fig. 3(C)). Although both MCCVs indicate similar accuracies of 71% and 72%, they also indicate improved sensitivities of 70% and 75% with specificities of 72 and 69%, respectively (Fig. 3(D), Table 2). The MRMR algorithm identified 12 relevant spectral features, whereas only two passed the rigorous RF based algorithm (Table 3). Although this appears as a rigorous feature reduction, both the PCA analysis (Fig. 3(C)) and the MCCV results (Fig. 3(D)) justify the feature selection. In this special case, the PCA-score plot illustrates the LDA separation of both classes by the intensities of the EDTA plasma absorbance feature at 1261 cm−1 (abscissa) and at 941 cm−1 of the 2nd derivative of the serum absorbance spectra (ordinate).
Fig. 3.
Performance of lung carcinoma spectral features extracted with the MRMR (A, B) and the RF method (C, D) versus control patients, determined with LDA and RF classifiers. The PCA score plots (A, C) visualize a qualitative separability, whereas the quotient ratios (B, D) quantify average MCCV results with accuracies above 70%.
The disease control group represents a typical variety of cases as expectable in a clinical setting. Therefore, it is an inhomogeneous group dominated by inflammatory lung diseases, and some less abundant non-inflammatory cases. Thereby, our classification system was tested with realistic control patients. It is likely attributable to the inhomogeneity of the current patient groups, that the accuracy of cancer detection is decreased in comparison with our earlier study on bladder cancer [22]. That study achieved an average accuracy of up to 92%, but was performed with the less inhomogeneous patient groups of urothelial carcinoma versus (severe) urinary tract inflammation.
3.3.Identification of squamous cell carcinoma
To pursue subtyping of NSCLC, spectral indicators of 54 primary SCC patient blood samples were identified and verified against 53 cancer-free control patients.
Both feature selection algorithms identified indicative spectral features, which all cross-validated with a significantly higher average accuracy than 50%. Four MRMR selected features indicated a class separation in the score plot of the first two PCAs (Fig. 4(A)). MCCV resulted in respective accuracies of 68 and 66%, sensitivities of 66 and 68%, and specificities of 69 and 64%, with LDA and RF classifier MCCV (Fig. 4(B), Table 2). Although spectral contributions of the silicon substrate (Si–H, Si–O, Si–O–H, C–Si–O and local surface defects) are usually avoided by referencing a sample position with the identical substrate before sample application, one MRMR selected feature at 1293 cm−1 coincided with an identified artefact at 1296 cm−1 on background noise level intensity. MCCV were repeated without this feature. LDA MCCV resulted in
Fig. 4.
Performance of squamous cell carcinoma spectral features extracted with the MRMR (A, B) and the RF method (C, D) versus control patients, determined with LDA and RF classifiers. The PCA score plots (A, C) visualize a qualitative separability, whereas the quotient ratios (B, D) quantify average MCCV results.
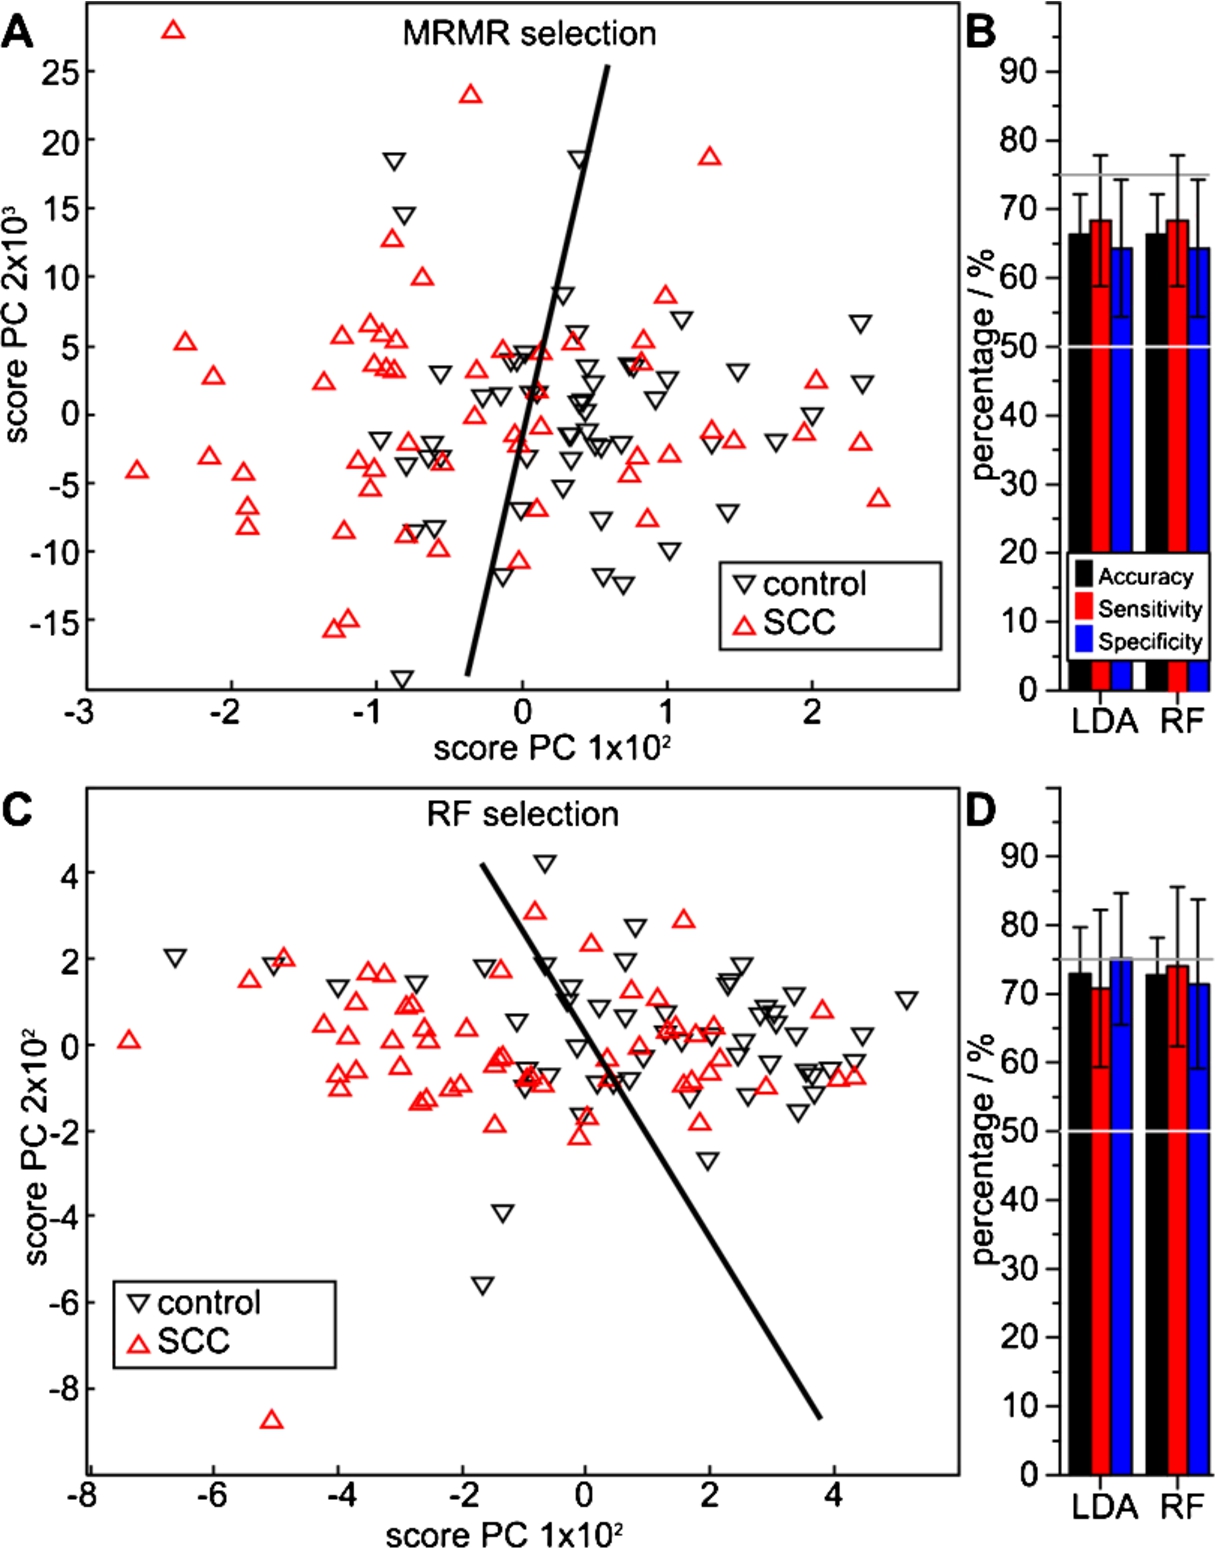
A significantly better classifier performance was obtained with 11 RF selected features. The two dimensional projection of the PCA score plot indicates a specific, but not necessarily sensitive class separation (Fig. 4(C)). Quantitative numbers of the MCCV analysis do not confirm this impression: LDA and RF indicate an average accuracy of 73%, sensitivities of 71% and 74%, and specificities of 75% and 71%. Thus, very similar results were obtained using these entirely different classifiers (Fig. 4(D), Table 2).
3.4.Identification of adenocarcinoma
Consequently, the spectral discrimination of disease control patients from those suffering from primary adenocarcinoma was researched. To maintain balanced class sizes, 53 patients of each DC and AC were compared.
Fig. 5.
Performance of adenocarcinoma spectral features extracted with the MRMR (A, B) and the RF method (C, D) versus control patients, determined with LDA and RF classifiers. The PCA score plots (A, C) visualize a qualitative separability, whereas the quotient ratios (B, D) quantify average MCCV results.
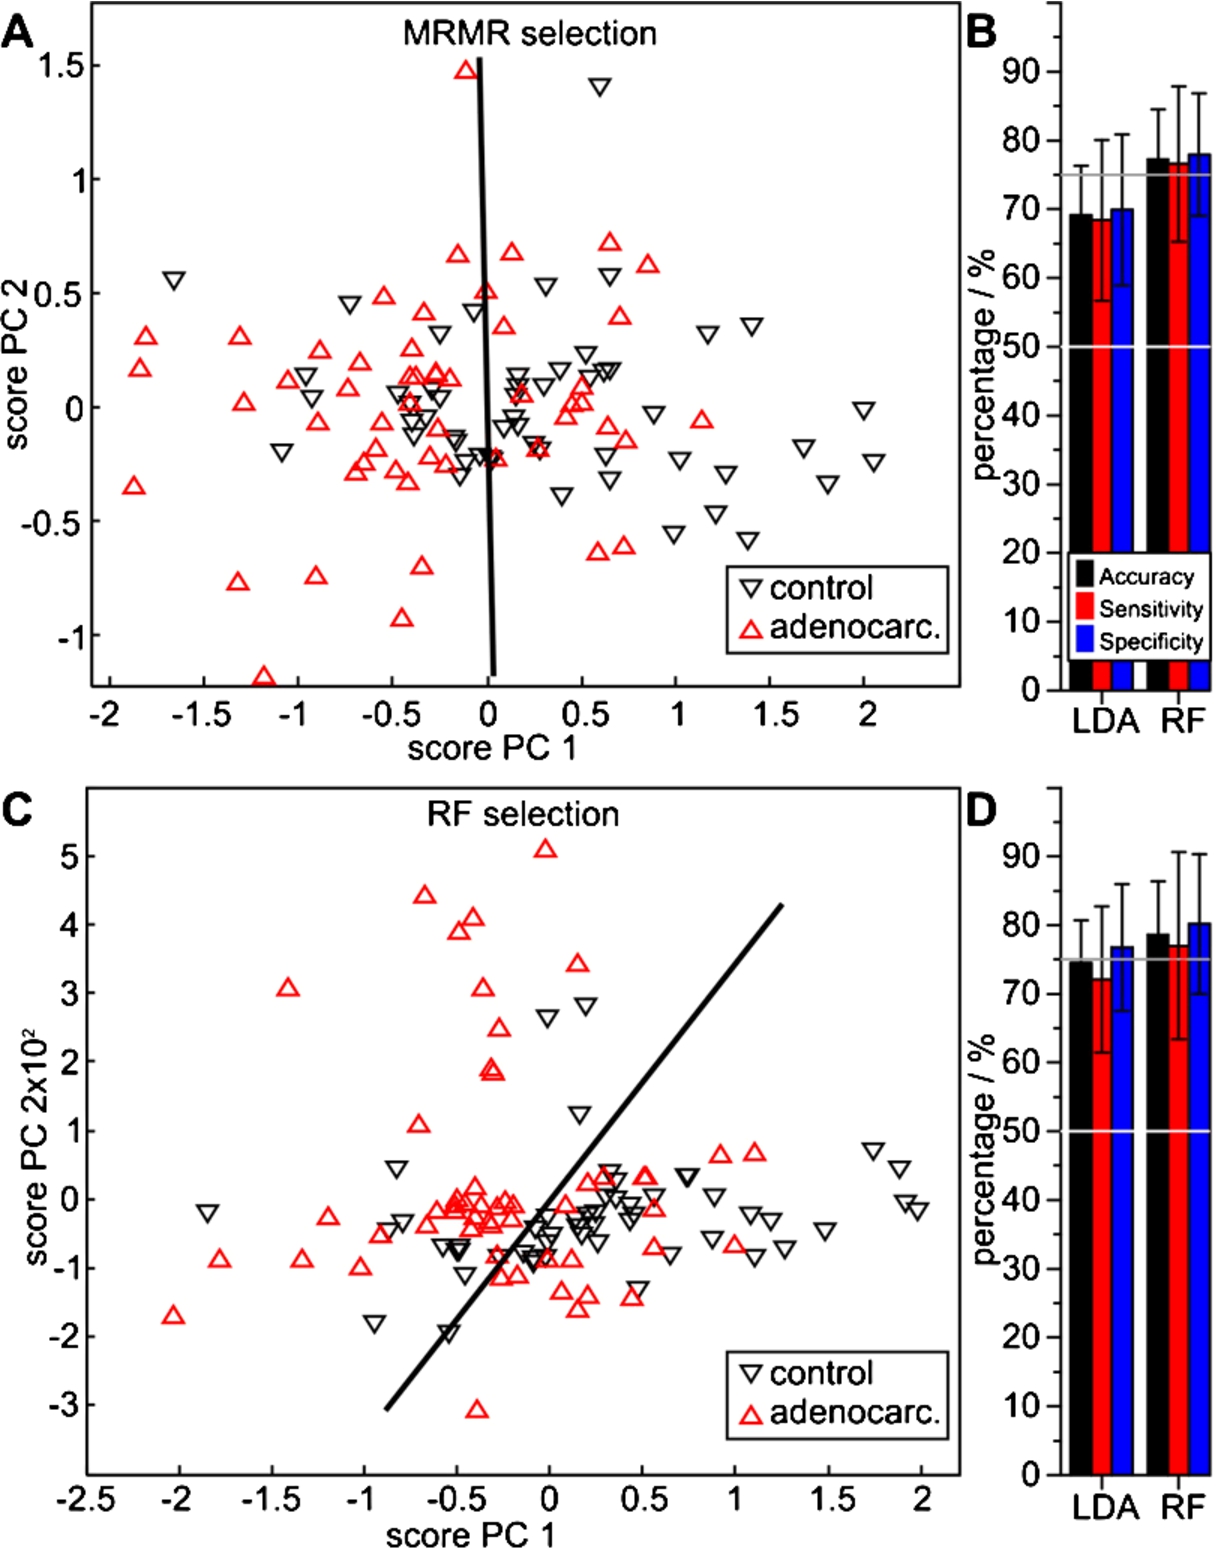
The PCA score plot of 34 MRMR selected features indicates an essential class separability with approximately equal numbers of false positive and false negative assignments (Fig. 5(A)). MCCV confirms the qualitative impression: repeated LDA MCCV resulted in an average accuracy of 69%, a sensitivity of 68% and a specificity of 70%. With RF MCCV, significantly higher values were obtained: 77%, 77% and 78% (Fig. 5(B), Table 2). The seven RF selected features, on the other hand, indicated a good separability in the PCA analysis (Fig. 5(C)). Both LDA and RF MCCV resulted in higher average numbers. With LDA, an average accuracy of 75%, sensitivity of 72% and specificity of 77% was achieved. The RF MCCV resulted in an accuracy of 79%, with a sensitivity of 77% and a specificity of 80%. Thus, AC patients are clearly separable from DC patients based on the infrared spectral blood analysis.
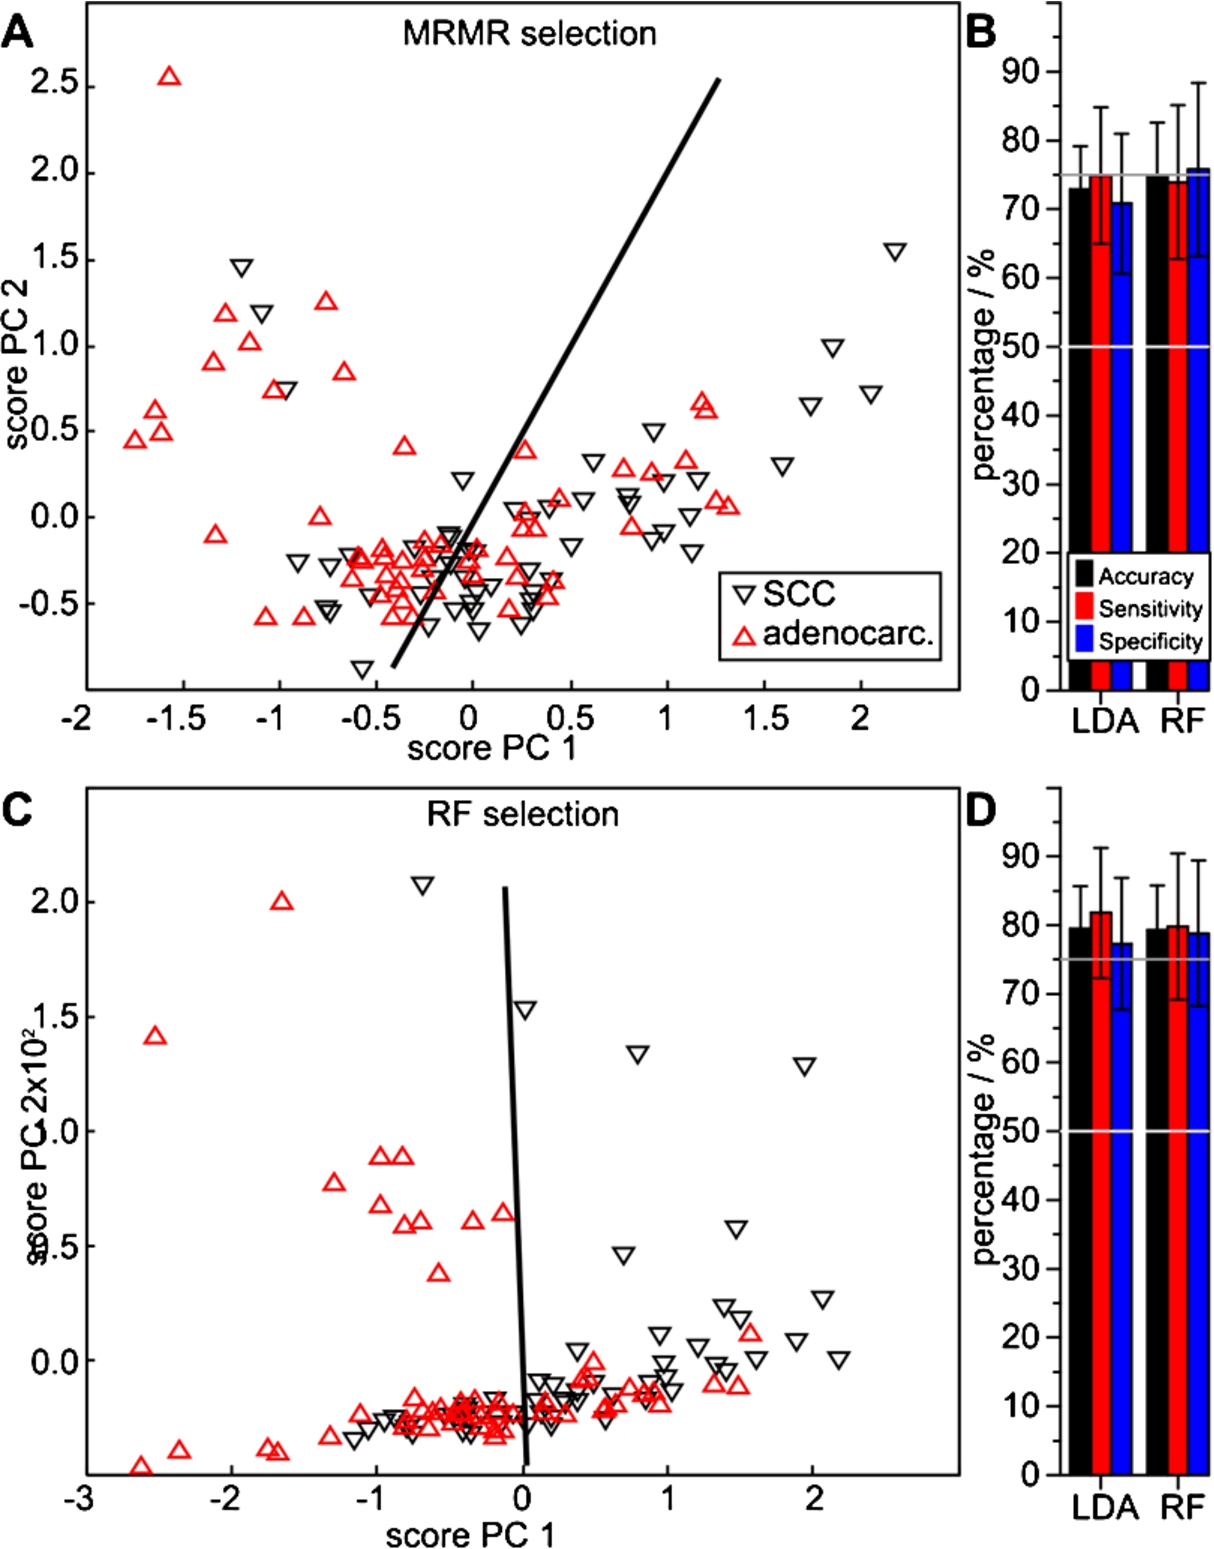
3.5.NSCLC subtype differentiation
Finally, the separability of SCC from AC patients in regard to NSCLC subtyping was analyzed. Thus, 54 patients of each class were analyzed.
Again, both MRMR and RF algorithms identified differentiating feature sets. Ten MRMR selected features roughly discriminated the two disease classes in the PCA score projection (Fig. 6(A)). Repeated MCCV indicates a relatively high separation quality. Average accuracies of 73% and 75%, sensitivities of 75% and 74%, and specificities of 71% and 76% were achieved, with respective LDA and RF MCCV (Fig. 6(B), Table 2). Contrastingly, the RF algorithm selected 29 features (Table 3). Using those, the PCA analysis indicated an improved class separability (Fig. 6(C)). Further, the highest cross validation results were achieved. The LDA and RF MCCVs resulted in respective average accuracies of 80% and 79%, sensitivities of 82% and 80%, and specificities of 77% and 79% (Fig. 6(D), Table 2).
Fig. 6.
Performance of spectral features extracted with the MRMR (A, B) and the RF method (C, D) to differentiate SCC from adenocarcinoma patients, determined with LDA and RF classifiers. The PCA score plots (A, C) visualize a qualitative separability, whereas the quotient ratios (B, D) quantify average MCCV results.
Summing up, the presented FTIR spectroscopic DPR approach performed similarly well as a recently reported multi-marker panel approach for screening of oncologic diseases [29]. In a 12 year study on 41,516 patients, Wen et al. achieved a sensitivity of 75% for lung cancer: 27 of 36 lung cancer patients were correctly identified with an eight molecule marker-panel. Another very applicable strategy for cancer detection by blood analysis was termed liquid biopsy, meaning the identification and characterization of cell-free DNA (cfDNA) [25] or circulating tumour cells (CTC) [30]. Sensitivities ranging from 24–100% were reported [30]. As a 73–79% accuracy is clearly insufficient for screening, we propose to evaluate the combination of multi marker panels and a liquid biopsy assay with the DPR approach. Such a testing scheme is likely to yield improved results. Further, the scheme could be shaped for either optimum sensitivity or optimum specificity, exploiting the strength of each single technique.
4.Conclusions
This work shows and quantifies the given potential of FTIR spectroscopic blood analysis for the detection of the two most abundant subtypes of non-small cell lung carcinoma within a 161 patient risk collective. Furthermore, the applicability for cancer subtyping into squamous cell carcinoma and adenocarcinoma is shown. The results originate from two entirely different feature selection algorithms and were achieved with two different classifiers in patient-wise leave-1/3rd-out Monte Carlo cross validations. Although this proofs the general ability for label-free, minimally invasive patient group distinction, the performance is yet insufficient for screening purposes. The actual performance in a real-life clinical setting remains to be evaluated with independent patient sets in further studies.
Acknowledgements
This research was funded by the German Social Accident Insurance (DGUV; project FP339A) and supported by PURE (Protein research Unit Ruhr within Europe), which was financed by the state of North Rhine-Westphalia. The responsibility for this publication and the presented results is in the hands of the authors.
References
1 | [[1]] National Lung Screening Trial Research Team, D.R. Aberle, A.M. Adams, C.D. Berg, W.C. Black, J.D. Clapp, R.M. Fagerstrom, I.F. Gareen, C. Gatsonis, P.M. Marcus and J.D. Sicks Reduced lung-cancer mortality with low-dose computed tomographic screening, N. Engl. J. Med. 365: ((2011) ), 395–409. |
2 | [[2]] A. Akalin, X. Mu, M.A. Kon, A. Ergin, S.H. Remiszewski, C.M. Thompson, D.J. Raz and M. Diem, Classification of malignant and benign tumors of the lung by infrared spectral histopathology (SHP), Lab. Investig. J. Tech. Methods Pathol. 95: ((2015) ), 697. |
3 | [[3]] M.J. Baker, Photonic biofluid diagnostics, J. Biophotonics 7: ((2014) ), 151–152. |
4 | [[4]] M.J. Baker, S.R. Hussain, L. Lovergne, V. Untereiner, C. Hughes, R.A. Lukaszewski, G. Thiéfin and G.D. Sockalingum, Developing and understanding biofluid vibrational spectroscopy: A critical review, Chem. Soc. Rev. (2015). PMID: 26612430. [Epub ahead of print] |
5 | [[5]] B. Bird, M.S. Miljković, S. Remiszewski, A. Akalin, M. Kon and M. Diem, Infrared spectral histopathology (SHP): A novel diagnostic tool for the accurate classification of lung cancer, Lab. Investig. J. Tech. Methods Pathol. 92: ((2012) ), 1358–1373. |
6 | [[6]] C. Ding and H. Peng, Minimum redundancy feature selection from microarray gene expression data, J. Bioinform. Comput. Biol. 03: ((2005) ), 185–205. |
7 | [[7]] F. Farjah, D.K. Madtes, D.E. Wood, D.R. Flum, M.E. Zadworny, R. Waworuntu, B. Hwang and M.S. Mulligan, Vascular endothelial growth factor C complements the ability of positron emission tomography to predict nodal disease in lung cancer, J. Thorac. Cardiovasc. Surg. 150: ((2015) ), 796–803.e2. |
8 | [[8]] R. Genuer, J.M. Poggi and C. Tuleau-Malot, Variable selection using random forests, Pattern Recognit. Lett. 31: ((2010) ), 2225–2236. |
9 | [[9]] F. Großerueschkamp, A. Kallenbach-Thieltges, T. Behrens, T. Brüning, M. Altmayer, G. Stamatis, D. Theegarten and K. Gerwert, Marker-free automated histopathological annotation of lung tumour subtypes by FTIR imaging, The Analyst 140: ((2015) ), 2114–2120. |
10 | [[10]] T. Hastie, R. Tibshirani, M.B. Eisen, A. Alizadeh, R. Levy, L. Staudt, W.C. Chan, D. Botstein and P. Brown, “Gene shaving” as a method for identifying distinct sets of genes with similar expression patterns, Genome Biol. 1: ((2000) ), RESEARCH0003. |
11 | [[11]] C. Hughes and M.J. Baker, Can mid-infrared biomedical spectroscopy of cells, fluids and tissue aid improvements in cancer survival? A patient paradigm, The Analyst 141: ((2015) ), 467–475. |
12 | [[12]] E. Karampini and F. McCaughan, Circulating DNA in solid organ cancers-analysis and clinical application, QJM Mon. J. Assoc. Physicians (2015). PMID: 26337660, 2015 September 3. pii: hcv146. [Epub ahead of print] |
13 | [[13]] C. Lacombe, V. Untereiner, C. Gobinet, M. Zater, G.D. Sockalingum and R. Garnotel, Rapid screening of classic galactosemia patients: A proof-of-concept study using high-throughput FTIR analysis of plasma, The Analyst 140: ((2015) ), 2280–2286. |
14 | [[14]] P.D. Lewis, K.E. Lewis, R. Ghosal, S. Bayliss, A.J. Lloyd, J. Wills, R. Godfrey, P. Kloer and L.A.J. Mur, Evaluation of FTIR spectroscopy as a diagnostic tool for lung cancer using sputum, BMC Cancer 10: ((2010) ), 640. |
15 | [[15]] A. Liaw and M. Wiener, Classification and regression by random forest, R News 2: ((2002) ), 18–22. |
16 | [[16]] M. Malvezzi, P. Bertuccio, T. Rosso, M. Rota, F. Levi, C. La Vecchia and E. Negri, European cancer mortality predictions for the year 2015: Does lung cancer have the highest death rate in EU women?, Ann. Oncol. Off. J. Eur. Soc. Med. Oncol. ESMO 26: ((2015) ), 779–786. |
17 | [[17]] B.H. Menze, B.M. Kelm, R. Masuch, U. Himmelreich, P. Bachert, W. Petrich and F.A. Hamprecht, A comparison of random forest and its Gini importance with standard chemometric methods for the feature selection and classification of spectral data, BMC Bioinformatics 10: ((2009) ), 213. |
18 | [[18]] B.H. Menze, W. Petrich and F.A. Hamprecht, Multivariate feature selection and hierarchical classification for infrared spectroscopy: Serum-based detection of bovine spongiform encephalopathy, Anal. Bioanal. Chem. 387: ((2007) ), 1801–1807. |
19 | [[19]] J. Moecks, G. Kocherscheidt, W. Koehler and W.H. Petrich, Progress in diagnostic pattern recognition (DPR), in: Proc SPIE, A. Mahadevan-Jansen, M.G. Sowa, G.J. Puppels, Z. Gryczynski, T. Vo-Dinh and J.R. Lakowicz, eds, San Jose, CA, (2004) , pp. 117–123. |
20 | [[20]] X. Mu, M. Kon, A. Ergin, S. Remiszewski, A. Akalin, C.M. Thompson and M. Diem, Statistical analysis of a lung cancer spectral histopathology (SHP) data set, The Analyst 140: ((2015) ), 2449–2464. |
21 | [[21]] J. Ollesch, S.L. Drees, H.M. Heise, T. Behrens, T. Brüning and K. Gerwert, FTIR spectroscopy of biofluids revisited: An automated approach to spectral biomarker identification, The Analyst 138: ((2013) ), 4092–4102. |
22 | [[22]] J. Ollesch, M. Heinze, H.M. Heise, T. Behrens, T. Brüning and K. Gerwert, It’s in your blood: Spectral biomarker candidates for urinary bladder cancer from automated FTIR spectroscopy, J. Biophotonics 7: ((2014) ), 210–221. |
23 | [[23]] H. Peng, F. Long and C. Ding, Feature selection based on mutual information criteria of max-dependency, max-relevance, and min-redundancy, IEEE Trans. On Pattern Anal. Mach. Intell. 27: ((2005) ), 1226–1238. |
24 | [[24]] T. Powrózek, P. Krawczyk, D.M. Kowalski, B. Kuźnar-Kamińska, K. Winiarczyk, M. Olszyna-Serementa, H. Batura-Gabryel and J. Milanowski, Application of plasma circulating microRNA-448, 506, 4316, and 4478 analysis for non-invasive diagnosis of lung cancer, Tumour Biol. J. Int. Soc. Oncodevelopmental Biol. Med. (2015). PMID: 26341493, 2015 September 4. [Epub ahead of print] |
25 | [[25]] N. Sueoka-Aragane, N. Katakami, M. Satouchi, S. Yokota, K. Aoe, K. Iwanaga, K. Otsuka, S. Morita, S. Kimura and S. Negoro, Hanshin-Saga collaborative cancer study group, monitoring EGFR T790M with plasma DNA from lung cancer patients in a prospective observational study, Cancer Sci. 107: ((2016) ), 162–167. |
26 | [[26]] G. Sutedja, New techniques for early detection of lung cancer, Eur. Respir. J. 21: ((2003) ), 57S–66S. |
27 | [[27]] H.P. Wang, H.C. Wang and Y.J. Huang, Microscopic FTIR studies of lung cancer cells in pleural fluid, Sci. Total Environ. 204: ((1997) ), 283–287. |
28 | [[28]] X. Wang, X. Shen, D. Sheng, X. Chen and X. Liu, FTIR spectroscopic comparison of serum from lung cancer patients and healthy persons, Spectrochim. Acta. A. Mol. Biomol. Spectrosc. 122: ((2014) ), 193–197. |
29 | [[29]] Y.-H. Wen, P.-Y. Chang, C.-M. Hsu, H.-Y. Wang, C.-T. Chiu and J.-J. Lu, Cancer screening through a multi-analyte serum biomarker panel during health check-up examinations: Results from a 12-year experience, Clin. Chim. Acta Int. J. Clin. Chem. 450: ((2015) ), 273–276. |
30 | [[30]] Z. Zhang, N. Ramnath and S. Nagrath, Current status of CTCs as liquid biopsy in lung cancer and future directions, Front. Oncol. 5: ((2015) ), 209. |


