
Building up spectral libraries for mapping erythrocytes by hyperspectral dark field microscopy
Abstract
Background:
Red blood cells (RBC) are obtained by non-invasive methods and widely used for diagnostic tests of health status. Hyperspectral Dark Field Microscopy (HDFM) is a promising technique for nanoscale bio imaging and spectral analysis without additional sample preparation.
Objective:
Develop a protocol for human RBC characterization by HDFM, checking the feasibility of a reference spectral library that can image and afford a new comprehensive descriptor of RBC status.
Method:
A step-by-step protocol for HDFM measurement of human RBC was for the first time established using 5 µl of EDTA-treated whole blood from healthy adults (
Results:
A library made of 8 end-member spectra and classification of their spectral distribution carried out by Single Angle Mapper (SAM) were determined, furnishing a comprehensive mapping and descriptor of healthy human RBC. The spectra of single components allowed some of the RBC spectral bands to be attributed.
Conclusions:
This work reports for the first time the hyperspectral optical imaging of the human RBC by a library made of 8 scattering spectra, whose spectral signatures are compared with those of the main RBC molecular components. The percent distribution of the spectral end-members was also achieved, thus giving for the first time the HDFM mapping of human healthy RBCs. The protocol developed herein allows the clinical potential of hyperspectral imaging to be developed for the use of RBC mapping in health and disease.
1.Introduction
The use of light for diagnostic purposes is an important tool for providing fast, comprehensive, though precise, information of complex sample properties. Particularly, the Hyperspectral Imaging System (HIS) integrated-darkfield-based microscope technology (HDFM) was described almost a decade ago, as tool for providing quantitative mapping of surfaces and material identification, formerly introduced in the remote sensing field for satellite imagery analysis [9]. The optical image with both spectral and spatial information can be obtained in one measurement and does not require contact between the object and the sensor, allowing spectral libraries to be built in order to assign the registered spectra to specific components, at the same time identified both as quality and quantity in the sample. The usefulness of such technique in biological field was demonstrated, such as for example in the characterization of single biomolecules [13,21], in the cytological diagnosis of cancerous tissues [3,15,20], as well as in the spectral characterization of gold nanoparticle distribution and pathogens in the blood [18,19]. Some of us reported an initial approach of HDFM analysis of blood cells, evidencing the possibility to work with whole blood, without need of fluorescent markers, and envisaging that the membrane cell morphology and types influenced the spectral characteristics [25]. This initial step, still suffering from light contribution, did not develop a unique HDFM spectral library for human healthy RBC, neither acquired spectra of the molecular components of this blood cell to assign characteristic spectral bands and evaluate the contribution quantitatively by the Spectral Angle Mapper (SAM) function of the HDFM apparatus.
Therefore, our work was first focused on assessing the HDFM protocol for red blood cell (RBC) imaging and developing the spectral library for healthy human RBCs. The morphology and optical characteristics of erythrocytes have been widely studied by numerous research groups [8,23,27]. Spectral characterization and information obtained from RBC can be further applied to the evaluation of health and disease conditions, since pathological status can alter the structure and molecular content of RBC [4]. It is also evident that RBC mapping describe a complex and comprehensive contribution of membrane and cell constituents, having specific molecular composition and organization, therefore it is also important to understand the contribution of each component in the RBC hyperspectral imaging.
In this paper, we wish to report the step-by step procedure for examining experimental samples of fresh human blood (30 samples from healthy adult volunteers) without any preliminary treatment, and the corresponding HDFM spectral library in the wavelength window of visible near-infrared (VNIR 400 nm–1000 nm). The Single Angle Mapper (SAM) function also provided for the classification of the spectral distribution, obtaining the first mapping of the healthy adult RBC. By acquiring spectra from solutions/suspensions of some of the natural components of erythrocytes, the identification of bands present in the spectral library of the cells was possible, evidencing that the hyperspectral analysis can give information on phospholipids, hemoglobin, spectrin, cholesterol and protoporphyrin moieties.
This work intends to give for the first time the proof of concept that hyperspectral imaging can represent a fast, non-expensive screening methodology to examine RBCs and gather comprehensive information on the cell membrane components and their organization, that are the premise of using HDFM methodology for clinical targets. This also opens the field to integrated approaches for determination of cell impairment due to the unbalance of its molecular components, such as those targeted to cell membranes using lipidomics [5].
2.Materials and methods
Human hemoglobin, protoporphyrin IX, cholesterol, spectrin from human erythrocytes and phosphate buffer were available from Sigma-Aldrich (Milan, Italy); phospholipid egg lecithin was available from Avanti Polar Lipids (Alabama, USA). All compounds were used without further purification.
Human blood was obtained from 30 healthy adult volunteers and treated with EDTA as the anticoagulant. The samples remained anonymous and written informed consensus to use the sample for research was signed by the subjects. Ethical rules were followed according to the declaration of Helsinki and its enclosures. Being not involved any diagnostic purpose and health relationship, the ethical committee approval was not necessary.
Hyperspectral Dark Field Microscopy (HDFM) equipment settings. The analyses were carried out at room temperature by using CytoViva® Hyperspectral Microscope equipped with high power halogen light source, liquid light guide, CytoViva® patented nanoscale illumination optics, motorized stage, microscope stand with accessories, cooled color optical camera and an imaging spectrograph coupled to a sensitive digital camera. All images were acquired with a 100× oil objective and exposure time of 0.5 s; the processing of image is supported by CytoViva-Envi software (vers. 4.4, CytoViva, Inc., Auburn, AL, USA). It provides hyperspectral imaging in the visible near-infrared (VNIR, 400 nm–1000 nm) and short wave infrared (SWIR 900 nm–1700 nm) wavelength ranges. Each pixel of the hyperspectral image provides the complete spectral response of that pixel’s spatial area of 25 nm. This spectral data is recorded at approximately 2 nm of spectral resolution.
Preparation of solutions/suspension containing RBC reference components. Solutions or suspensions of five references as natural components of RBC were prepared with molarities respectful of the biological ones, as indicated below:
1.6 mM human hemoglobin in 10 mM phosphate buffer saline (PBS) [11];
6.5 mM protoporphyrin IX dissolved in tridistilled H2O [7];
3.9 mM cholesterol in tridistilled H2O [17];
4.8 mM egg lecithin phospholipids as multilamellar liposome suspension in tridistilled H2O [17]; the average diameter size is 200 nm as detected by dynamic light scattering (DLS) measurements.
0.41 µM spectrin in 10 mM phosphate buffer saline (PBS) [12].
Step-by-step procedure for spectral acquisition of the reference samples. 5 µl of each solution or suspension, indicated above, were loaded in the center of glass slides and sandwiched with coverslip for optical image acquisition.
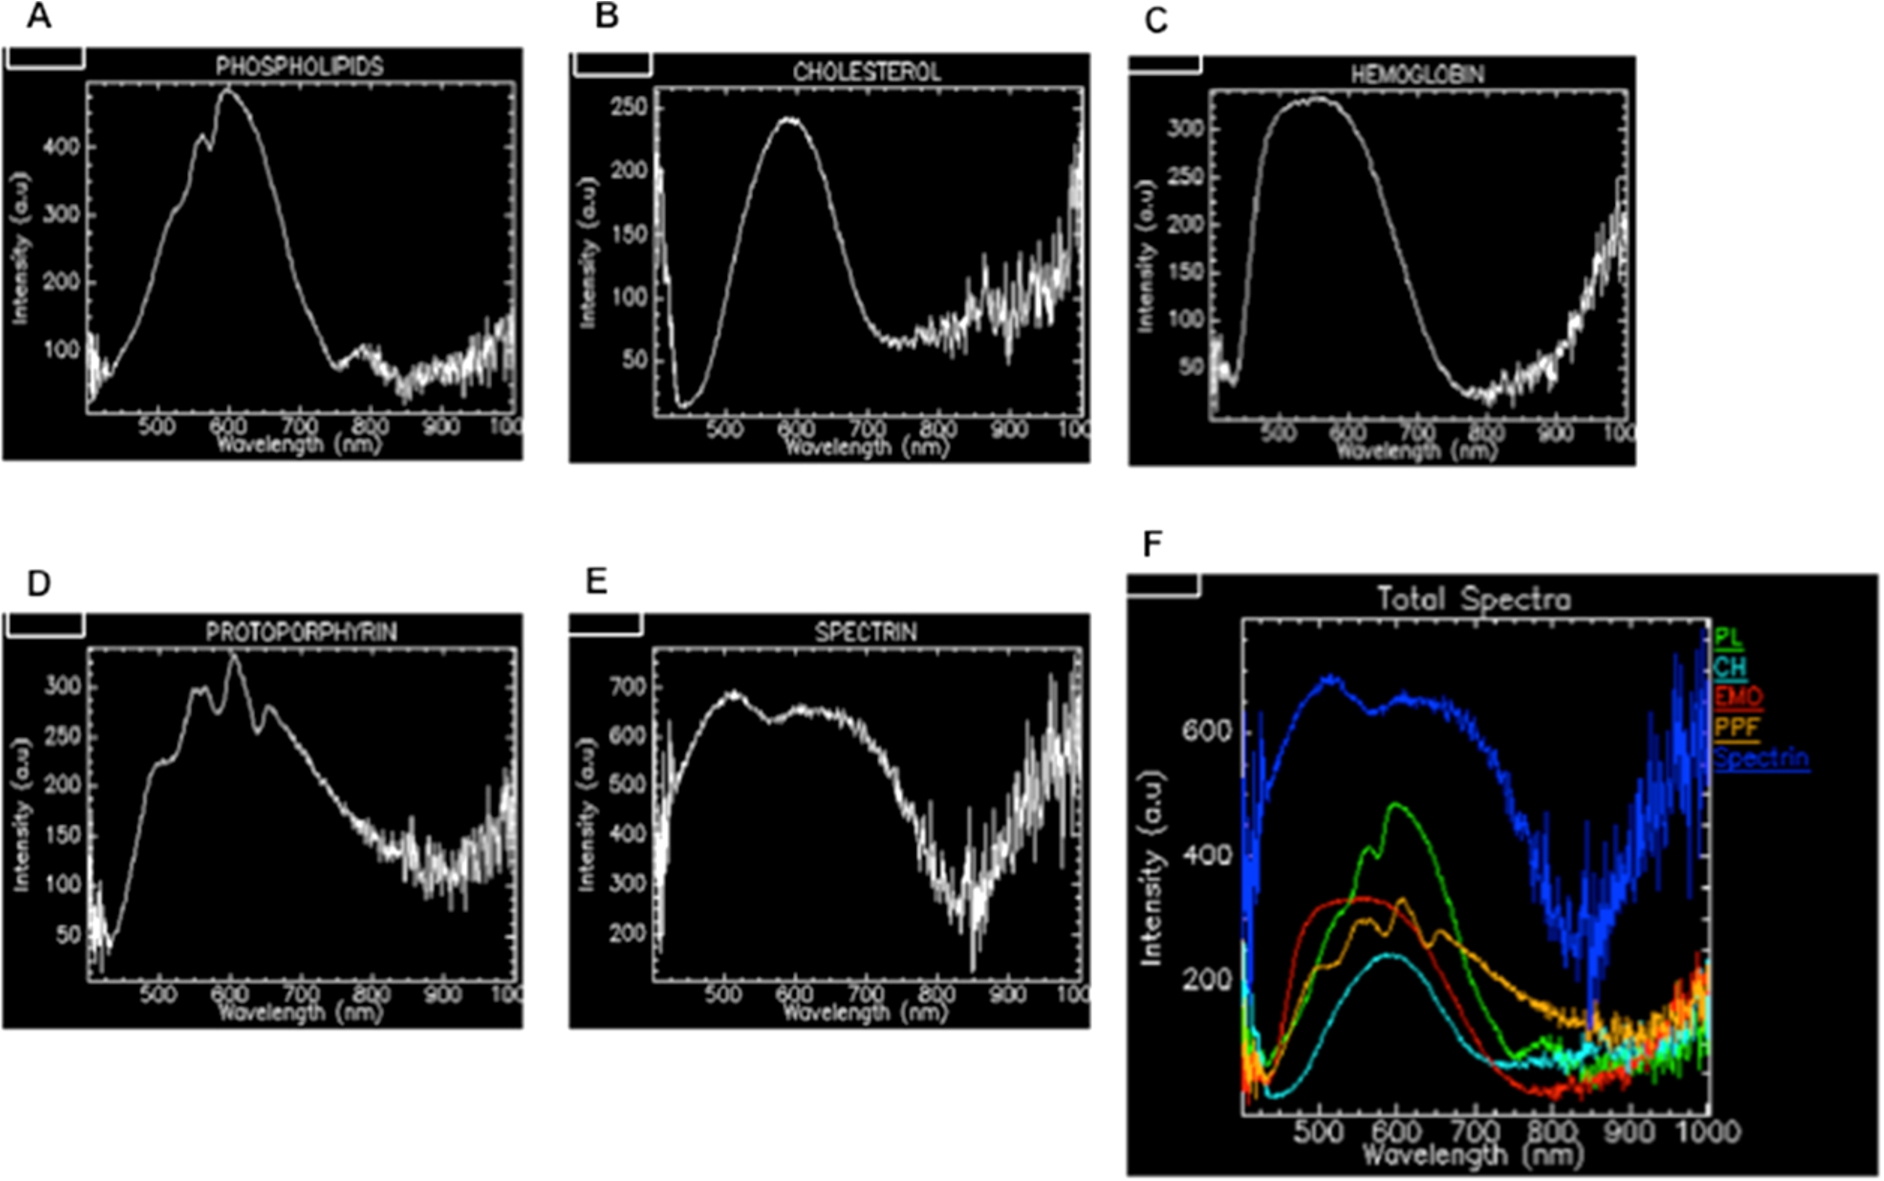
From an optical image made of 700,000 pixels, after background subtraction, the region of interest (ROI) was selected and the hyperspectral image of the sample was acquired; characteristic spectra were observed for each reference compound with a resolution of 2 nm in the wavelength window of visible near-infrared (VNIR 400 nm–1000 nm) (see Fig. 1, spectra (A)–(E)). A color code was assigned to each spectrum (see Fig. 1(F)). Table 1 describes the characteristic bands evidenced in each spectrum.
Fig. 1.
HDFM spectra of five representative components of red blood cells prepared in solution or suspension as described in Section 2: (A) phospholipids as egg lecithin liposome; (B) cholesterol; (C) hemoglobin; (D) protoporphyrin IX; (E) spectrin. The spectrum (F) shows all the spectra with arbitrary color code for RBC mapping as shown in Fig. 2(E).
Hyperspectral analysis and mapping of RBC. 5 µl of whole blood (EDTA-treated), obtained by healthy adult volunteers (
about 30 regularly shaped RBCs were present in each image (see Fig. 2(A));
in the image field only RBCs were present, no other blood cells;
one RBC with net image was chosen (Fig. 2(C)) and the procedure of ROI selection and acquisition was repeated in triplicate;
measurement was repeated for three different RBCs of the same image.
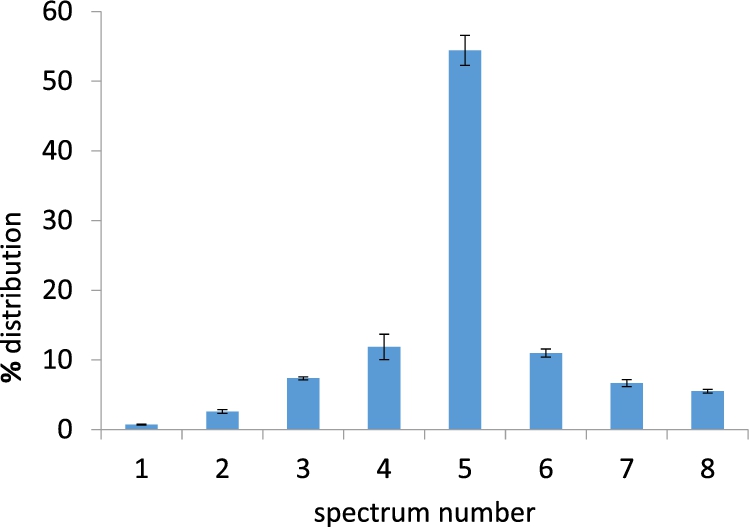
From an optical image, after background subtraction, the region of interest (ROI) was selected choosing pixels with similar features in order to identify them in same region. The spectra were then evaluated as number of peaks, wavelengths and the overall spectral shape. For the RBCs, eight spectra (Fig. 2(B)) were individuated with optimal coverage of the optical image (Fig. 2(D)). The main spectral bands of the 8 spectra are collected in Table 2. Applying the SAM (single angle mapper) function, the spectral distribution of the 8 endmember spectra in the samples was determined and mean values ± remain sd are reported in Table 3 and in the graph of Fig. 3. The measurements were repeated after several hours from the sample preparation and up to 5 hours the spectra and values of spectral distribution were similar in the range of ±1%.
Table 1
Typical bands (nm) in spectral intervals of the HDFM spectra of the RBC components in solutions or suspensions
| Bands (nm) | |||||||
| 500–524 | 525–549 | 550–574 | 575–599 | 600–624 | 625–649 | 650–674 | |
| Phospholipid | 525 | 563 | 595 | 620 | |||
| Cholesterol | 583 | 616 | |||||
| Hemoglobin | 555 | ||||||
| Protoporphyrin | 505 | 550, 555, 564 | 605, 618 | 654 | |||
| Spectrin | 515 | 605, 618 | 636 | 660 | |||
Fig. 2.
Optical image of erythrocyte (A) and the HDFM spectral library composed by 8 spectral endmembers with arbitrary color code (B). Enlargement of one erythrocyte (C); matching of the spectral library (D); matching of the 5 components shown in Fig. 1(F).
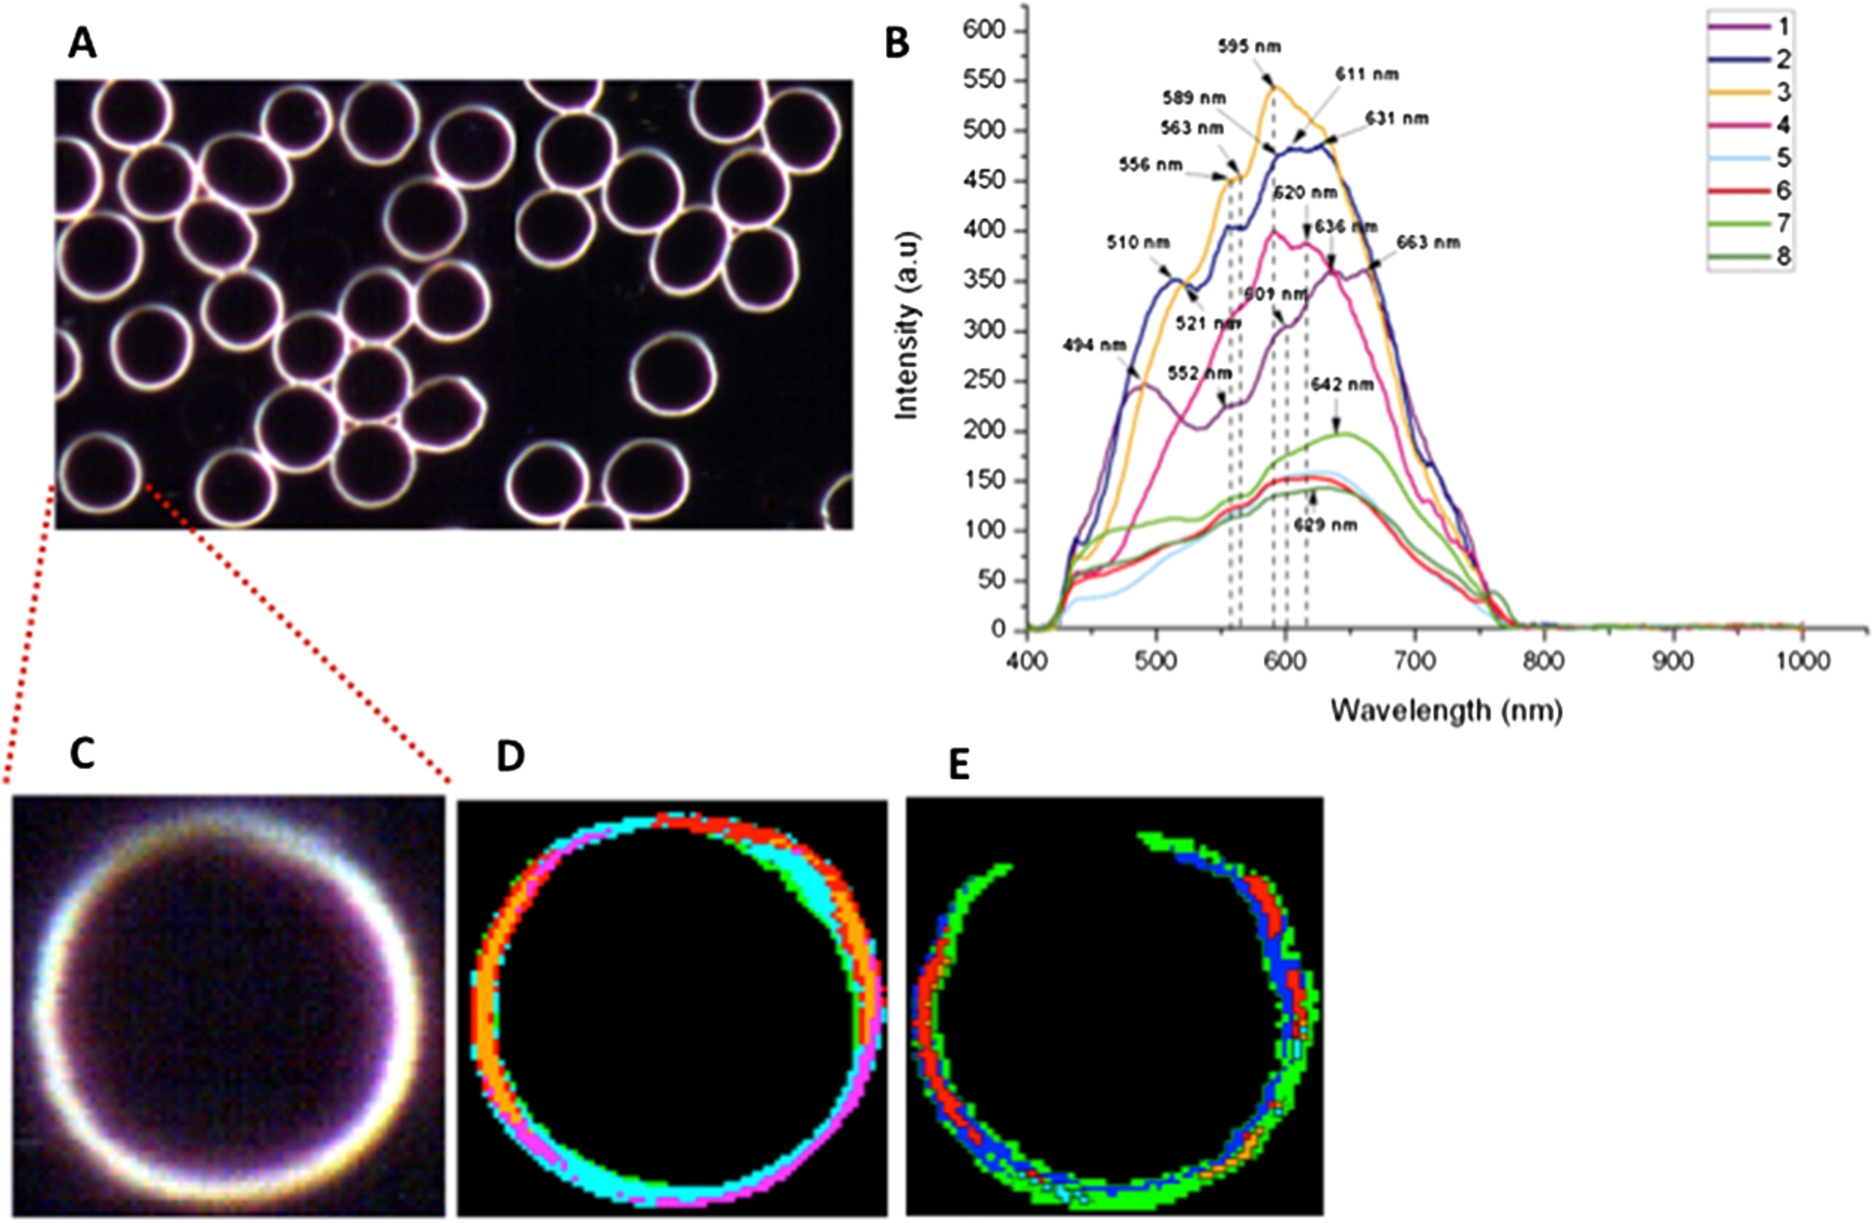
Table 2
The 8 endmembers of the RBC HDFM spectral library with typical bands (nm)
| Bands (nm) | |||||||
| 500–524 | 525–549 | 550–574 | 575–599 | 600–624 | 625–649 | 650–674 | |
| Spectrum 1 | 494 | 552 | 601 | 636 | 663 | ||
| Spectrum 2 | 510 | 556 | 589 | 611 | 631 | ||
| Spectrum 3 | 521 | 556, 563 | 595 | ||||
| Spectrum 4 | 563 | 595 | 620 | ||||
| Spectrum 5 | 563 | 601, 620 | |||||
| Spectrum 6 | 550 | 598 | 605, 620 | ||||
| Spectrum 7 | 515 | 559 | 593 | 607 | 642 | ||
| Spectrum 8 | 502 | 572 | 629 | ||||
Table 3
Percent of spectral distribution (mean values ± SEM) of the 8 spectral endmembers of the RBC library shown in Fig. 2, present in the RBC samples (
| Spectrum # | Distribution (%) |
| 1 | 0.722 ± 0.063 |
| 2 | 2.581 ± 0.270 |
| 3 | 7.371 ± 0.214 |
| 4 | 11.861 ± 1.821 |
| 5 | 54.414 ± 2.160 |
| 6 | 10.991 ± 0.582 |
| 7 | 6.684 ± 0.509 |
| 8 | 5.512 ± 0.265 |
3.Results and discussion
3.1.HDFM spectra of RBC components
Erythrocytes are widely used for diagnostic purposes and highly interesting for application of spectroscopic methods. The aim of this work was to assess a protocol for the use of HDFM as methodology to acquire comprehensive spectral and spatial information on this blood cell, starting from the fact that in a previous report from some of us interesting perspectives were highlighted, although the protocol was not optimized for a spectra library and spectra were acquired without light subtraction [25]. Since RBC components contribute to the whole spectral and spatial characteristics, measurements started from five representative molecules in solutions or suspensions, prepared as described in Section 2, respectful of their in vivo concentrations as reported in the literature [7,11,12,17]. Phospholipids are the structural elements of cell membranes and were used as multilamellar liposomes of 200 nm diameters, choosing egg lecithin as material, since its phospholipid diversity is close to the mixture of human erythrocyte membrane phospholipids. The other lipid constituent of membranes is cholesterol, which has several roles, such as the well-known support to the organization of membrane in a typical ratio with phospholipids [10] and emerging roles for signaling effects [24]. The spectra of phospholipids and cholesterol are shown in Fig. 1 ((A) and (B), respectively). Three representative proteins were also chosen namely, hemoglobin and its heterocyclic organic portion of protoporphyrin IX, as well as spectrin, as cytoskeleton protein, thus providing some of the most relevant spectral characteristics related to membrane and submembrane environment of the RBC complementary to what has been described with other techniques, such as in vivo surface-enhanced Raman spectroscopy [1]. The spectra are shown in Fig. 1(C)–(E).
In Fig. 1(F) the spectra of the five components are collected with a color code arbitrarily chosen for subsequent mapping. In Table 1 the main bands recognized from the spectra of each component are shown.
The data of hemoglobin were previously described in hyperspectral imaging, identifying its oxygenated and deoxygenated forms [21], and in surface-enhanced Raman spectroscopy the presence of hemoglobin connected to membrane protein (band 3) was evidenced at 5–7 nm distance from the surface [1]. The hemoglobin and protoporphyrin ring features are important in order to see whether the mapping of these submembrane components is possible with HDFM. It was also shown that bands between 500 and 660 nm in hyperspectral imaging, corresponding to haemoglobin and its deoxygenated form, could be diagnostically used for estimating the peripheral artery disease (PAD) [2]. The data presented in Table 1 confirmed hemoglobin and protoporphyrin spectral characteristics. To our knowledge these are the first collected information of single RBC components in hyperspectral imaging, which are not meant to be exhaustive. Using the protocol herein described, other RBC components can be further evaluated. The performed HDFM spectra were then used for RBC mapping as described below.
3.2.HDFM spectral library of RBC
Whole blood, treated with EDTA as anticoagulant, was obtained from healthy volunteers (30 samples) and the protocol was set up as described in Section 2. We designed a step-by-step procedure consisting of the preparation of experimental samples of human RBC in their natural medium (whole blood) and the analysis of the optical image, in order to create a HDFM spectral library in the wavelength window of visible near-infrared (VNIR 400 nm–1000 nm). It is worth noting that the use of whole blood was initially considered to reduce the manipulation of the samples and to keep the natural RBC environment without artifacts, for example, concerning centrifugation procedures and change of the medium, that could affect the original membrane characteristics. We verified that optical images shown in Fig. 2(A) remained unchanged from the moment of the acquisition up to 5 hours after the analysis, and the measurements were reproducible with variability of ±1%.
The acquisition of the HDFM spectral data was performed as described in Section 2 and gave rise to the spectral library shown in Fig. 2(B), constituted of 8 spectra with characteristic bands listed in Table 2. This library was confirmed for 30 samples of human blood of healthy individuals, using 3 RBC cells for each measurement and repeating the samples in triplicates. The relative percentage distribution of the 8 spectral endmembers was then obtained by the SAM function of the HDFM equipment on each measurement, as shown in Table 3 (mean values ± sd) and in the graphic of Fig. 3. It was gratifying to see that the measurements were reproducible for the same sample, choosing different erythrocyte images, and among the measurements, the sd values being very little, thus confirming the sample stability and protocol reliability.
Applying the spectral library to the optical image of RBC, the good matching is evident, as observed by comparing Fig. 2(C) and (D).
We are aware that hyperspectral images of biological samples, such as cells, represent combination of thousands of data and appropriate algorithms are needed in order to analyse and transform these data into diagnostic tools, as already done for detection of objects in military field [9,14]. The methodology on RBCs presented herein can offer a first representative example of a relatively simple, but potentially diagnostical important, cell type that can be monitored. Indeed, RBCs are enucleated cells and do not present cytoplasmic structures (no internal structure), therefore their properties are linked mostly to their membrane and sub-membrane constituents and corresponding organization, as already reported in Raman spectroscopy [1].
3.3.HDFM spectral signatures of single molecules in the HDFM RBC spectral library
Having the spectral characteristics of RBC key components and the RBC spectral library in our hands, we could use the hyperspectral image analysis software (ENVI 4.4 and ITT) to envisage the RBCs components in the whole cell, as identified based on the unique spectral response of each species. Applying the SAM function with these reference libraries, healthy RBCs can be mapped; in other words, the system identifies the regions of optical image where the molecular component is present by mapping its spectrum. The resulting matching is shown in Fig. 2(E). Although the reference library is not complete, the good matching with the optical image can be appreciated. A precise matching of the characteristic bands between the molecular components and the RBC spectral endmembers can be obtained by comparing the bands in Tables 1 and 2.
It was gratifying to see that the presence of single molecular components can be detected as bands in the whole RBC spectra. In particular: (i) being phospholipids the most concentrated molecules of the cell membrane, bands attributable to them were present in spectra 3, 4, 5 at 563 nm and in spectra 3 and 4 at 595 nm; (ii) spectrum 4 represented a complete phospholipid signature, including also the band at 620 nm. However, the presence of bands attributable to the hemoglobin and its heterocyclic portion cannot be ruled out (see below); (iii) two typical cholesterol bands at 583 and 616 nm were present in spectrum 2, although with a 5–6 nanometers hyperchromic shift; (iv) hemoglobin band at 555 nm can be recognized in spectra 2 and 3, which present also bands relative to protoporphyrin moiety which is the heterocyclic organic ring of the heme moiety; (v) protoporphyrin moiety is recognized in spectra 3 and 5 with the band at 564 nm, but the superimposition with the band of phospholipids cannot give diagnostic value; however, in spectrum 5 other signatures of this heterocyclic portion could be identified at 601 and 620 nm, as well as those of phospholipids, as previously said; (vi) spectrum 6 shows various bands attributable to protoporphyrin moiety (550, 605, 620 nm); (vii) spectrum 7 contains bands typical of spectrin (515 nm); (viii) spectrum 8 contains a band at 502 nm closer to the protoporphyrin signature at 505 nm.
The optical density is also affected by the adsorption of molecular components in the whole cell environment, as known for haemoglobin and pigment packaging, which contributes to the intensity of the different endmembers [6]. The expansion of the single component library is in progress and will certainly allow the full identification of molecular contributions to the RBC spectral signatures.
4.Conclusions
For the first time HDFM mapping of human healthy RBCs was obtained by assessing a reference spectral library of 8 endmembers and by evaluating their spectral percentage distribution in the imaging. HDFM spectra comprehensively describe the contribution of erythrocyte components with their organization and packing at the level of membrane and sub-membrane regions. Some of the bands of the HDFM spectra matched the bands obtained by typical RBC molecular components, demonstrating the possibility of mapping single molecules, small or large as proteins, as well as getting information on the organizational modes, such as realized by the membrane phospholipid assembly. By the approach herein described, the potentiality of hyperspectral imaging of RBC and its components for clinical applications can be envisaged [26]. Indeed, here we described a fast, easy and repeatable protocol that encourages studies in large cohorts, to explore the potentiality of the HDFM mapping of RBCs in different health conditions, as well as to integrate HDFM data with other diagnostics and therapies, such as personalized lipidomic profiles, studies on RBC aging [22], and membrane-targeted therapies [16].
Acknowledgements
This project has received funding in the form of the salary for ML that Lipinutragen srl received through the funding of the MSCA-ITN-2014-ETN – Marie Skłodowska-Curie ITN project CLICKGENE (#642023), supporting the research activity as part of her PhD training program. The authors wish to thank Dr. Giorgia Giacometti and Dr. Elina Spiratou for their technical support. Lipinutragen srl for providing support in the preparation of the blood samples in the Lipidomic laboratory facilities.
Competing financial interests
CM declares that Valsambro srl is interested in the marketing of the application of the hyperspectral analysis for diagnostics. CF is co-founder of the company Lipinutragen srl, born as spin-off officially recognized by the National Council of Research. Lipinutragen srl is interested in developments of membrane diagnostics in health care. No other competing financial interests are declared.
References
1 | [[1]] N. Brazhe, S. Abdali, A.R. Brazhe, O.G. Luneva, N.Y. Bryzgalova, E.Y. Parshina, O.V. Sosnovtseva and G.V. Maksimov, New insights into erythrocyte through in vivo surface-enhanced Raman spectroscopy, Biophysical J. 97: ((2009) ), 3206–3214. |
2 | [[2]] J.A. Chin, E.C. Wang and M.R. Kibbe, Evaluation of hyperspectral technology for assessing the presence and severity of peripheral artery disease, J. Vasc. Surgery 54: ((2012) ), 1679–1688. |
3 | [[3]] K. Darwiche, P. Zarogoulidis, L. Krauss, F. Oezkan, R.F. Walter, R. Werner, D. Theegarten, L. Sakkas, A. Sakkas, W. Hohenforst-Scmidt, K. Zarogoulidis and L. Freitag, “One-stop shop” spectral imaging for rapid on-site diagnosis of lung cancer: A future concept in nano-oncology, Int. J. Nanomedicine 8: ((2013) ), 4533–4542. |
4 | [[4]] S. de Oliveira and C. Saldanha, An overview about erythrocyte membrane, Clin. Hemorheol. Microcirc. 44: ((2010) ), 63–74. |
5 | [[5]] C. Ferreri and C. Chatgilialoglu, Membrane Lipidomics for Personalized Health, Wiley & Sons, New York, (2015) . |
6 | [[6]] J.C. Finlay and T.H. Foster, Effect of pigment packaging on diffuse reflectance spectroscopy of samples containing red blood cells, Optics Lett. 29: ((2004) ), 965–967. |
7 | [[7]] P. Froom, E. Kristal-Boneh, J. Benbassat, R. Ashkanazi and J. Ribak, Predictive value of determinations of zinc protoporphyrin for increased blood lead concentrations, Clin. Chem. 44: ((1998) ), 1283–1288. |
8 | [[8]] M. Hammer, D. Schweitzer, B. Michel, E. Thamm and A. Kolb, Single scattering by red blood cells, Appl. Opt. 37: ((1998) ), 7410–7418. |
9 | [[9]] A.T. Harris, Spectral mapping tools from the Earth sciences applied to spectral microscopy data, Cytometry Part A 69A: ((2006) ), 872–887. |
10 | [[10]] S.W. Hui, C.M. Stewart, M.P. Carpenter and T.P. Stewart, Effects of cholesterol on lipid organization in human erythrocyte membrane, J. Cell Biology 85: ((1980) ), 283–291. |
11 | [[11]] K.J. Jeon, S.-J. Kim, K.K. Park, J.-W. Kim and G. Yoon, Noninvasive total hemoglobin measurement, J. Biomed. Opt. 7: ((2002) ), 45–50. |
12 | [[12]] D.G. Kakhniashvili, L.A. Bulla Jr. and S.R. Goodman, The human erythrocyte proteome, Molecular & Cellular Proteomics 3: ((2004) ), 501–509. |
13 | [[13]] S.J. Leavesley, N. Annamdevula, J. Boni, S. Stocker, K. Grant, B. Troyanovsky, T.C. Rich and D.F. Alvarez, Hyperspectral imaging microscopy for identification and quantitative analysis of fluorescently-labeled cells in highly autofluorescent tissue, J. Biophotonics 5: ((2012) ), 67–84. |
14 | [[14]] D. Manolakis, D. Marden and G.A. Shaw, Hyperspectral image processing for automatic target detection applications, Lincoln Laboratory Journal 14: ((2003) ), 79–115. |
15 | [[15]] M.E. Martin, M.B. Wabuyele, K. Chen, P. Kasili, M. Panjehpour, M. Phan, B. Overholt, G. Cunningham, D. Wilson, R.C. Denovo and T. Vo-Dinh, Development of an advanced hyperspectral imaging (HSI) system with applications for cancer detection, Ann. Biomed. Eng. 34: ((2006) ), 1061–1068. |
16 | [[16]] G.L. Nicolson and M.E. Ash, Lipid replacement therapy: A natural medicine approach to replacing damaged lipids in cellular membranes and organelles, restoring function, Biochim. Biophys. Acta 1838: ((2014) ), 1657–1679. |
17 | [[17]] M. Nikolić, D. Stanić, N. Antonijević and V. Niketić, Cholesterol bound hemoglobin in normal human erythrocytes: A new form of cholesterol in circulation?, Clin. Biochem. 37: ((2004) ), 22–26. |
18 | [[18]] A. Rocha, Y. Zhou, S. Kundu, J.M. Gonzalez, S. BradleighVinson and H. Liang, In vivo observation of gold nanoparticles in the central nervous system of Blaberus discoidalis, J. Nanobiotechnology 9: ((2011) ), 5. doi:10.1186/1477-3155-9-5. |
19 | [[19]] R.A. Schultz, T. Nielsen, J.R. Zavaleta, R. Ruch, R. Wyatt and H.R. Garner, Hyperspectral imaging: A novel approach for microscopic analysis, Cytometry 43: ((2001) ), 239–247. |
20 | [[20]] A.M. Siddiqi, H. Li, F. Faruque, W. Williams, K. Lai, M. Hughson, S. Bigler, J. Beach and W. Johnson, Use of hyperspectral imaging to distinguish normal, precancerous, and cancerous cells, Cancer 114: ((2008) ), 13–21. |
21 | [[21]] B.S. Sorg, B.J. Moeller, O. Donovan, Y. Cao and M.W. Dewhirst, Hyperspectral imaging of hemoglobin saturation in tumor microvasculature and tumor hypoxia development, J. Biomed. Opt. 10: ((2005) ), 44004. |
22 | [[22]] A. Stier, S. Reichert, F. Criscuolo and P. Bize, Red blood cells open promising avenues for longitudinal studies of ageing in laboratory, non-model and wild animals, Exp. Gerontol. 71: ((2015) ), 118–134. |
23 | [[23]] P. Tarasov, M. Yurkin, P. Avrorov, K. Semyaov, A. Hoekstra and V. Maltsev, Optics of erythrocytes, in: Optics of Biological Particles, A. Hoekstra et al., eds, Springer, Netherlands, (2007) , pp. 243–259. |
24 | [[24]] R. van Zwieten, A.E. Bochem, P.M. Hilarius, R. van Bruggen, F. Bergkamp, G.K. Hovingh and A.J. Varhoeven, The cholesterol content of erythrocyte membrane is an important determinant of phosphatidyl exposure, BBA Molecular Cell Biology Lipids 1821: ((2012) ), 1493–1500. |
25 | [[25]] G.S. Verebes, M. Melchiorre, A. Garcia-Leis, C. Ferreri, C. Marzetti and A. Torreggiani, Hyperspectral enhanced dark field microscopy for imaging blood cells, J. Biophotonics 6: ((2013) ), 960–967. |
26 | [[26]] R. Weissleder and V. Ntziachristos, Shedding light onto live molecular targets, Nat. Medicine 9: ((2003) ), 123–128. |
27 | [[27]] M. Wojdyla, S. Raj and D. Petrov, Absorption spectroscopy of single red blood cells in the presence of mechanical deformations induced by optical traps, J. Biomed. Opt. 17: ((2012) ), 97006. doi:10.1117/1.JBO.17.9.097006. |


