
In vivo stiffness assessment of patellar and quadriceps tendons by strain ultrasound elastography
Abstract
BACKGROUND:
The patellar and quadriceps tendons are responsible for the extension mechanism of the knee joint and frequently become inflamed during sports. Diagnosis and determination of when an athlete can return to sports following these injuries are usually performed by assessing morphological features and functional outcomes. Nevertheless, mechanical properties are not being assessed.
OBJECTIVE:
To describe the stiffness characteristics of these two tendons over the range of knee flexion and to test the feasibility of using strain ultrasound elastography (SE).
METHODS:
SE with an acoustic coupler as the reference was performed for nine healthy males. Relative stiffness measurements were obtained using the strain ratio (SR = target tissue strain/reference strain) by placing the knee in five different flexion angles. Lower SR indicates higher relative stiffness.
RESULTS:
This study showed reliable measurement with good intra- and inter-rater agreement for SR at 30°. SR of the quadriceps tendon decreases as knee flexion increases, indicating increased relative stiffness. In the patellar tendon, no significant difference was observed between 30° and 60°. Beyond 60°, relative stiffness increased constantly.
CONCLUSIONS:
SE is a reproducible and feasible tool to monitor relative stiffness of the patellar and quadriceps tendons in routine clinical settings.
1.Introduction
The patellar and quadriceps tendons play a major role in the extension mechanism of the knee joint, and are responsible for increasing torque from the quadriceps muscles by increasing the moment arm of the extension mechanism. These extensor tendons are vulnerable to inflammation due to repetitive stress placed on the knee during sports activities, involving jumping, kicking and landing. Known as “jumper’s knee”, this is a frequent injury in sports. About 53% of patients with jumper’s knee reportedly retire from sports and symptoms can persist even 15 years after onset [1]. The site of proximal attachment of the patellar tendon (inferior pole of the patella) is most commonly affected. The superior pole of the patella (insertion of the quadriceps tendon) and the tibial tuberosity (distal attachment of the patellar tendon) are less commonly affected. Clinical diagnosis of tendinitis is commonly confirmed using ultrasonography and magnetic resonance imaging (MRI). However, many athletes reportedly present with symptoms of tendinopathy without showing morphological changes [2]. Assessment of mechanical properties of the recovering tendon is thus important to determine whether healing and flexibility are sufficient to allow a return to sports.
Various studies have investigated mechanical properties of the tendons in vitro, using tensile testing methods [3–5]. A small number of studies have conducted in vivo analyses using MRI [6] and ultrasonography [7–11]. Kobayashi et al. measured deformation of the length of the patellar tendon under weight-bearing flexion of the knee using combined MRI and dual fluoroscopy [12]. Edama et al. [13] measured the same at knee flexion angles of 0°, 30°, 60° and 90° using ultrasound B-mode imaging. However, differences are noticeable in the observed fundamental properties of the tendons between studies, and some methods are not feasible for application in daily clinical practice to periodically monitor changes in stiffness following injury or treatment.
Strain ultrasound elastography (SE) is a relatively new ultrasound-based technique that estimates soft-tissue stiffness. This modality was initially used to differentiate between benign and malignant lesions, especially in the breast and liver. However, the utility of SE in musculotendinous structures has recently been shown in many studies [8,9,14–16]. SE estimates the stiffness of soft tissues by creating tissue displacement/tissue strain under a known external pressure as applied by the ultrasound transducer. Several studies have shown SE offers a tool for reproducibly measuring stiffness characteristics of the patellar tendon [8,9]. Ozcan et al. [9] described hardness as higher in the quadriceps tendon than in the patellar tendon, with no difference in tendon stiffness between athletes and healthy individuals. Generally, stiffness properties of soft tissues varied with applied load, joint position and the region of the tissue [10,17,18]. Previous SE studies have assessed stiffness of the patellar and quadriceps tendons at one joint position. This study was therefore designed to determine stiffness values for these two tendons from full extension to maximum flexion of the knee joint, and to clarify the feasibility of using SE in routine clinical practice.
2.Materials and methods
2.1.Participants
Right-sided patellar and quadriceps tendons of 9 healthy males (mean age, 22.63 ± 0.89 years) who had no prior history of chronic knee pain or musculoskeletal problems in their lower limbs were examined. This study was approved by the institutional internal review board, and written informed consent was obtained from each participant prior to participation.
Fig. 1.
(a) Acoustic coupler. (b) The acoustic coupler is fixed to the ultrasound linear transducer.
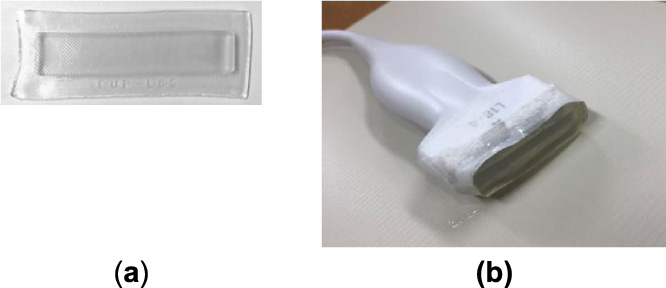
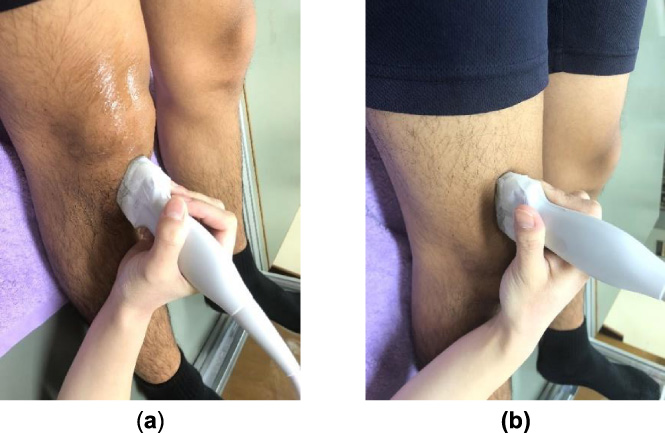
Fig. 2.
Ultrasound transducer placement for the patellar and quadriceps tendons. (a) Measurement site for the patellar tendon. (b) Measurement site for the patellar tendon.
2.2.Experimental procedure
We used the same methodology described in our previous study, in which we analyzed stiffness of the joint capsule of the knee [18]. SE was performed using a general-purpose ultrasound device (Sonimage HS1; Konica Minolta, Tokyo, Japan) with a 4- to 18-MHz linear ultrasound transducer (L18-4, Konica Minolta, Tokyo, Japan). SE determines the stiffness of a target tissue relative to that of an adjacent soft tissue or reference. This study used an acoustic coupler with known Young’s modulus (22.6 ± 2.2 kPa) as the reference recommended as a standard reference material by previous studies using SE (EZU-TEATC2; Hitachi Aloka Medical Corp., Tokyo, Japan) [15,16]. The acoustic coupler was attached to the top of the transducer (Fig. 1). The measurement site for the patellar tendon was the anterior aspect of the knee. The transducer was placed between the inferior pole of the patellar and the tibial tuberosity. For the quadriceps tendon, it was placed superior to the superior pole of the patella (Fig. 2).
Stiffness measurements were obtained by placing the knee in knee flexion angles of 0°, 30°, 60°, 90° and maximum flexion. The knee was bent to the corresponding joint angles with the participant in a supine position with a firm wedge beneath the knee. To stabilize the knee joint and maintain the neutral position of the feet, a fixation device was used. It is a steel frame with a movable footrest which was placed on the examination couch. By moving the foot rest upwards and downwards, the knee joint can be stabilized at each flexion angle while maintaining the neutral position of the feet. Prior to SE assessment, the participant was asked to perform a squatting movement 10 times to precondition soft tissues around the knee joint.
Fig. 3.
Strain and B-mode images of the middle portion of the patellar tendon. The strain indicator, the strains of the tendon (B) and, the coupler (A) are displayed. The ROI of the coupler is indicated as a yellow rectangle, the tendon portion measured is outlined in yellow and, the strain ratio of the tendon is indicated in red.
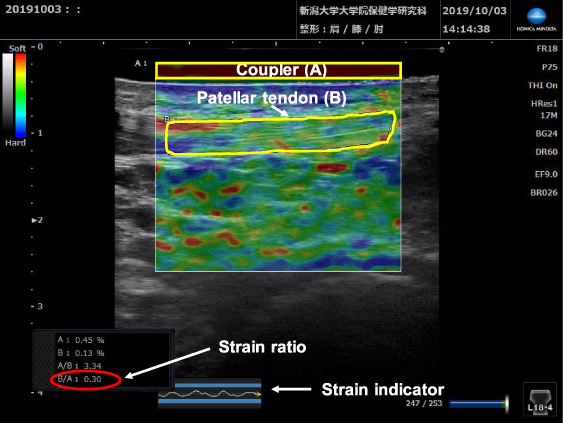
In this study middle regions of the patellar and quadriceps tendons were assessed. The ultrasound transducer was placed longitudinally over the corresponding tendon and repeated light compressions were applied to induce strain. In SE, strain distribution is displayed in real-time on a color-coded map superimposed on the usual B-mode image, with stiffer areas shown in blue and softer areas in red. Uniformity of manual compressions was maintained by referring to the strain indicator on the strain image, and by maintaining constant strain distribution of 0.45–0.55 at the reference. The ratio of strain in the target tissue to that in the reference (strain ratio (SR)) was calculated using the built-in software of the SE machine using a combined autocorrelation method [19],
(1)
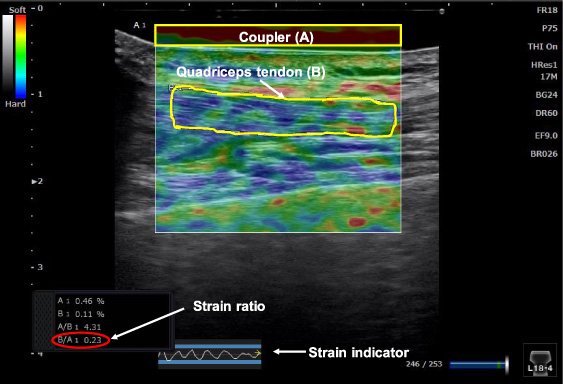
Fig. 4.
Strain and B-mode images of the middle portion of the quadriceps tendon. The strain indicator, the strains of the tendon (B) and the coupler (A) are displayed. The ROI of the coupler is indicated as a yellow rectangle, the tendon portion measured is outlined in yellow and the strain ratio of the tendon is indicated in red.
2.3.Data analysis
We assessed the measurement reliability of SR using intraclass correlation coefficient (ICC) at a knee flexion angle of 30°. Three SRs were obtained in each participant by two examiners to test intra-rater (ICC1,3) reliability as the reliability between measurements obtained by the same examiner, and inter-rater (ICC2,3) reliability as the reliability between measurements obtained by different examiners. To compare differences in SR at each knee flexion angle, multiple-comparison one-way ANOVA with the post-hoc Tukey test was used. To compare relative stiffness between the patellar and quadriceps tendon simple t-test was used. All statistical analyses were performed using SPSS statistical software (version 23; SPSS, IBM Corp., Armonk, NY, USA).
3.Results
ICC1,3 values for SR obtained for the patellar and quadriceps tendons ranged from 0.75 to 0.95, and ICC2,3 values ranged from 0.82 to 0.97. These values indicated good measurement reliability (Table 1).
Table 1
Intra- and inter-rater reliabilities for strain ratio (SR) measurements obtained in patellar and quadriceps tendons at 30° of knee flexion
| Patellar tendon | Quadriceps tendon | |
| Rater 1 | ||
| Minimum SR | 0.22 | 0.17 |
| Maximum SR | 0.38 | 0.34 |
| Mean ± SD of all 3 measurements | 0.28 ± 0.04 | 0.24 ± 0.06 |
| Intra-rater repeatability (ICC1,3) | 0.87 | 0.95 |
| Rater 2 | ||
| Minimum SR | 0.23 | 0.14 |
| Maximum SR | 0.39 | 0.34 |
| Mean ± SD of all 3 measurements | 0.31 ± 0.04 | 0.24 ± 0.06 |
| Intra-rater repeatability (ICC1,3) | 0.75 | 0.93 |
| Inter-rater repeatability (ICC2,3) | 0.82 | 0.97 |
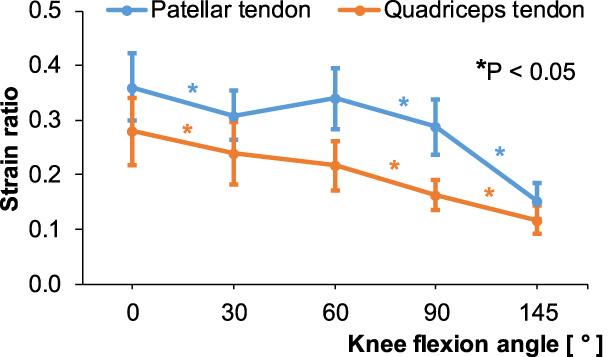
In the patellar tendon, SR was highest at full knee extension and lowest at maximum knee flexion angle. SR decreased between 0–30° and beyond 60° (p < 0.05). However, the change of SR between 30–60° was not significant (Fig. 5). In the quadriceps tendon, similar to the patellar tendon, maximum SR was seen at full knee extension and was lowest at maximum knee flexion angle. SR decreased with increasing knee flexion angle, indicating that relative stiffness increased when reaching maximum flexion (p < 0.05) (Fig. 5).
Fig. 5.
Strain ratios (SR) of the patellar and quadriceps tendons according to knee flexion angle. The asterisk colors correspond to the two tendons.
4.Discussion
The present study assessed the reproducibility and feasibility of SE in the evaluation of the patellar and quadriceps tendons in healthy adults, and examined tendencies in tendon stiffness along the knee flexion pathway. We observed good intra- and inter-rater agreement for SR obtained from both tendons at a flexion angle of 30°, assuring measurement reliability. These results are in accordance with a study by Porta et al. [8] that observed moderate to excellent reliability when assessing patellar tendons in healthy adults using SE. Values for the ICC1,3 and ICC2,3 obtained from the present study were higher than those reported by Porta et al. [8]. This may be attributable to certain modifications added to the present study methodology. We used an acoustic coupler as the reference when obtaining SR, instead of using an internal soft-tissue as seen in many previous studies [8,9,14,20]. Mechanical properties of internal references, such as in fat pads and subcutaneous tissues, are individually variable and may also vary with the joint position at which the examiner determines SR of the target tissue [21]. SE is considered as an operator-dependent technique because soft-tissue strain is induced under manually applied compressions. To ensure uniformity in compressions, we maintained a constant strain distribution of 0.45–0.55 in the coupler for all flexion angles in each participant. The present study measured SR of the entire tendon area as much as possible. Many previous studies have presented the stiffness of soft tissues by assessing smaller soft-tissue areas [7]. However, a smaller area may not adequately represent the stiffness distribution of the entire soft tissue. Studies have shown that the stiffness characteristics of soft tissues vary with joint movement angle [10,11,17,18]. Pearson et al. [10] observed changes in strain of the patellar tendon varied with knee flexion angle in their study using B-mode ultrasound imaging and an automated pixel-tracking method. The present study therefore measured stiffness behaviors of the patellar and quadriceps tendons during the entire range of knee flexion motion. Soft tissues are viscoelastic structures with mechanical properties that vary according to the applied strain rate. This study preconditioned soft tissues in the knee joint with squatting movements prior to SE assessment to minimize the influence of viscosity on tendon stiffness. The resulting good measurement reliability in the present study suggests the feasibility of using SE to assess stiffness characteristics of the patellar and quadriceps tendons in routine clinical settings. When diagnosing patellar or quadriceps tendinitis, SE can be incorporated into commonly used diagnostic modalities, especially for patients with symptoms of tendinitis who do not show morphological changes on MRI or ultrasound assessments [22]. SE can also be used as an additional tool for determining when an athlete with jumper’s knee or some other tendon pathology can return to sports. Functional outcomes such as pain-free range of motion, muscle strength and endurance are typically the only parameters being assessed at present.
This study observed that tendons were relatively less stiff at a flexion angle of 0° and that stiffness was greater in maximum knee flexion. The relative stiffness of the quadriceps tendon increased constantly from 0° to 145°. In the patellar tendon, relative stiffness did not increase constantly, and remained almost the same at flexions angles of 30° and 90°, thereafter increasing constantly. The quadriceps tendon comprises a fusion of tendons from the rectus femoris, vastus medialis, vastus lateralis and vastus intermedius muscles. The superficial fibers of the quadriceps tendon extend distally as the patellar tendon [23]. Stiffness characteristics of the quadriceps tendon may thus resemble those of the patellar tendon. Kobayashi et al. [12] measured the length change pattern of the patellar tendon using MRI and fluoroscopy. They observed increases in length from 15° to 60° and beyond 90°. Edama et al. [13] measured the same pattern using ultrasound B-mode, and showed no change in length between 30° and 90°, representing findings similar to our own. With regard to the tendency of relative stiffness of the quadriceps tendon during the knee flexion pathway, Ebihara et al. [11] also observed a rapid increase in the elastic modulus as knee flexion increased in their study, which used shear-wave elastography.
Force ratios of the patellar and quadriceps tendons are important parameters in understanding the kinematics of the knee joint. Force magnitudes of these two tendons were obtained from in vitro studies using calculation methods with kinematic data [24]. The stiffness of tendons relates to tensional force. In SE, applied compression forces displace the target tissue transversely. Hence, SE can be considered to measure bending stiffness. We therefore calculated the ratio of stiffness of the patellar and quadriceps tendons: Spt∕Sqt at each knee flexion angle by normalizing SR at 0°. Spt and Sqt were calculated as follows,
(2)
The maximum stiffness ratio was 1.0, observed at 30° and the minimum was 0.8, observed at 90°. Beyond 90°, the stiffness ratio showed an upward tendency (Fig. 6). These results support the findings of Huberti et al. [25], who measured tendon forces directly using strain gauges and buckle transducers in cadaveric knee joints. They observed maximum force ratios for the patellar and quadriceps tendons of 1.2 at 0° and a minimum ratio of 0.7 at 90°. Beyond 90°, the force ratio was constant at 0.7. The difference in results observed between the present study and the study by Huberti et al. [25] may be attributable to differences in loading conditions under in vivo and in vitro situations. Beyond 90°, the patellofemoral contact area moves upwards and causes an increase in quadriceps force. The present results for stiffness ratios are similar to previously published calculation-based methods [24] and studies using MRI [26] (Table 2). We therefore recommend SE as a feasible, direct method to measure stiffness magnitudes of the patellar and quadriceps tendons and, this method is easily applied under in vivo situations.
Fig. 6.
Stiffness ratio of the patellar and quadriceps tendons (Spt∕Sqt) at each knee flexion angle.
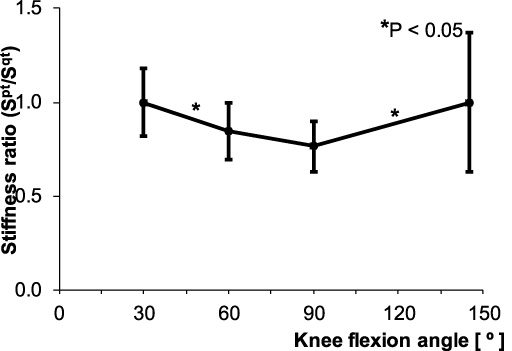
Table 2
Comparison of the present results of the stiffness ratio of the patellar and quadriceps tendons at each knee flexion angle with the force ratio of the same tendons observed in previous studies
| Flexion angle | |||||||
| Authors | Parameter | 0° | 30° | 60° | 90° | 120° | 145° |
| Huberti et al. [24] | Force ratio | 1.0 | 1.3 | 0.9 | 0.6 | 0.6 | |
| Gill and O’Connor [25] | Force ratio | 1.1 | 0.9 | 0.8 | 0.6 | 0.6 | |
| Im et al. [26] | Force ratio | 1.2 | 0.9 | 0.7 | |||
| Present study | Stiffness ratio | 1.0 | 0.8 | 0.8 | 1.0 | ||
This study has shown changes in relative stiffness of the quadriceps and patellar tendons from full extension to maximum flexion of the knee in normal healthy adults using SE. These basic data may be useful in diagnosing and rehabilitation of jumper’s knee and for other tendon pathologies in the quadriceps and patellar tendons. We have also shown that relative stiffness of both tendons was greatest at maximum knee flexion position. We can thus recommend beginning loading of the knee with extension and gradual progression to higher flexion angles during rehabilitation treatment following tendon pathologies.
This study showed several limitations. First, the number of participants was small and all were in their early twenties. Similar studies thus need to be conducted on a larger population comprising different age groups, as well as on athletes with tendon pathologies. Second, we assessed only the middle portion of tendons. However, relative stiffness needs to be assessed at insertion sites of the tendons to clarify whether stiffness changes by region.
5.Conclusions
The present study showed SE as a feasible, reproducible tool for assessing relative stiffness of the patellar and quadriceps tendons during routine clinical practice. The findings of this study facilitate a more complete understanding of changes in the stiffness of these tendons during knee flexion.
Conflict of interest
None to report.
References
[1] | J.A. Kettunen, M. Kvist, E. Alanen and U.M. Kujala, Long-term prognosis for jumper’s knee in male athletes. A prospective follow-up study, Am J Sports Med 30: (5) ((2002) ), 689–692. doi:10.1177/03635465020300051001. |
[2] | J.L. Cook, K.M. Khan, P.R. Harcourt, Z.S. Kiss, M.W. Fehrmann, L. Griffiths , Patellar tendon ultrasonography in asymptomatic active athletes reveals hypoechoic regions: A study of 320 tendons. Victorian Institute of Sport Tendon Study Group, Clin J Sport Med 8: (2) ((1998) ), 73–77. doi:10.1097/00042752-199804000-00001. |
[3] | D.L. Butler, M.D. Kay and D.C. Stouffer, Comparison of material properties in fascicle-bone units from human patellar tendon and knee ligaments, J Biomech 19: (6) ((1986) ), 425–432. doi:10.1016/0021-9290(86)90019-9. |
[4] | B.T. Haraldsson, P. Aagaard, M. Krogsgaard, T. Alkjaer, M. Kjaer and S.P. Magnusson, Region-specific mechanical properties of the human patella tendon, J Appl Physiol 98: (3) ((2005) ), 1006–1012. doi:10.1152/japplphysiol.00482.2004. |
[5] | J.L. Krevolin, M.G. Pandy and J.C. Pearce, Moment arm of the patellar tendon in the human knee, J Biomech 37: (5) ((2004) ), 785–788. doi:10.1016/j.jbiomech.2003.09.010. |
[6] | F.T. Sheehan and J.E. Drace, Human patellar tendon strain. A noninvasive, in vivo study, Clin Orthop Relat Res 370: ((2000) ), 201–207. |
[7] | N.S. Berko, A.K. Mehta, T.L. Levin and J.F. Schulz, Effect of knee position on the ultrasound elastography appearance of the patellar tendon, Clin Radiol 70: (10) ((2015) ), 1083–1086. doi:10.1016/j.crad.2015.06.100. |
[8] | F. Porta, N. Damjanov, F. Galluccio, A. Iagnocco and M. Matucci-Cerinic, Ultrasound elastography is a reproducible and feasible tool for the evaluation of the patellar tendon in healthy subjects, Int J Rheum Dis 17: (7) ((2014) ), 762–766. doi:10.1111/1756-185X.12241. |
[9] | A.N. Ozcan, S. Tan, N.G. Tangal, S. Ciraci, S. Kudas, S.B. Bektaser , Real-time sonoelastography of the patellar and quadriceps tendons: Pattern description in professional athletes and healthy volunteers, Med Ultrason 18: (3) ((2016) ), 299–304. doi:10.11152/mu.2013.2066.183.ays. |
[10] | S.J. Pearson, A.S.A. Mohammed and S.R. Hussain, Patellar tendon in vivo regional strain with varying knee angle, J Biomech 61: ((2017) ), 45–50. doi:10.1016/j.jbiomech.2017.06.038. |
[11] | B. Ebihara, H. Mutsuzaki and T. Fukaya, Relationships between quadriceps tendon elasticity and knee flexion angle in young healthy adults, Medicina (Kaunas) 55: (2) ((2019) ). doi:10.3390/medicina55020053. |
[12] | K. Kobayashi, M. Sakamoto, A. Hosseini, H.E. Rubash and G. Li, In-vivo patellar tendon kinematics during weight-bearing deep knee flexion, J Orthop Res 30: (10) ((2012) ), 1596–1603. doi:10.1002/jor.22126. |
[13] | M. Edama, R. Okuyama, S. Goto and M. Sasaki, Influence of loading rate and limb position on patellar tendon mechanical properties in vivo, Clin Biomech (Bristol, Avon) 61: ((2019) ), 52–57. doi:10.1016/j.clinbiomech.2018.11.006. |
[14] | E.E. Drakonaki, G.M. Allen and D.J. Wilson, Real-time ultrasound elastography of the normal Achilles tendon: Reproducibility and pattern description, Clin Radiol 64: (12) ((2009) ), 1196–1202. doi:10.1016/j.crad.2009.08.006. |
[15] | Y. Yamamoto, S. Yamaguchi, T. Sasho, T. Fukawa, Y. Akatsu, K. Nagashima , Quantitative ultrasound elastography with an acoustic coupler for Achilles tendon elasticity: Measurement repeatability and normative values, J Ultrasound Med 35: (1) ((2016) ), 159–166. doi:10.7863/ultra.14.11042. |
[16] | T. Muraki, H. Ishikawa, S. Morise, N. Yamamoto, H. Sano, E. Itoi , Ultrasound elastography-based assessment of the elasticity of the supraspinatus muscle and tendon during muscle contraction, J Shoulder Elbow Surg 24: (1) ((2015) ), 120–126. doi:10.1016/j.jse.2014.04.012. |
[17] | A. Hosseini, W. Qi, T.Y. Tsai, Y. Liu, H. Rubash and G. Li, In vivo length change patterns of the medial and lateral collateral ligaments along the flexion path of the knee, Knee Surg Sports Traumatol Arthrosc 23: (10) ((2015) ), 3055–3061. doi:10.1007/s00167-014-3306-9. |
[18] | S. Wadugodapitiya, M. Sakamoto, K. Sugita, Y. Morise, M. Tanaka and K. Kobayashi, Ultrasound elastographic assessment of the stiffness of the anteromedial knee joint capsule at varying knee angles, Biomed Mater Eng 30: (2) ((2019) ), 219–230. doi:10.3233/BME-191046. |
[19] | T. Shiina, N. Nitta, E. Ueno and J.C. Bamber, Real time tissue elasticity imaging using the combined autocorrelation method, J Med Ultrason 29: (3) ((2002) ), 119–128. doi:10.1007/BF02481234. |
[20] | A. Turan, M.A. Teber, Z.I. Yakut, H.A. Unlu and B. Hekimoglu, Sonoelastographic assessment of the age-related changes of the Achilles tendon, Med Ultrason 17: (1) ((2015) ), 58–61. doi:10.11152/mu.2013.2066.171.ayt. |
[21] | T. Hatta, N. Yamamoto, H. Sano and E. Itoi, In vivo measurement of rotator cuff tendon strain with ultrasound elastography: An investigation using a porcine model, J Ultrasound Med 33: (9) ((2014) ), 1641–1646. doi:10.7863/ultra.33.9.1641. |
[22] | C.C. Ooi, P.J. Richards, N. Maffulli, D. Ede, M.E. Schneider, D. Connell , A soft patellar tendon on ultrasound elastography is associated with pain and functional deficit in volleyball players, J Sci Med Sport 19: (5) ((2016) ), 373–378. doi:10.1016/j.jsams.2015.06.003. |
[23] | A.C. Waligora, N.A. Johanson and B.E. Hirsch, Clinical anatomy of the quadriceps femoris and extensor apparatus of the knee, Clin Orthop Relat Res 467: (12) ((2009) ), 3297–3306. doi:10.1007/s11999-009-1052-y. |
[24] | H.S. Gill and J.J. O’Connor, Biarticulating two-dimensional computer model of the human patellofemoral joint, Clin Biomech (Bristol, Avon) 11: (2) ((1996) ), 81–89. doi:10.1016/0268-0033(95)00021-6. |
[25] | H.H. Huberti, W.C. Hayes, J.L. Stone and G.T. Shybut, Force ratios in the quadriceps tendon and ligamentum patellae, J Orthop Res 2: (1) ((1984) ), 49–54. doi:10.1002/jor.1100020108. |
[26] | H.S. Im, O. Goltzer and F.T. Sheehan, The effective quadriceps and patellar tendon moment arms relative to the tibiofemoral finite helical axis, J Biomech 48: (14) ((2015) ), 3737–3742. doi:10.1016/j.jbiomech.2015.04.003. |


